. 2020 Jun 2;31(9):107701.
doi: 10.1016/j.celrep.2020.107701.

Epigenetic Reprogramming of Cancer-Associated Fibroblasts Deregulates Glucose Metabolism and Facilitates Progression of Breast Cancer

Affiliations

Epigenetic Reprogramming of Cancer-Associated Fibroblasts Deregulates Glucose Metabolism and Facilitates Progression of Breast Cancer

Lisa M Becker et al. Cell Rep. .

Abstract

The mechanistic contributions of cancer-associated fibroblasts (CAFs) in breast cancer progression remain to be fully understood. While altered glucose metabolism in CAFs could fuel cancer cells, how such metabolic reprogramming emerges and is sustained needs further investigation. Studying fibroblasts isolated from patients with benign breast tissues and breast cancer, in conjunction with multiple animal models, we demonstrate that CAFs exhibit a metabolic shift toward lactate and pyruvate production and fuel biosynthetic pathways of cancer cells. The depletion or suppression of the lactate production of CAFs alter the tumor metabolic profile and impede tumor growth. The glycolytic phenotype of the CAFs is in part sustained through epigenetic reprogramming of HIF-1α and glycolytic enzymes. Hypoxia induces epigenetic reprogramming of normal fibroblasts, resulting in a pro-glycolytic, CAF-like transcriptome. Our findings suggest that the glucose metabolism of CAFs evolves during tumor progression, and their breast cancer-promoting phenotype is partly mediated by oxygen-dependent epigenetic modifications.

Keywords: breast cancer; cancer-associated fibroblasts; epigenetic alterations; hypoxia; metabolism.


Conflict of interest statement

Declaration of Interests The authors declare no competing interests.

Figures
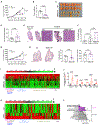
Figure 1.
Figure 1.. αSMA+ CAFs Display Enhanced Glycolytic Activity and Promote Primary Tumor Growth
(A) 4T1 orthotopic tumor growth in WT and αSMA-vTK mice. GCV start: day 12 post-4T1 implantation. WT, n = 7; αSMA-vTK, n = 8 mice. (B) Tumor weight at endpoint. (C) 4T1 tumors from WT (top) and αSMA-vTK (bottom) mice (tumors from trial 1, see Figure S2B). Scale bar: 10 mm. (D) Number of lung surface nodules at endpoint. (E) Representative H&E-stained lung sections with metastases outlined in black. Lungs from endpoint in (A) and from mice with 4T1 tumor burden of ~400 mm3 (GCV start). Scale bar, whole lung: 1 mm; scale bar, magnified image: 50 μm. (F) Percentage of metastatic burden computed from H&E-stained lung sections, Mann-Whitney test. Lungs at GCV start, n = 5. (G) Tumor growth in WT and αSMA-vTK mice implanted with Pymt tumors from GCV start (tumor volume >300 mm3). WT, n = 7, αSMA-vTK, n = 10 mice. (H) Quantification of lung metastatic burden and count of lung surface nodules in WT and αSMA-vTK mice injected intravenously with 4T1 cells. Scale bar: 2 mm. (I) Metabolite accumulation in αSMA-vTK tumors and WT tumors from n = 3 mice per group (tumors from trial 6; Figure S2B). (J) Transcript levels of key metabolic enzymes in mNFs and mCAFs; n = 2–4 distinct mice, 1-tailed unpaired t test, or Mann-Whitney test. (K and L) All metabolites (K) and selected metabolites (L) in mCAFs compared to mNFs. mNFs, n = 3 distinct mice; mCAFs, n = 2 distinct mice. Statistics in (A) and (G) performed on tumor volumes at endpoint. Data in (A), (B), and (F) also shown in trial 4 (Figure S2B). The data are presented as means or means ± SEMs. Individual dots in graphs depict distinct mice. Unless otherwise indicated, 2-tailed unpaired t test was used. p values are indicated in all of the graphs. GCV, ganciclovir; mCAFs: murine cancer-associated fibroblasts; mNFs, murine normal fibroblasts; n/a, not available (no metabolite captured); PPP, pentose phosphate pathway;TCA, tricarboxylic acid cycle; WT, wild-type.
Figure 2.
Figure 2.. CAFs and Cancer Cells Demonstrate Metabolic Cooperation to Promote Tumor Growth
(A) Schematic of CAFs-cancer cells lactate shuttle. (B) Slc16a1 (MCT1) expression in 4T1 cells with control (shScrbl) and Slc16a1 shRNA knockdowns (shMct1 #1 and shMct1 #2). n = 1 per cell line (average of 3 technical replicates). (C) Orthotopic tumor growth of 4T1 shScrbl (n = 5 mice), 4T1 shMct1 #1 (n = 5 mice) and 4T1 shMct1 #2 (n = 4 mice) cells. (D) Tumor weights of indicated experimental groups (endpoint). (E) Percentage of metastatic burden computed from H&E stained lung sections. (F) Representative αSMA immunolabeling in tumors in the indicated groups with quantification. Scale bar: 100 μm. (G) Gene expression for the indicated genes in shScrbl MEF and shPdk4 MEF. n = 1 per cell line (average of 3 technical replicates). (H) Lactate secretion of the indicated cells. n = 5–6 distinct wells of cells. (I) Tumor volume measurements. 4T1 + shScrbl MEF, n = 4; 4T1 + shPdk4 MEF, n = 5 mice. (J) Tumor weight from endpoint in (I). (K and L) Relative metabolite accumulation in 4T1 + shPdk4 MEF tumors (K) and FACS-purified cancer cells (L) compared to control 4T1+ shScrbl MEF tumors and FACS-purified cancer cells. n = 1 tumor per group (K), and n = 1 pool of 4T1 cells from n = 4 4T1 + shScrbl MEF and n = 5 4T1 + shPdk4 MEF tumors (L). Heatmap shows the metabolites involved in glycolysis and the TCA cycle. Statistics in (C) and (I) performed on tumor volumes at endpoint. The data are presented as means or means ± SEMs. Individual dots in graphs depict distinct mice. 2-tailed unpaired t test (H–J) or 1-way ANOVA (C–F), p values are indicated in all of the graphs. MEF, murine embryonic fibroblasts.
Figure 3.
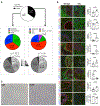
Figure 3.. Heterogeneity in Breast Cancer Biopsies Used to Generate hBFs and hCAFs
(A) Distribution of pathological findings and mammographic densities of breast tissue biopsies (n = 499). See also Table S1. (B) Representative immunostaining of benign and IDC tissue sections for the listed antigens with quantitation. Single-color channels were altered individually based on background signal to enhance images. Scale bar: 20 μm. n = 7 cases per group. (C) Representative pictures of fibroblasts isolated from benign and cancer tissues. Scale bar: 200 μm. The data are presented as means or means ± SEMs. Individual dots in graphs depict distinct patient tissues. 2-tailed unpaired t test or Mann-Whitney test; p values are indicated in all of the graphs. Calc, calcification, DCIS/LCIS, ductal/lobular cancer in situ; hBFs, human benign (breast) fibroblasts; hCAFs: human breast cancer-associated fibroblasts; IDC, invasive ductal carcinoma; IDLC, invasive ductal-lobular carcinoma; IMC, invasive mammary carcinoma.
Figure 4.
Figure 4.. hCAFs Are Pro-glycolytic Compared to Fibroblasts from Benign Lesions
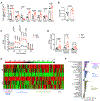
(A) Gene expression for the indicated genes in hBFs and hCAFs. hBFs, n = 4–6 distinct cases; hCAFs, n = 4 distinct cases, 1-tailed unpaired t test, or Mann-Whitney test. (B) Lactate secretion in hBFs and hCAFs. n = 4 distinct cases per group. (C) Glycolysis stress test. Arrows indicate the addition of glucose (20 min), oligomycin (42 min), and 2DG (65 min). n = 6 distinct cases of hCAFs and hBFs. (D) Measurements of glycolysis, glycolytic capacity, and reserve for the cell lines in (C). Calculations are described in STAR Methods. (E and F) Heatmap of all detected metabolites (E) and changes in metabolite accumulation (F) in hCAFs compared to hBFs. hBFs, n = 3 distinct cases; hCAFs, n = 3 distinct cases. The data are presented as means or means ± SEMs. Individual dots depict fibroblasts from distinct patients. p values are indicated in all of the graphs. 2-tailed unpaired t test or Mann-Whitney test, unless otherwise indicated. aa metabolism, amino acid metabolism; ECAR, extracellular acidification rate; hBFs, human benign (breast) fibroblasts; hCAFs, human (breast) cancer-associated fibroblasts; n/a, not available (no metabolite captured); PPP, pentose phosphate pathway; 2DG, 2-deoxy-glucose; TCA, tricarboxylic acid cycle.
Figure 5.
Figure 5.. CAF-Secreted Metabolites Fuel the Biosynthetic Pathways of Cancer Cells
(A) [U-13C] glucose-derived metabolites in hCAFs (48 h incubation). n = 1 case. (B) Experimental setup (see STAR Methods for details). (C) Top 17 hCAF-secreted 13C labeled metabolites (n = 1 case; 8/17 indicates 8 out of the 17 secreted metabolites are part of PPP and nucleotide metabolism). (D) Top 12 13C-labeled metabolites in MDAMB231 cells after uptake (n = 1; 4/12 indicates 4 of the 12 secreted metabolites are part of PPP and nucleotide metabolism). Green dots: metabolites associated with PPP and nucleotide metabolism. CM, conditioned media; hCAFs, human breast cancer-associated fibroblasts; Nucl. metabolism, nucleotide metabolism; PPP, pentose phosphate pathway.
Figure 6.
Figure 6.. Differential DNA Methylation of Rate-Limiting Glycolytic Enzyme Genes in hCAFs
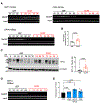
(A) Methylation status of PKM, FBP1, and LDHA in hBFs and hCAFs. (B) HIF1A gene expression in hBFs (n = 4 distinct cases) and hCAFs (n = 5 distinct cases), 1-tailed unpaired t test. (C) HIF-1α and β–Tubulin protein levels, 2-tailed unpaired t test. (D) Methylation status of HIF1A in hBFs and hCAFs. (E) Expression of indicated genes in hBFs untreated (black bar) and treated with 5-Aza (blue bars). For each gene, data were normalized to baseline expression when untreated. hBFs from 3 distinct patients in 3 independent experiments were used (total of 8 biological replicates, as 1 line was only used for 2 distinct experiments). Paired 1-tailed t tests. The numbers in the graphs denote the fibroblast line (case ID). Individual dots in graphs depict fibroblasts from distinct patients. The data are presented as means or means ± SEMs. 5-Aza, 5-azacytidine; hBFs, human benign (breast) fibroblasts; hCAFs, human (breast) cancer-associated fibroblasts.
Figure 7.
Figure 7.. Chronic Hypoxia Is Sufficient to Promote Stable Upregulation of HIF-1α Stabilized by Epigenetic Rewiring
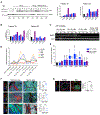
(A) hBFs from n = 2 cases (#32 and #33) were cultured in increasing durations of hypoxia with or without subsequent 48-h periods of re-oxygenation (21% O2). HIF-1α and β–Actin protein levels in the described conditions characterized by western blot and associated quantification. The dotted line denotes baseline expression in 21% O2 (day 0). (B) HIF1A gene expression in the described conditions. (C) Methylation status of HIF1A gene in hBFs subjected to the indicated conditions (27, 32, and 54 represent patient numbers; see Tables S1 and S2). (D) Relative mRNA expression of glycolytic genes in hBFs subjected to increasing periods of hypoxia; each time point followed by re-oxygenation. n = 1 hBF (#21). The experiment was performed in 6-well plates with 3 wells per condition (technical replicates). For the qPCR, each replicate was plated in duplicates, which for analysis were averaged (see source data). (E) Expression of indicated genes in hBFs cultured in hypoxia for 3 days, followed by 24 h of re-oxygenation. n = 3 distinct patients (#21, #43, #129; see Table S2); data for patient #21 also shown in (D). Dotted line indicates baseline expression in 21% O2. 1-tailed paired t tests or Wilcoxon matched-pairs signed-rank test. (F) Immunolabeling of Pymt tumors for CAIX and αSMA together with HK2 (top panel), PKM2 (center panel), and FBP1 (bottom panel). Ten distinct tumors from the experiment in Figure S7D were used for quantification. Mann-Whitney test. (G) Immunolabeling for CAIX and αSMA with quantification. n = 4 benign and 4 cancer tissues. Mann-Whitney test. Single-color channels were altered individually based on background signal to enhance images. The data are presented as means or means ± SEMs. Individual dots depict tissues from distinct mice or patients. d0, d1, (…), d7, day 0, day 1, (…), day 7; Hypoxia, 1% O2; IRS, immunoreactive score; MW, molecular weight; N, normoxia (21% O2); #, no statistical analysis, because SLC2A1 expression was only measured in patient #21. p values are indicated in all of the graphs.

References

    1. Albrengues J, Bertero T, Grasset E, Bonan S, Maiel M, Bourget I, Philippe C, Herraiz Serrano C, Benamar S, Croce O, et al. (2015). Epigenetic switch drives the conversion of fibroblasts into proinvasive cancer-associated fibroblasts. Nat. Commun 6, 10204. - PMC - PubMed
    1. Alkasalias T, Moyano-Galceran L, Arsenian-Henriksson M, and Lehti K (2018). Fibroblasts in the Tumor Microenvironment: Shield or Spear? Int. J. Mol. Sci 19, E1532. - PMC - PubMed
    1. Ammirante M, Shalapour S, Kang Y, Jamieson CA, and Karin M (2014). Tissue injury and hypoxia promote malignant progression of prostate cancer by inducing CXCL13 expression in tumor myofibroblasts. Proc. Natl. Acad. Sci. USA 111, 14776–14781. - PMC - PubMed
    1. Borriello L, Nakata R, Sheard MA, Fernandez GE, Sposto R, Malvar J, Blavier L, Shimada H, Asgharzadeh S, Seeger RC, and DeClerck YA (2017). Cancer-Associated Fibroblasts Share Characteristics and Protumorigenic Activity with Mesenchymal Stromal Cells. Cancer Res. 77, 5142–5157. - PMC - PubMed
    1. Branco MR, Ficz G, and Reik W (2011). Uncovering the role of 5-hydrox-ymethylcytosine in the epigenome. Nat. Rev. Genet 13, 7–13. - PubMed

Publication types

MeSH terms