. 2020 Jun 2;31(9):107704.
doi: 10.1016/j.celrep.2020.107704.

TMEM163 Regulates ATP-Gated P2X Receptor and Behavior

Affiliations

TMEM163 Regulates ATP-Gated P2X Receptor and Behavior

Elizabeth J Salm et al. Cell Rep. .

Abstract

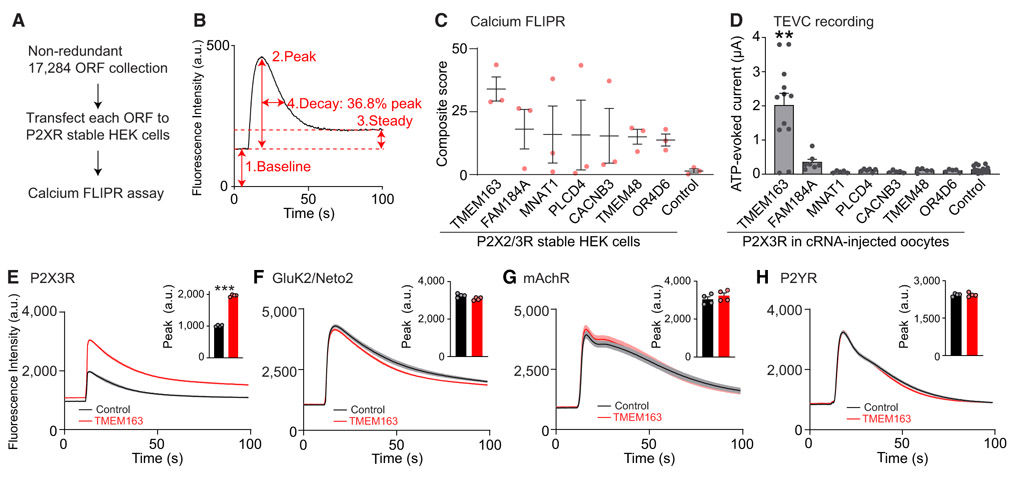
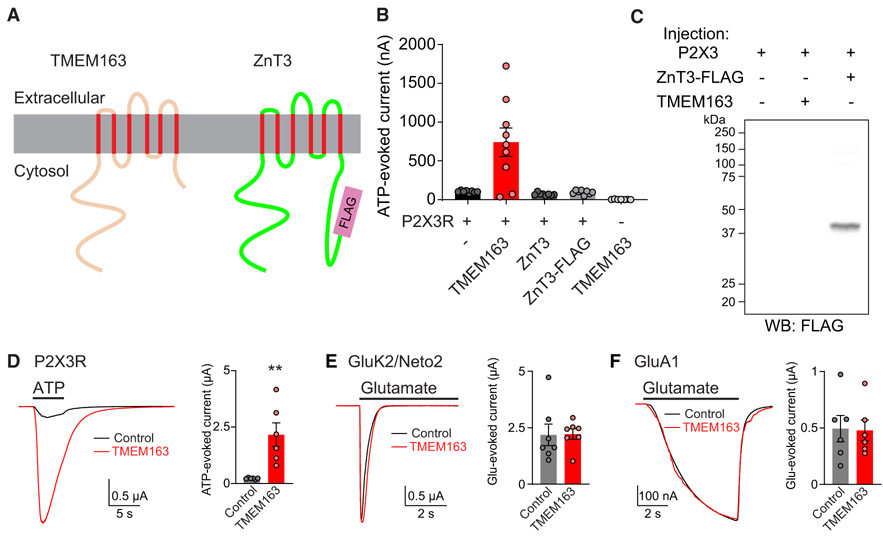
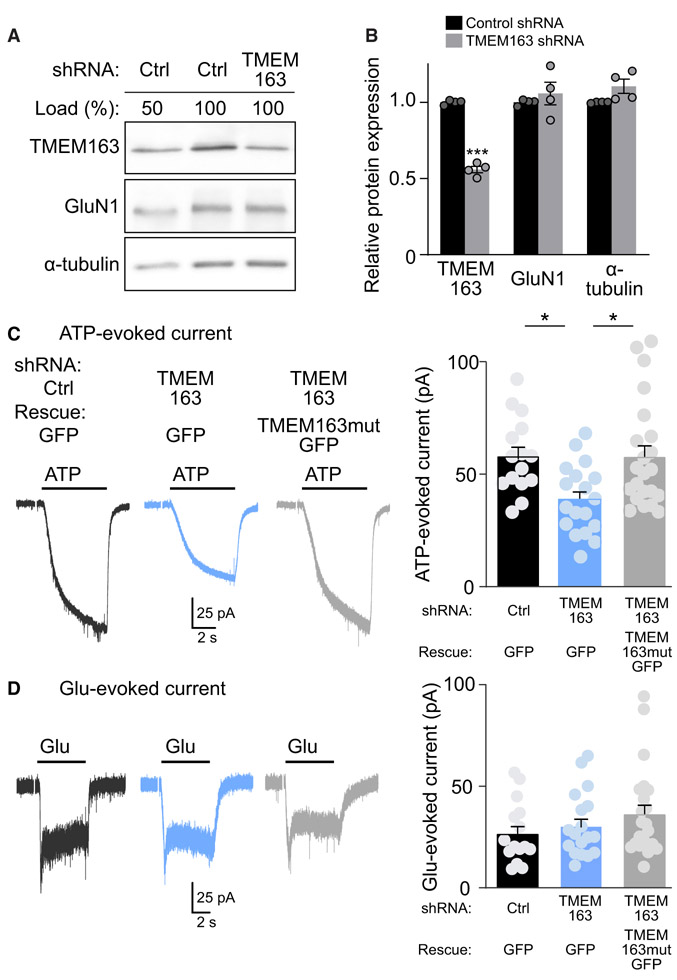
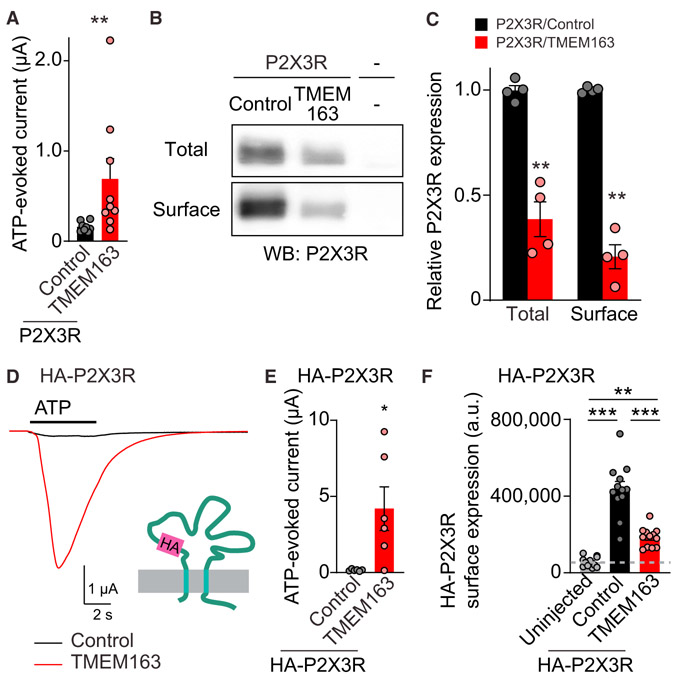
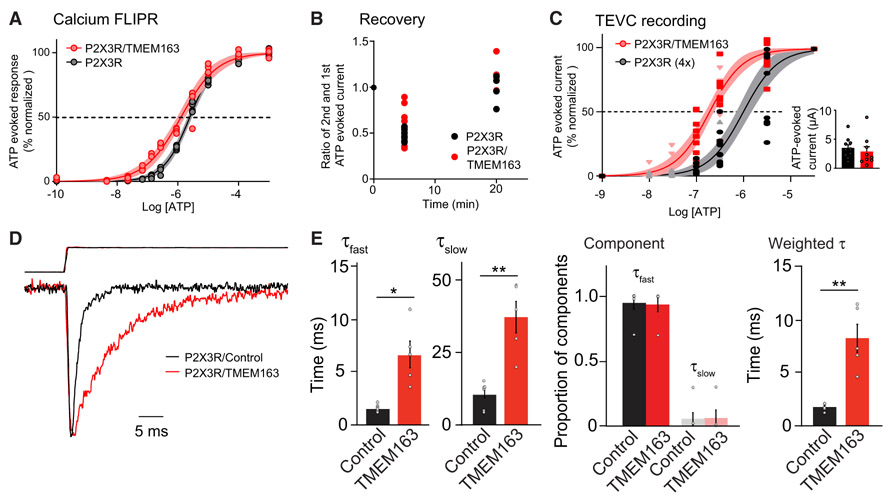
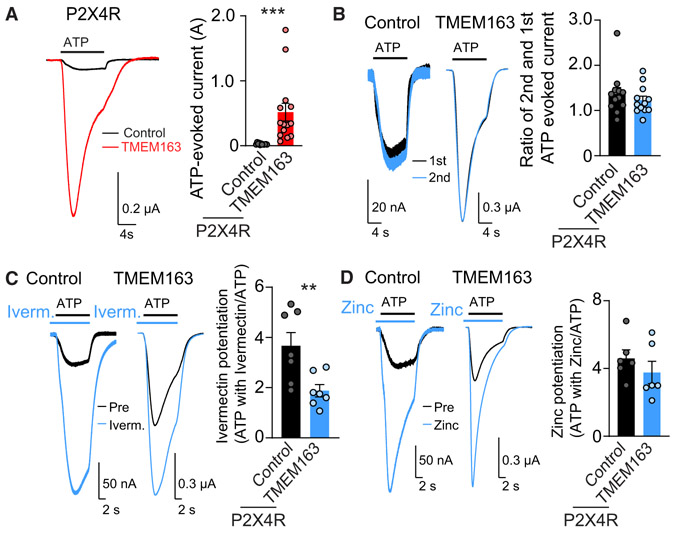
Fast purinergic signaling is mediated by ATP and ATP-gated ionotropic P2X receptors (P2XRs), and it is implicated in pain-related behaviors. The properties exhibited by P2XRs vary between those expressed in heterologous cells and in vivo. Several modulators of ligand-gated ion channels have recently been identified, suggesting that there are P2XR functional modulators in vivo. Here, we establish a genome-wide open reading frame (ORF) collection and perform functional screening to identify modulators of P2XR activity. We identify TMEM163, which specifically modulates the channel properties and pharmacology of P2XRs. We also find that TMEM163 is required for full function of the neuronal P2XR and a pain-related ATP-evoked behavior. These results establish TMEM163 as a critical modulator of P2XRs in vivo and a potential target for the discovery of drugs for treating pain.

Keywords: ATP; P2X receptor; TMEM163; channel; chennel property; genome-wide ORF collection; ion channel; modulator; neuron; pharmacology.


Conflict of interest statement

Declaration of Interests The research being reported in this publication was supported by materials purchased from OriGene Technologies. The terms of this purchase have been reviewed and approved by Yale University in accordance with its policy on objectivity in research.

Figures

Figure 1.
Figure 1.. Genome-wide ORF-Based FLIPR Screening Identifies a P2X3R Modulator
(A) Scheme of genome-wide ORF-based FLIPR screening. (B) Analysis of each FLIPR response. Individual calcium FLIPR traces were analyzed using four different factors shown on the example trace: (1) baseline, (2) peak, (3) steady state, and (4) decay, as the time to reach 36.8% of the peak from the peak time, as well as the ratios of peak and baseline (5) and steady state and baseline (6) as baseline-normalized values. The effect of these factors were then multiplied together, creating a composite score for hit ORF prioritization. (C) The top seven P2XR-specific ORFs and RFP (control) are listed based on composite score (n = 3). (D) ATP (300 nM)-evoked currents were measured with two-electrode voltage clamp (TEVC) recording (Vh = −30 mV) from oocytes co-injected with 100 pg of P2X3R cRNA and 2 ng of cRNA for each ORF or Neto2 as a control (n = 5–20). (E–H) Modulation of agonist-evoked calcium FLIPR responses by TMEM163 co-expression. HEK cells or HEK cells stably expressing P2X3R or GluK2 and Neto2 were transiently transfected with TMEM163 or pcDNA3 (control). Agonist-induced calcium FLIPR responses were measured from transfected cells pre-incubated with 0.3 U/mL apyrase for 1 h. Summary bar graphs of peak amplitude are shown in insets (n = 4). TMEM163 enhanced peak and steady-state responses of the P2X3R-stable HEK cells in response to α,β-MeATP (55.5 μM, E). TMEM163 did not affect the calcium FLIPR responses of GluK2/Neto2-stable HEK cells in response to 3.33 μM kainate (F), of HEK cells to 1 mM acetylcholine probing endogenous muscarinic acetylcholine receptor (mAchR) (G), and of HEK cells to 100 μM ATP probing endogenous P2Y receptors (P2YRs) (H). Data are mean ± SEM. Kruskal-Wallis with Dunn’s post-test (D), two-way ANOVA followed by Bonferroni-Dunn’s post-test for (E)–(H); **p < 0.01; ***p < 0.001.
Figure 2.
Figure 2.. TMEM163 Specifically Enhances P2XR Activity
(A) Domain architecture of TMEM163 with its structural homolog, ZnT3, with FLAG epitope tag at the C terminus of ZnT3 (ZnT3-FLAG). (B) 300 nM ATP-evoked currents were measured from oocytes injected with combinations of cRNAs as indicated (P2X3R 25 pg; all others 2 ng) using TEVC recording (Vh = −30 mV, n = 7–9). (C) Expression of ZnT3-FLAG was confirmed at the expected molecular weight by western blotting (WB) of cRNA-injected oocyte lysate with anti-FLAG antibody. (D–F) Representative traces and quantification of agonist-evoked currents in cRNA-injected oocytes. cRNAs of 100 pg of P2X3R, 500 pg of GluK2 and 2 ng of Neto2, 1 ng of GluA1, 2 ng of TMEM163, and 2 ng of control (Neto2 for P2XR and GluA1 and ZnT3 for GluK2) were injected individually. TMEM163 co-expression enhanced 300 nM ATP-evoked currents of P2X3R (D), but not 500 μM glutamate-evoked currents of the kainate receptor, GluK2/Neto2 (E), or 10 μM glutamate with 50 μM cyclothiazide-evoked currents of the AMPA receptor, GluA1 (F) (n = 6–7). Data are mean ± SEM. Mann-Whitney U-test (D). **p < 0.01.
Figure 3.
Figure 3.. TMEM163 Potentiates P2XR Function in Cerebellar Granule Cells
Primary cerebellar granule neurons were treated with lentivirus carrying TMEM163 shRNA or a random sequence in parental pFUGW (Ctrl) as well as C-terminally GFP-tagged TMEM163 mutant resistant to the shRNA (TMEM163mutGFP). (A) Total protein amounts of TMEM163 and other proteins were measured in primary cerebellar granule neurons treated with shRNA lentivirus. For comparison, we loaded 50% of the control (Ctrl) lysate. (B) Quantitation of total protein amounts. TMEM163 shRNA significantly reduced TMEM163 protein compared with control shRNA. Total protein amounts of GluN1 and α-tubulin were unaltered (n = 4). (C and D) Agonist-evoked whole-cell currents were measured under whole-cell configuration (Vh = −70 mV) with the cell capacitance between 4.0–4.3 pF. Representative traces and quantitation of peak amplitudes of 100 μM ATP-evoked currents (C) or 100 μM Glu-evoked currents (D) upon 6-s application on neurons with a GFP signal from GFP or TMEM163mutGFP (n = 15–22). Artifacts of a 150 ms/2 mV pulse for cell capacitance measurement were omitted from traces shown. Data are mean ± SEM. Student’s t test (B) and one-way ANOVA, followed by Bonferroni’s post-test (C); *p < 0.05; ***p < 0.001.
Figure 4.
Figure 4.. TMEM163 Enhances ATP-Evoked P2XR Channel Activity
(A–C) Surface expression of P2X3R was biochemically measured in oocytes injected with cRNAs of 100 pg of P2X3R and 2 ng of TMEM163 or Neto2 (control). (A) TEVC recording (Vh = −30 mV, n = 8–9) showed an increase in 300 nM ATP-evoked currents by TMEM163 co-expression. (B) Total and surface expression of P2X3R in the oocytes. Proteins at the oocyte surface were biotinylated. The “Surface” and “Total” proteins were isolated with neutravidin and anti P2X3R antibody, respectively. (C) Quantification of P2X3R expression. P2X3R was detected in oocytes only injected with P2X3R cRNA, but not in “uninjected” oocytes, and co-injection of TMEM163 cRNA reduced both total and surface expression of P2X3Rs (n = 4). (D–F) Agonist-evoked currents and chemiluminescently detected surface expression of extracellularly HA-tagged P2X3R (HA-P2X3R) were measured in cRNA-injected oocytes (cRNA amount injected: 1 ng of HA-P2X3; 2 ng of TMEM163 or Neto2 indicated as a control). (D and E) HA epitope was inserted into the extracellular domain of P2X3R (HA-P2X3R). TMEM163 robustly enhanced ATP (1 μM)-evoked currents of HA-P2X3R. Representative traces (D) and summary bar graph (E) are shown (n = 6). (F) Surface expression of HA-P2X3R in oocytes was measured chemiluminescently. HA proteins at the oocyte surface were detected with anti-HA antibody under non-permeabilized conditions as chemiluminescence signal (n = 10). The signal from uninjected oocytes indicates background in this assay. Data are mean ± SEM. Mann-Whitney U-test (A and E), unpaired t test (C), one-way ANOVA with Bonferroni’s post-test (F); *p < 0.05; **p < 0.01; ***p < 0.001.
Figure 5.
Figure 5.. TMEM163 Shifts EC50 of ATP for P2XRs and Slows Decay Kinetics
(A) Calcium FLIPR response at various concentrations of ATP was measured in HEK cells stably expressing P2X3R transfected transiently with TMEM163 or pcDNA3. Apyrase was pre-incubated for 1 h before stimulation to reduce extracellular ATP. P2X3R-stably expressing HEK cells responded to ATP, and co-expression of TMEM163 shifted the ATP EC50 (EC50: 1.27 ± 0.11 μM for P2X3R with TMEM163 and 2.50 ± 0.09 μM for P2X3R, p = 0.0013; Hill coefficient: 0.73 ± 0.04 for P2X3R with TMEM163 and 0.99 ± 0.03 for P2X3R p = 0.0023, n = 4). Data are mean ± SEM. Student’s t test. (B and C) ATP-evoked currents from cRNA-injected oocytes were measured by TEVC recording (Vh = −30 mV). (B) TMEM163 did not affect recovery of ATP-evoked response of P2X3Rs at various intervals. ATP (10 μM)-evoked currents were measured at 5- or 20-min intervals, and the ratios of first and second ATP-evoked currents were calculated (n = 8). ATP-evoked responses were fully recovered with a 20-min interval. (C) TMEM163 shifted the ATP EC50 of P2X3R lower. To evaluate dose-response curves similarly, we adjusted the peak amplitudes of ATP-evoked currents of two conditions by injecting different amounts of P2X3R cRNAs: 25 pg of P2X3R with 2 ng of TMEM163 or 100 pg of P2X3R (4×) (small inset). We then measured ATP-evoked responses of various concentrations with a 20-min interval between stimulations for full recovery (n = 9). The estimated EC50 values were 0.26 ± 0.03 μM for P2X3R with TMEM163 and 1.30 ± 0.23 μM for P2X3R (4×). Hill coefficient: 0.98 ± 0.15 for P2X3R with TMEM163 and 1.04 ± 0.14 for P2X3R. (D and E) TMEM163 slows the decay kinetics of P2X3R. We transiently transfected TMEM163-IRES2-EGFP (TMEM163) or IRES2-EGFP (control) in P2X3R-stably expressing HEK cells and applied 100 μM ATP to outside-out patch membranes of transfected cells using a piezoelectric device for ultrafast agonist application. (D) Superimposed traces of 100 μM ATP-evoked, peak-normalized responses (bottom) and open tip response (top) from outside-out parch membranes expressing P2X3R with either control (black, n = 6) or TMEM163 (red, n = 5). (E) The decays of the currents were fitted with bi-exponential curves, and fast and slow decay time constants (τfast and τslow) estimated (see STAR Methods for details). TMEM163 slows both fast and slow decay components without changing a proportion of each component (n = 6 for control, n = 5 for TMEM163). As a result, TMEM163 expression significantly slowed the weighted decay time constant (τ). Data are mean ± SEM. Mann-Whitney U-test (E); *p < 0.05; **p < 0.01; ***p < 0.001.
Figure 6.
Figure 6.. TMEM163 Modulates P2XR Pharmacology
ATP-evoked responses were measured using TEVC recording (Vh = −30 mV) with various P2XR pharmacological reagents from oocytes co-injected with cRNAs of 25 pg of P2X4R and 2 ng of TMEM163 or Neto2 as a control. (A) TMEM163 enhanced the ATP-evoked currents of P2X4Rs. ATP (1.3 μM)-evoked responses were measured. Representative traces and quantification of the peak amplitudes (n = 12–14). (B) ATP (1.3 μM ATP)-evoked responses were measured at a 2-min interval. Representative traces and the ratio of peak amplitudes of the second to first ATP-evoked currents (n = 7). P2X4Rs both with and without TMEM163 recovered fully within 2 min after stimulation. (C and D) TMEM163 co-expression reduced ivermectin-mediated, but not zinc-mediated, potentiation of ATP-evoked P2X4R currents. ATP (1.3 μM)-evoked currents were measured, then 10 μM ivermectin (C) or 10 μM ZnCl2 (D) was applied for 10 s before stimulation with ATP (1.3 μM) along with each drug as shown by bars above traces. Representative traces and the ratios of ATP-evoked currents with and without ivermectin (C, n = 7) or ZnCl2 (D, n = 6). Data are mean ± SEM. Mann-Whitney U-test (A, C); **p < 0.01; ***p < 0.001.
Figure 7.
Figure 7.. TMEM163 Is a Modulator of ATP-Evoked Behavior and P2XR Activity In Vivo
(A) ATP-injected responses were evaluated for at least 4 min after injection of 3 μmol ATP into mouse hind paw. The mean cumulative durations of freezing behavior of wild-type (WT) and knockout (KO) mice were each significantly greater in response to ATP than to saline. On the other hand, the TMEM163 KO mice froze significantly less than WT mice in response to ATP, indicating that TMEM163 modulates this pain-related behavior (n = 10 for ATP-injected mice and 3 for saline-injected mice). (B) The mRNA expression of TMEM163 and P2XRs in mouse dorsal root ganglion (DRG) detected by fluorescence in situ hybridization (FISH). Low-magnification images (top) showed a heterogeneous expression of TMEM163, P2X3R, and P2X4R across DRG neurons. Middle: double-labeling FISH for TMEM163 (green) and P2X3R or P2X4R (red) showed TMEM163 mRNA was expressed in both P2X3R- and P2X4R-positive cells. Scale bars, 50 μm (top panels); 10 μm (middle and bottom panels). (C and D) ATP-evoked whole-cell responses were measured in primary DRG neurons from adult WT and TMEM163 KO mice under whole-cell configuration (Vh = −70 mV) with an inter-stimulus interval longer than 3 min for full recovery. (C) Representative traces and quantitation of peak amplitudes of 100 μM ATP-evoked currents (n = 11). Artifacts from 2 mV step for 150 ms for access resistance measurement were omitted from traces shown. (D) Representative traces and dose-response curves of peak amplitudes normalized at 1 mM (n = 5 each). The estimated EC50 values were 5.92 ± 1.17 μM for WT and 31.0 ± 15.1 μM for TMEM163 KO, and these EC50 values were significantly different (p = 0.006). The Hill co-efficient values were unaltered (1.52 ± 0.15 for WT and 1.93 ± 0.37 for TMEM163 KO). Data are mean ± SEM; one-way ANOVA with Bonferroni’s post-test (A), unpaired t test (C and D); *p < 0.05, ***p < 0.001.

References

    1. Barth J, Zimmermann H, and Volknandt W (2011). SV31 is a Zn2+-binding synaptic vesicle protein. J. Neurochem 118, 558–570. - PubMed
    1. Basbaum AI, Bautista DM, Scherrer G, and Julius D (2009). Cellular and molecular mechanisms of pain. Cell 139, 267–284. - PMC - PubMed
    1. Bleehen T, and Keele CA (1977). Observations on the algogenic actions of adenosine compounds on the human blister base preparation. Pain 3, 367–377. - PubMed
    1. Burnstock G (1977). The purinergic nerve hypothesis. Ciba Found. Symp (48), 295–314. - PubMed
    1. Burnstock G (2008). Purinergic signalling and disorders of the central nervous system. Nat. Rev. Drug Discov 7, 575–590. - PubMed

Publication types

MeSH terms