. 2020 Jun 2;31(9):107711.
doi: 10.1016/j.celrep.2020.107711.

Assembly and Function of a Bioengineered Human Liver for Transplantation Generated Solely from Induced Pluripotent Stem Cells

Affiliations

Assembly and Function of a Bioengineered Human Liver for Transplantation Generated Solely from Induced Pluripotent Stem Cells

Kazuki Takeishi et al. Cell Rep. .

Abstract

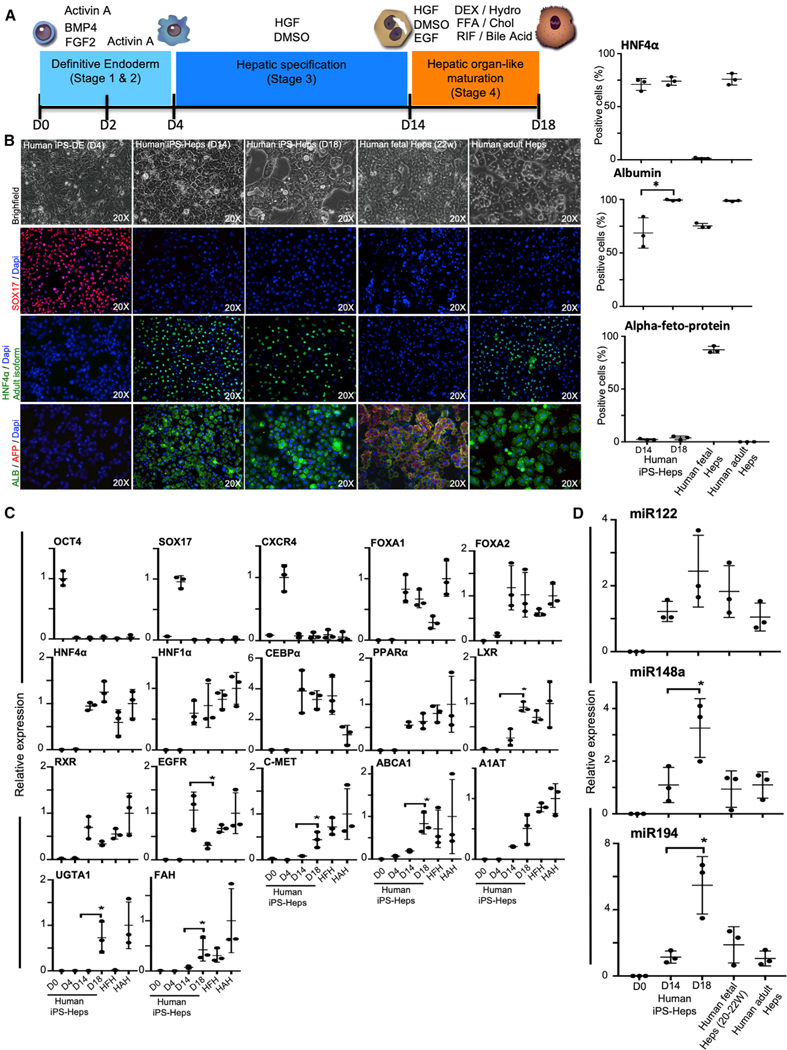
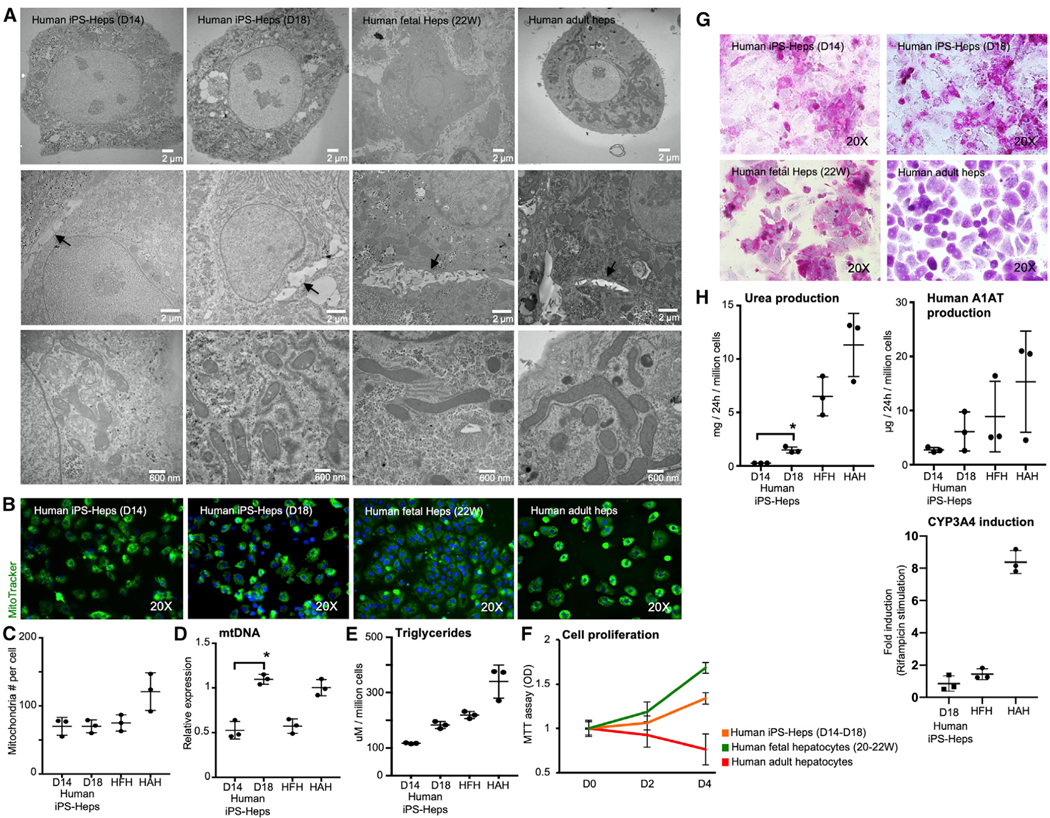
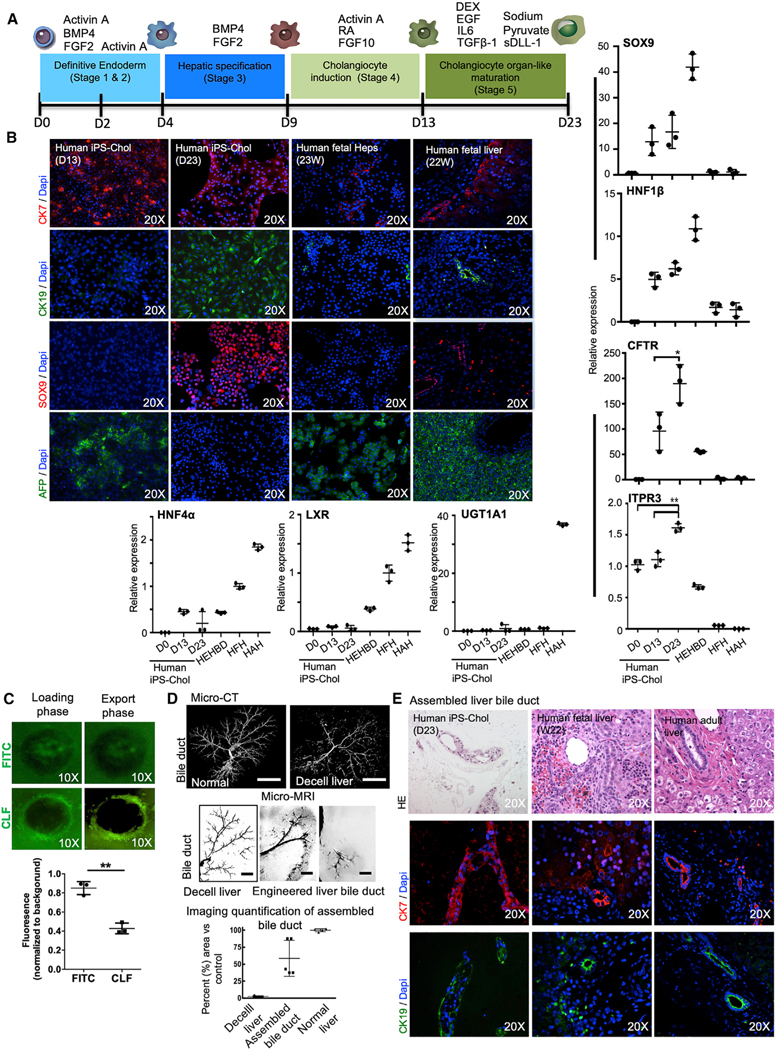
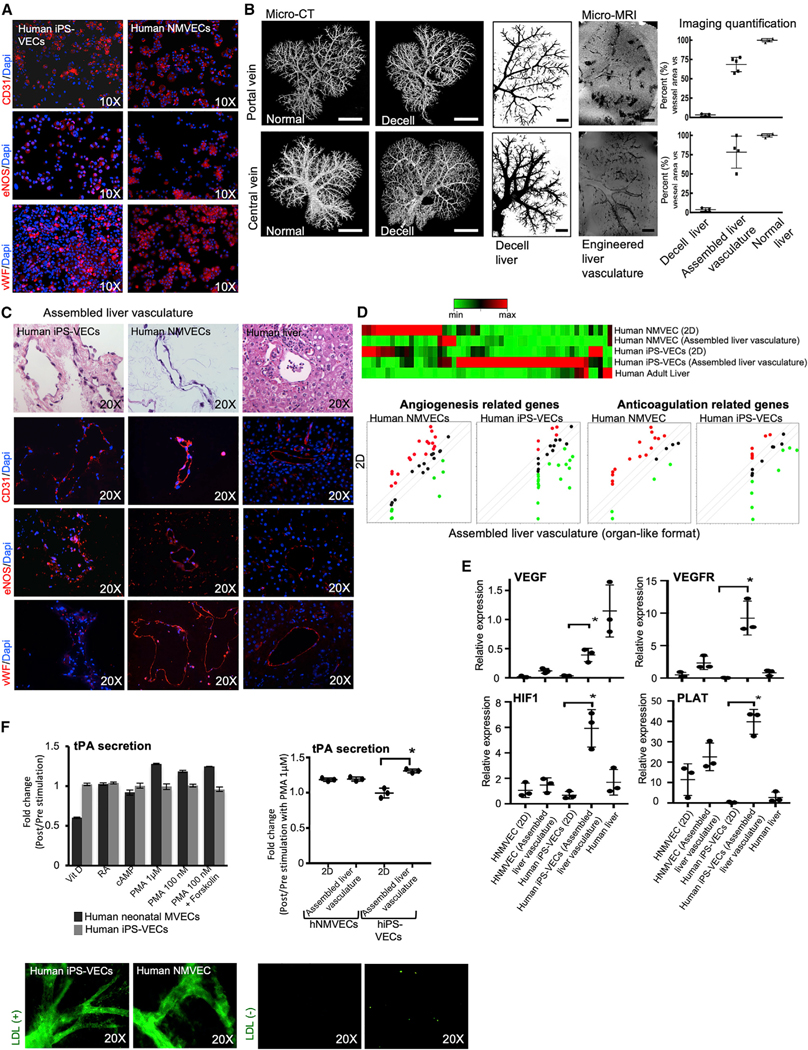
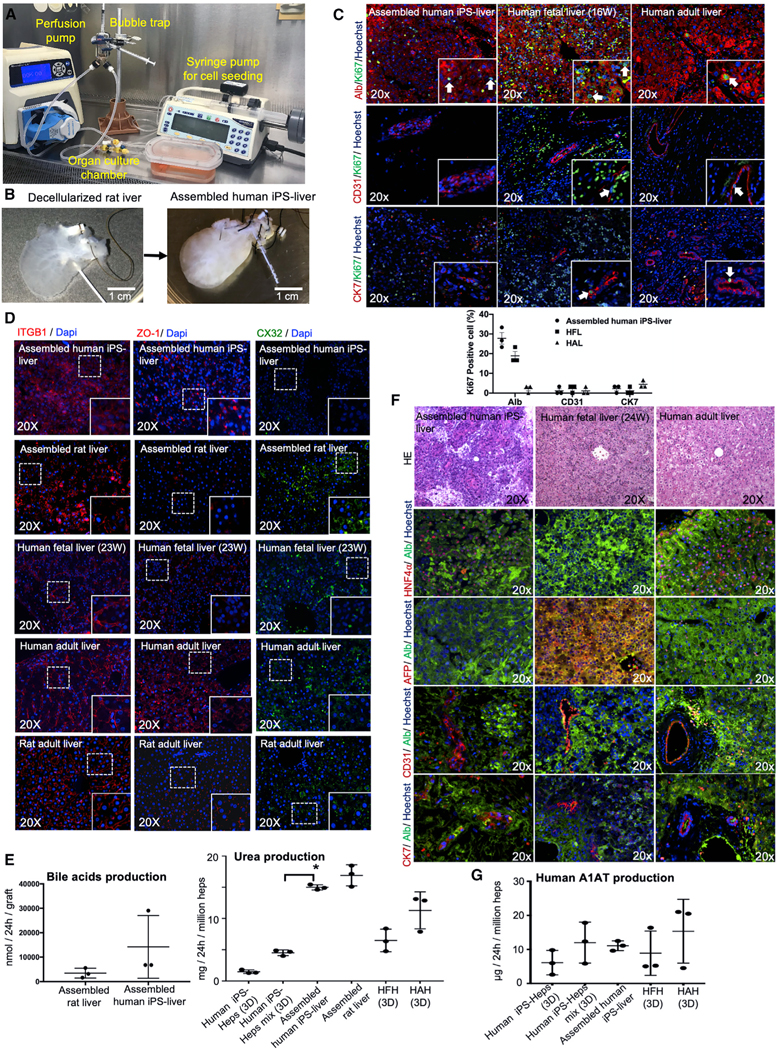
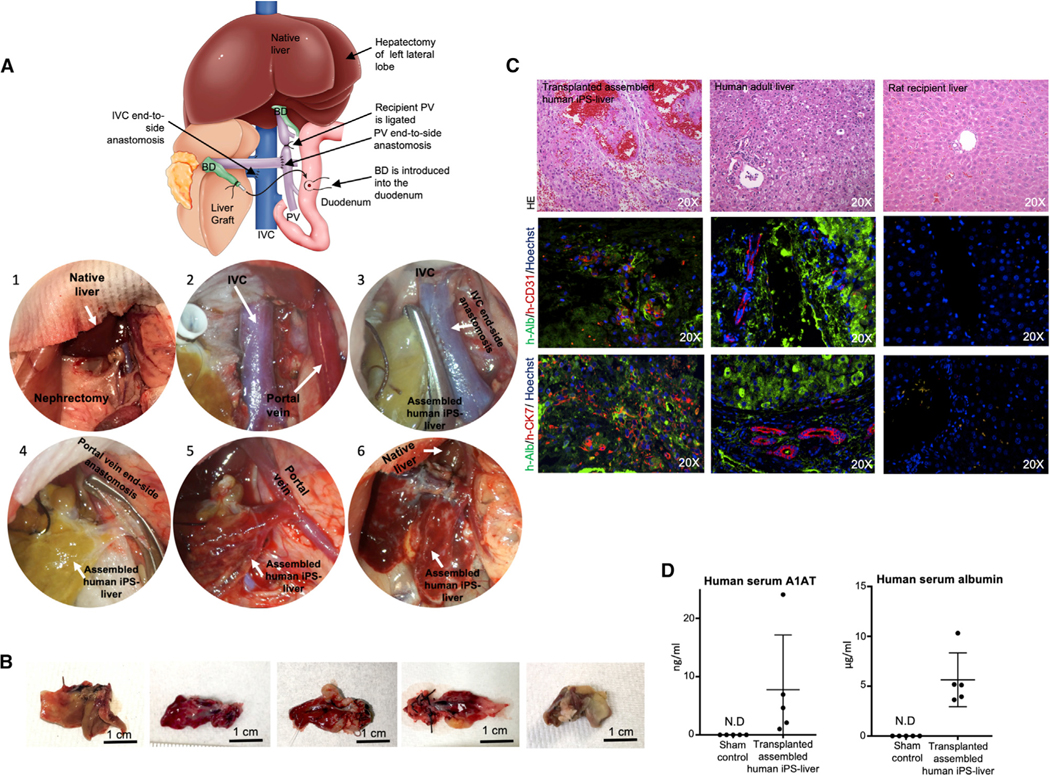
The availability of an autologous transplantable auxiliary liver would dramatically affect the treatment of liver disease. Assembly and function in vivo of a bioengineered human liver derived from induced pluripotent stem cells (iPSCs) has not been previously described. By improving methods for liver decellularization, recellularization, and differentiation of different liver cellular lineages of human iPSCs in an organ-like environment, we generated functional engineered human mini livers and performed transplantation in a rat model. Whereas previous studies recellularized liver scaffolds largely with rodent hepatocytes, we repopulated not only the parenchyma with human iPSC-hepatocytes but also the vascular system with human iPS-endothelial cells, and the bile duct network with human iPSC-biliary epithelial cells. The regenerated human iPSC-derived mini liver containing multiple cell types was tested in vivo and remained functional for 4 days after auxiliary liver transplantation in immunocompromised, engineered (IL2rg-/-) rats.

Keywords: bioengineered human liver; human iPS cells; human iPS-biliary cells; human iPS-endothelial cells; human iPS-hepatocytes; liver maturation; mini human liver; organ-microenvironment; transplantation.


Conflict of interest statement

Declaration of Interests H.Y. and A.S.-Gare inventors on a patent application that involves some of the perfusion technology used in this work (WO/2011/002926); K.H., K.M., J.G.-L., H.Y., and A.S.-G. have an international patent related to this work that describes methods of preparing artificial organs and related compositions for transplantation and regeneration (WO/2015/168254). K.T., A.C.H., J.G.-L., Y.W., T.M., and A.S.-G. have a provisional international patent application that describes hepatic differentiation of human pluripotent stem cells and liver repopulation (PCT/US2018/018032). A.S.-G., J.G.-L., K.T., A.C.H., Y.W., T.M., and I.J.F. are co-founders and have a financial interest in Von Baer Wolff, Inc. a company focused on biofabrication of autologous human hepatocytes from stem cells technology and programming liver failure and their interests are managed by the Conflict of Interest Office at the University of Pittsburgh in accordance with their policies.

Figures

Figure 1.
Figure 1.. Generation of Hepatocytes from Human-Induced Pluripotent Stem Cells (iPSCs)
(A) Schematic representation of the protocol used to differentiate human iPSCs to hepatocytes. BMP, bone morphogenetic protein; FGF, fibroblast growth factor; HGF, hepatocyte growth factor; DMSO, dimethyl sulfoxide; EGF, epidermal growth factor; DEX, dexamethasone; FFA, free fatty acids; RIF, rifampicin; Hydro, hydrocortisone; Chol, cholesterol. (B) Light microscopy images (top) of human iPSC-derived cells at day 4, day 14, and day 18 of hepatic differentiation. Immunofluorescence analyses demonstrating the expression of key definitive endoderm and hepatocyte markers, as indicated, in day 4, day 14, and day 18 using antibodies that recognized SOX17, adult isoform of hepatocyte nuclear factor 4α (HNF4α), alpha-fetoprotein (AFP), and albumin (ALB). Bar graphs showing the levels of positive cell percentage are also shown. iPSCs-Heps, iPSC-derived hepatocytes; iPSC-DE, iPSC-derived definitive endoderm; DAPI, 4′,6-diamidino-2-phenylindole dihydrochloride. (C) Liver-specific gene expression profile. (D) MicroRNA-122 (miRNA122), −148a, and −194 of human iPSC-derived hepatocytes (iPSC-Heps) compared to human adult hepatocytes (HAHs) and human fetal hepatocytes (HFHs; gestational age: weeks 20–22). Data are expressed as the fold change relative to HAHs, which is set as 1. HAHs and HFH were used as controls in all experiments. Results are representative of three independent differentiation experiments. ANOVA with Wilcoxon test compared between iPSC-Heps at days 14 and 28: *p < 0.05. Error bars represent mean ± SD of three independent experiments.
Figure 2.
Figure 2.. Characterization of Human iPSC-Heps
(A) Transmission electron microscopy (TEM) images for cell organelles (upper), bile canaliculi with apical microvilli and tight junctions (middle), and mitochondria (lower). (B–D) Immunofluorescence analyses demonstrating the mitochondria staining using the stain MitoTracker. Graphs showing (C) the number of mitochondria determined by counting the mitochondria described in TEM, (D) the amount of mitochondria DNA (mtDNA) by PCR, and (E) the amount of triglyceride in the cells. (F) Cell-number curve of human iPSC-Heps, HFHs (gestational age; weeks 22–23), and HAHs during in vitro culture determined by the 3-(4,5-dimethylthiazol-2-yl)-2,5-diphenyltetrazolium bromide (MTT) assay. (G) Human iPSC-Heps, as well as HFH and HAHs showed glycogen storage by PAS (periodic acid-Schiff) staining. (H) Urea and human alpha1 antitrypsin (A1AT) production by human iPSC-Heps was analyzed after in the culture medium by enzyme-linked immunosorbent assay (ELISA). Human-adult CYP450 activity is also shown expressed in fold induction. Results are representative of three independent differentiation experiments. ANOVA with Wilcoxon test compared between human iPSC-Heps at day 14 and day 18: *p < 0.05. Error bars represent mean ± SD of three independent experiments. HFH and HAHs were used as the control in all experiments.
Figure 3.
Figure 3.. Generation and Characteristics of Cholangiocytes from Human-iPSCs
(A) Schematic representation of the protocol generated to differentiate human iPSCs into cholangiocytes (iPSC-Chol). BMP, bone morphogenetic protein; FGF, fibroblast growth factor; RA, retinoic acid; DEX, dexamethasone; EGF, epidermal growth factor; IL, interleukin; TGF, transforming growth factor; sDLL-1, Deltalike protein 1, Delta-1. (B) Immunostaining analysis showing the proportion of CK7, CK19, SRY-BOX 9 (SOX9), and AFP in the differentiating population at day 13 and day 23 of culture. HFHs (gestational age; week 23) and human fetal liver tissue (gestational age: week 22) were used as control. Also shown: qRT-PCR analyses of the expression of cholangiocyte-specific genes, SOX9; HNF1β; cystic fibrosis transmembrane conductance regulator (CTFR); inositol 1,4,5-trisphosphate receptor, type 3 (ITPR3); and hepatocyte-specific genes HNF4α, LXR, and UGT1A1 in populations at different stages generated from human iPSCs. Values are determined relative to β-actin and presented as fold change relative to the expression in HFHs, which is set as 1. HEHBD, human extrahepatic bile duct; HAHs, human adult hepatocytes; HNF, hepatocyte nuclear factor; CFTR, cystic fibrosis transmembrane conductance regulator; LXR, liver X receptor; UGT, uridine diphosphate glucuronosyltransferase. ANOVA with Wilcoxon test compared between iPS-Chol at day 13 and day 23 for CFTR: *p < 0.05 and for ITPR3: **p < 0.001. Error bars represent mean ± SD of three independent experiments. (C) Representative images demonstrating active export of the fluorescent bile acid CLF from the lumen of human iPSC-cholangiocyte organoids compared to controls loaded with fluorescein isothiocyanate (FITC). Also shown is fluorescence intensity in the center of organoids. Mean intraluminal fluorescence intensity normalized to background, **p = 0.0001 (two-tailed t test). Results are representative of three independent differentiation experiments. (D) Assembly of whole organ bile duct in decellularized rat livers was achieved by seeding cholangiocytes directly to the main bile duct. To optimize initially cell-seeding protocols, a human cholangiocyte cell line (MMNK-1) was used and imaging evaluations were performed and then iPSC-Chol were used for all studies. 3D micro-CT angiography of normal and decellularized liver bile duct is shown (n = 5). Scale bars, (micro-CT) 1 cm, (micro-MRI) 4 mm. Representative micro-MRI images of micron-sized iron oxide particle-labeled MMNK-1 seeded into the bile duct of decellularized livers at different depth levels. Quantification of the liver bile duct repopulation is also shown compared to control paired micro-CT image (n = 5). (E) Hematoxylin and eosin staining and immunostaining of the recellularized liver with iPSC-Chol, which were seeded through the biliary system of the decellularized liver. Human fetal liver tissue (middle, gestational age; week 22) and Human adult liver tissue were used as control.
Figure 4.
Figure 4.. Characterization of Human iPSC-Derived Vascular Endothelial Cells (iPSC-VECs)
(A) Characterization of human iPSC-VECs showing homogeneous expression of endothelial markers, CD31, eNOS, and von Willebrand factor (vWF). Human neonatal microvascular endothelial cells (hNMVECs) were used as control. (B) Endothelial-cell seeding experiments into decellularized rat livers were performed through inferior vena cava (IVC) and portal vein (PV) with a 6-h static culture interval. To optimize initially cell-seeding protocols, a human liver endothelial cell line (TMNK-1) was used and imaging evaluations were performed and then human iPSC-VECs or hNMVECs were used for all studies. Shown is 3D micro-CT angiography of normal and decellularized rat liver vascular compartments (portal and central veins; left). Next, representative micro-MRI images of iron oxide microparticle–labeled TMNK-1 seeded into the portal and central vein of decellularized livers. Quantification of the liver vasculature repopulation is also shown compared to control-paired micro-CT images (n = 5). Scale bars: (micro-CT) 1 cm, (micro-MRI) 4 mm. (C) Hematoxylin and eosin staining and immunostaining of the recellularized liver tissue with human iPSC-VECs (left) and hNMVECs (middle), which were seeded through vena cava and PV of the decellularized liver. Human adult liver tissue (right) was used as control. (D) Euclidean hierarchical clustering analysis focusing on the key genes related to angiogenesis and anticoagulation of human iPSC-VECs and hNMVECs (genes differentially expressed in 2D culture versus assembled liver vasculature after recellularization with human iPSC-VECs or human neonatal MVEC, and compared to human adult liver tissue). Green dots represent the genes expressed in the assembled liver vasculature at a higher level when compared to 2D culture, whereas red dots represent genes expressed at a higher level in 2D culture format when compared to assembled liver vasculature. (E) qRT-PCR-based analyses of the mRNA expression of VEGF, VEGFR, HIF1, and PLAT in cell populations cultured in 2D format and assembled liver vasculature after recellularization with human iPSC-VECs or hNMVECs. Values shown are relative to b-actin and presented as fold change relative to expression in adult liver tissue (human liver), which is set as 1. ANOVA with Wilcoxon test compared between 2D culture and assembled liver vasculature: *p < 0.05 (n = 3). Bars in all graphs represent the mean ± SD of three independent experiments. (F) Left panel: Fold change of tissue plasminogen activator (tPA) secretion in 2D culture between post- and prestimulation by indicated factors and concentration. Vit D, vitamin D; RA, retinoic acid; PMA, phorbol 12-myristate 13- acetate. Right panel: fold change of tPA secretion in 2D culture and assembled liver vasculature with hNMVECs and iPSC-VECs pre- and post-stimulation with PMA 1 μM. ANOVA with Wilcoxon test compared between 2D culture and assembled liver vasculature: *p < 0.05 (n = 3). Bars in all graphs represent the mean ± SD of three independent experiments. Acetyl LDL Uptake assay at 24 h in assembled liver tissue after recellularization with human iPSC-VECs and hNMVECs with LDL (left) and without LDL (right).
Figure 5.
Figure 5.. Hepatic Function and Characterization of Engineered Human iPSC-Derived Liver Graft
(A) Photograph illustrating the organ perfusion and culture chamber used to recellularized rat livers with human iPSC-Heps, iPSC-VECs, human fibroblasts, mesenchymal stem cells, and iPSC-Chol. (B) Decellularized whole liver matrix (left) and liver after recellularization (right). (C) Double-immunofluorescence staining for Ki67 and ALB, CD31, and cytokeratin 7 (CK7) of regenerated liver grafts four days after recellularization. Human fetal liver (gestational age; week 16) and adult liver tissues were used as the controls. Bar graphs showing the levels of Ki67 positive cell percentage are also indicated for each cell type. (D) Immunofluorescence staining for the key markers of cell adhesions and tight junctions, integrin beta-1 (ITGB1), ZO-1, and Conexin32 (CX32), of the regenerated human liver grafts. Bioengineered livers with primary rat liver cells, human fetal liver, human adult liver and rat adult liver were used as controls. (E) Left: the comparison of bile-acid production between assembled liver grafts derived from rat hepatocytes and assembled liver grafts derived from human iPSCs. Right: regenerated liver tissue assembled with human iPSC-human derived cells (assembled human iPSC-liver) in comparison to that from iPSC-Heps cultured alone in static sandwich (iPSC-Heps [3D]) and human iPSC-Heps cultured with iPSC-VECs, iPS-derived cholangiocytes, mesenchymal stem cells, and fibroblasts (iPSC-Heps mix [3D]). HFHs and HAHs cultured in static sandwich were used as the control in all experiments. To compare between 2D culture and assembled liver, ANOVA with Wilcoxon test was used: *p < 0.05 (n = 3). Bars in all graphs represent the mean ± SD of three independent experiments. Error bars represent mean ± SD of three experimental experiments. (F) Characterization of human liver graft entirely regenerated from iPSC-derived cells four days after recellularization, showing homogeneous expression of HNF4α and ALB, but no expression of AFP and ALB was detected. Also, double-immunofluorescence staining for CD31 and CK7 are shown. H&E, hematoxylin and eosin. Hoechst (blue stain) was used as counterstaining. (G) A1AT production from regenerated liver tissue assembled with human iPSC-human derived cells (assembled human iPSC-liver) in comparison to that from iPSC-Heps cultured alone in static sandwich (iPSC-Heps [3D]) and human iPSC-Heps cultured with iPSC-VECs, iPSC-derived cholangiocytes, mesenchymal stem cells, and fibroblasts (iPSC-Heps mix [3D]). HFHs and HAHs cultured in static sandwich were used as the control in all experiments. Error bars represent mean ± SD of three experimental experiments.
Figure 6.
Figure 6.. Auxiliary Liver Transplantation of the Engineered Human Liver Graft Derived from iPSCs
(A) Schematic representation of the auxiliary liver graft transplantation surgical technique for transplantation of human engineered liver grafts. Representative images of graft transplantation: (1) after right nephrectomy, (2) PV) and IVC were exposed. (3) IVC anastomosis (end to side). (4) PV anastomosis (end to side). (5) After reperfusion. (6) Before closing abdomen. (B) Microscopic finding of the iPSC-liver graft three to four days after transplantation. (C) Double-immunofluorescent staining of recellularized auxiliary graft after transplantation (left), compared to human adult liver tissue (middle), and rat recipient liver (right). H&E, hematoxylin and eosin; h-ALB, human-specific albumin; h-CD31, human-specific CD31; h-CK7, human-specific cytokeratin 7. Sections were counterstained with Hoechst (blue stain). (D) The serum concentration of human specific A1AT and human-specific ALB was identified at four days after transplantation of assembled human iPSC-liver by ELISA (n = 5). Bars represent the mean ± SD of five independent experiments.

Comment in

References

    1. Ammori JB, Pelletier SJ, Lynch R, Cohn J, Ads Y, Campbell DA, and Englesbe MJ (2008). Incremental costs of post-liver transplantation complications. J. Am. Coll. Surg 206, 89–95. - PubMed
    1. Ashburner M, Ball CA, Blake JA, Botstein D, Butler H, Cherry JM, Davis AP, Dolinski K, Dwight SS, Eppig JT, et al.; The Gene Ontology Consortium (2000). Gene ontology: tool for the unification of biology. Nat. Genet. 25, 25–29. - PMC - PubMed
    1. Avior Y, Levy G, Zimerman M, Kitsberg D, Schwartz R, Sadeh R, Moussaieff A, Cohen M, Itskovitz-Eldor J, and Nahmias Y. (2015). Microbial-derived lithocholic acid and vitamin K2 drive the metabolic maturation of pluripotent stem cells-derived and fetal hepatocytes. Hepatology 62, 265–278. - PubMed
    1. Ballard O, and Morrow AL (2013). Human milk composition: nutrients and bioactive factors. Pediatr. Clin. North Am 60, 49–74. - PMC - PubMed
    1. Bandiera S, Pfeffer S, Baumert TF, and Zeisel MB (2015). miR-122–a key factor and therapeutic target in liver disease. J. Hepatol 62, 448–457. - PubMed

Publication types

MeSH terms