. 2020 Jun 2;31(9):107715.
doi: 10.1016/j.celrep.2020.107715.

Critical Roles of Translation Initiation and RNA Uridylation in Endogenous Retroviral Expression and Neural Differentiation in Pluripotent Stem Cells

Affiliations

Critical Roles of Translation Initiation and RNA Uridylation in Endogenous Retroviral Expression and Neural Differentiation in Pluripotent Stem Cells

Kazutoshi Takahashi et al. Cell Rep. .

Abstract

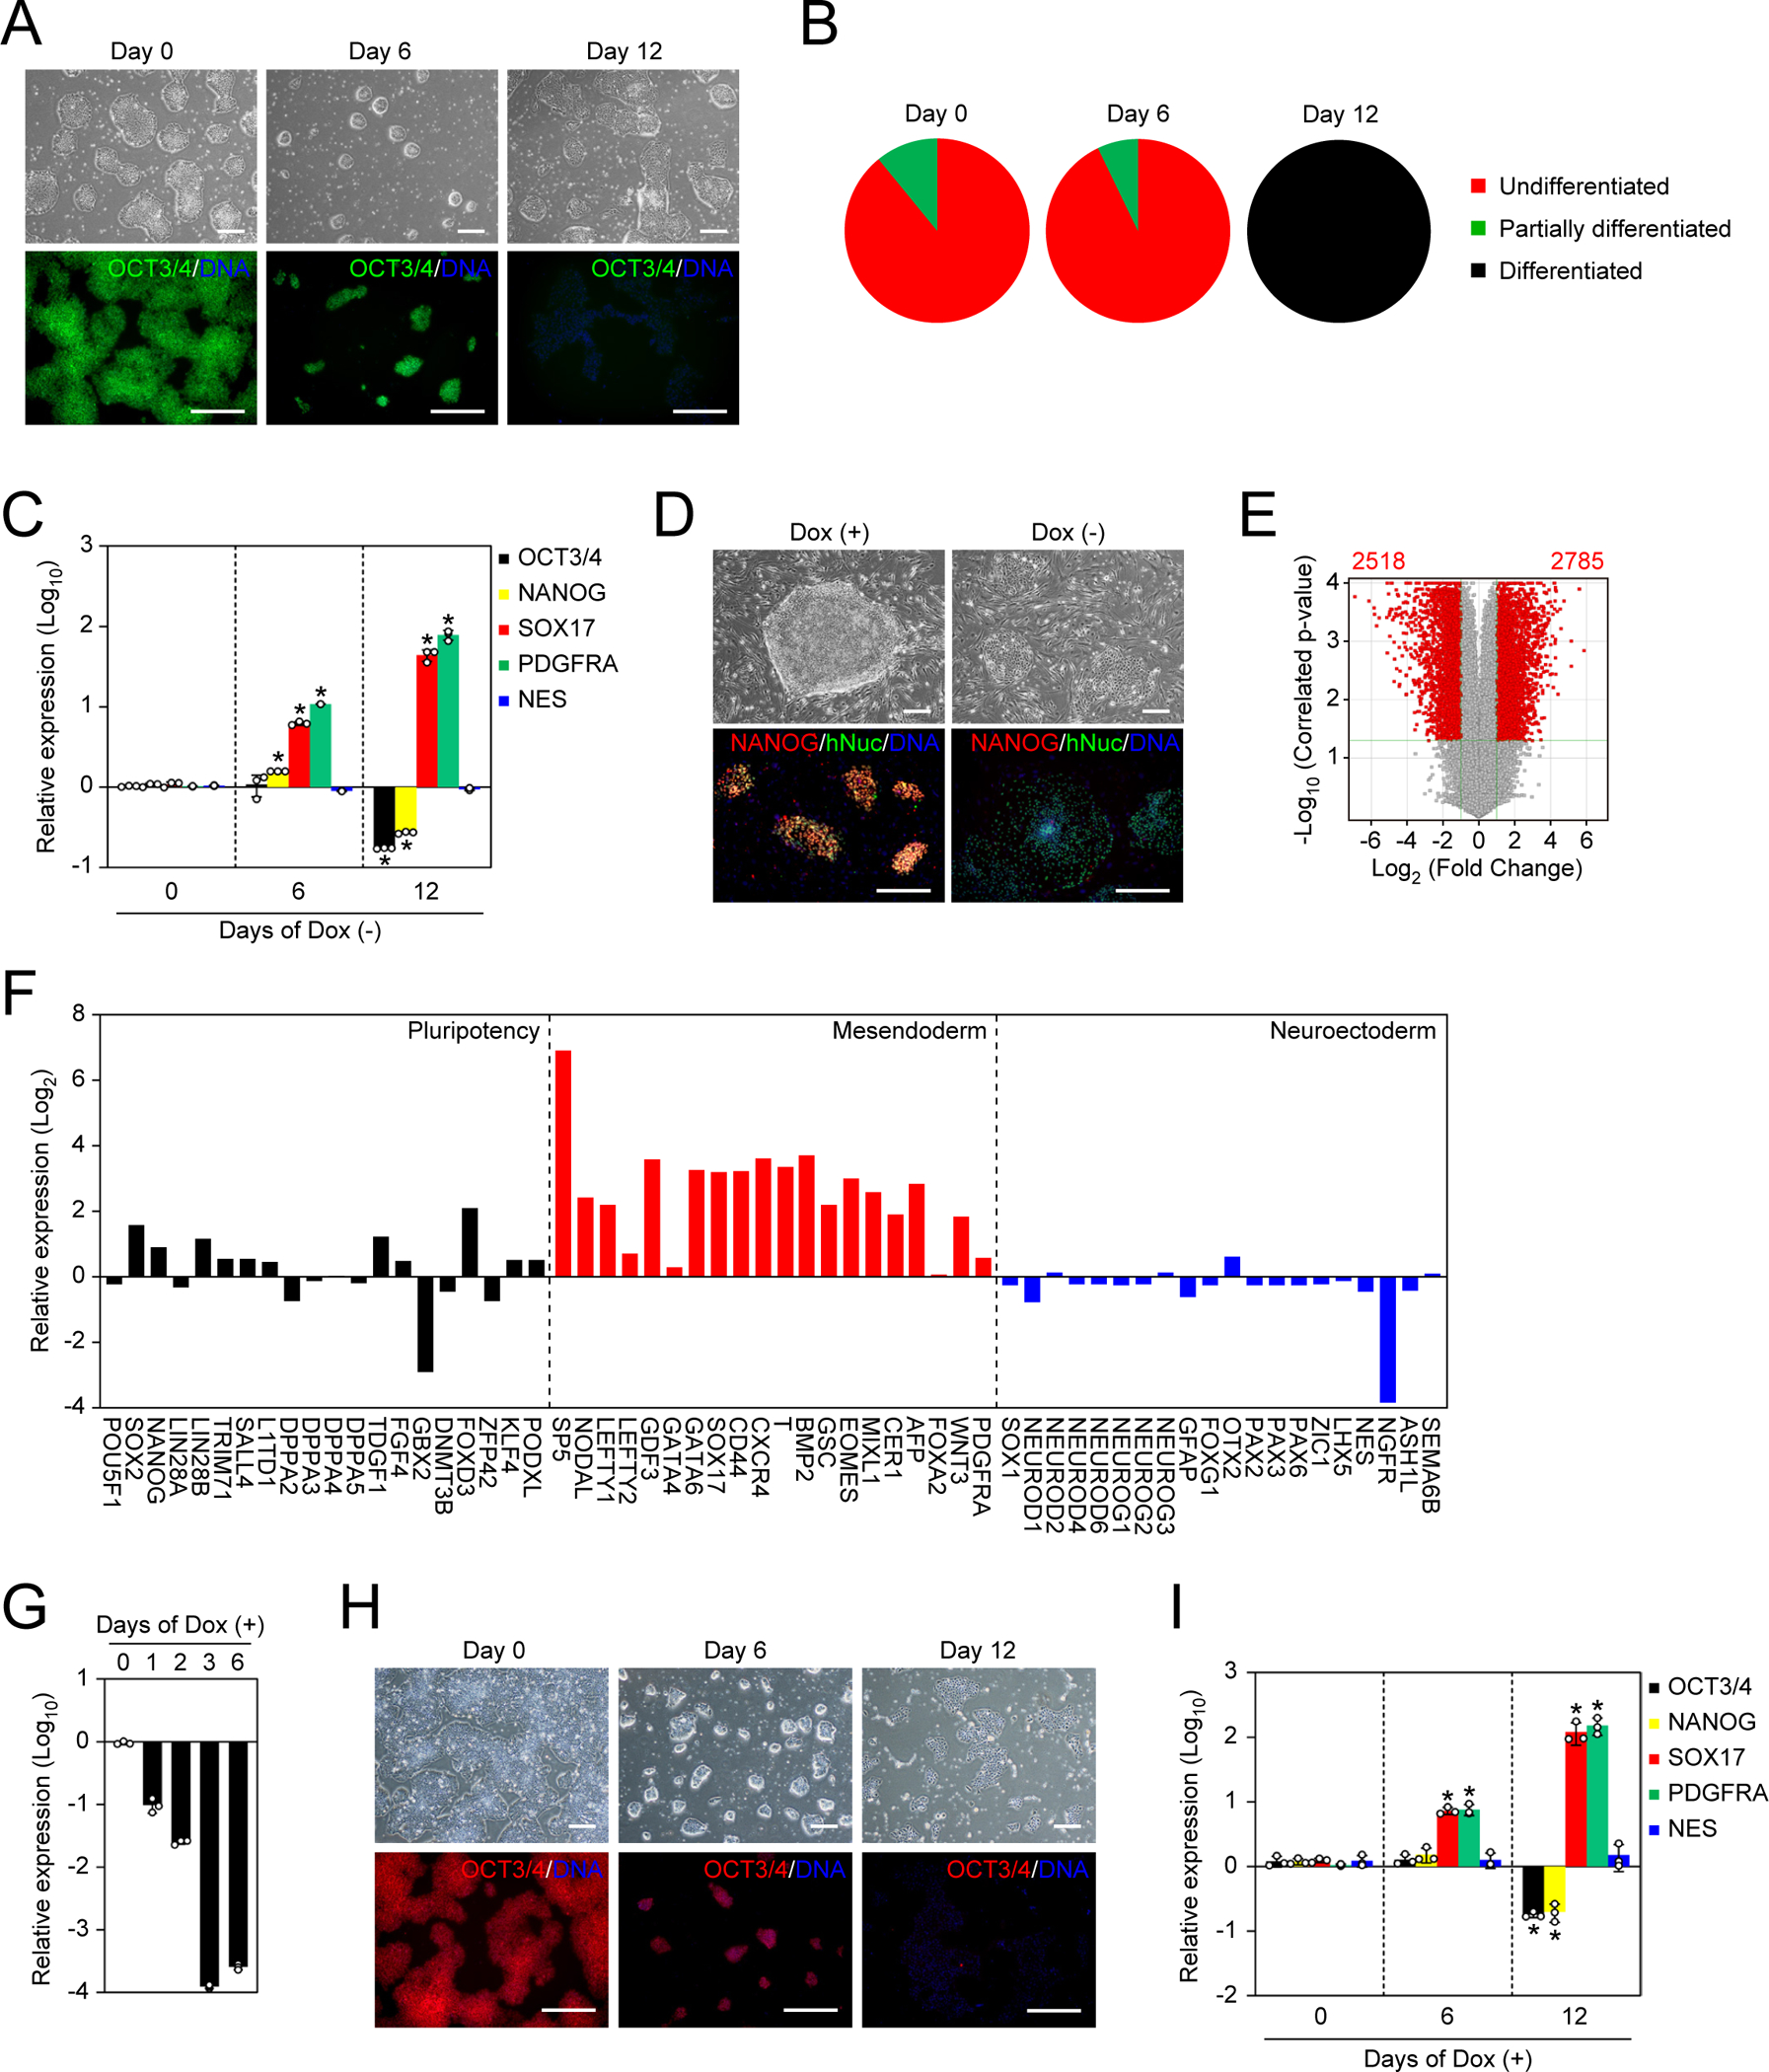
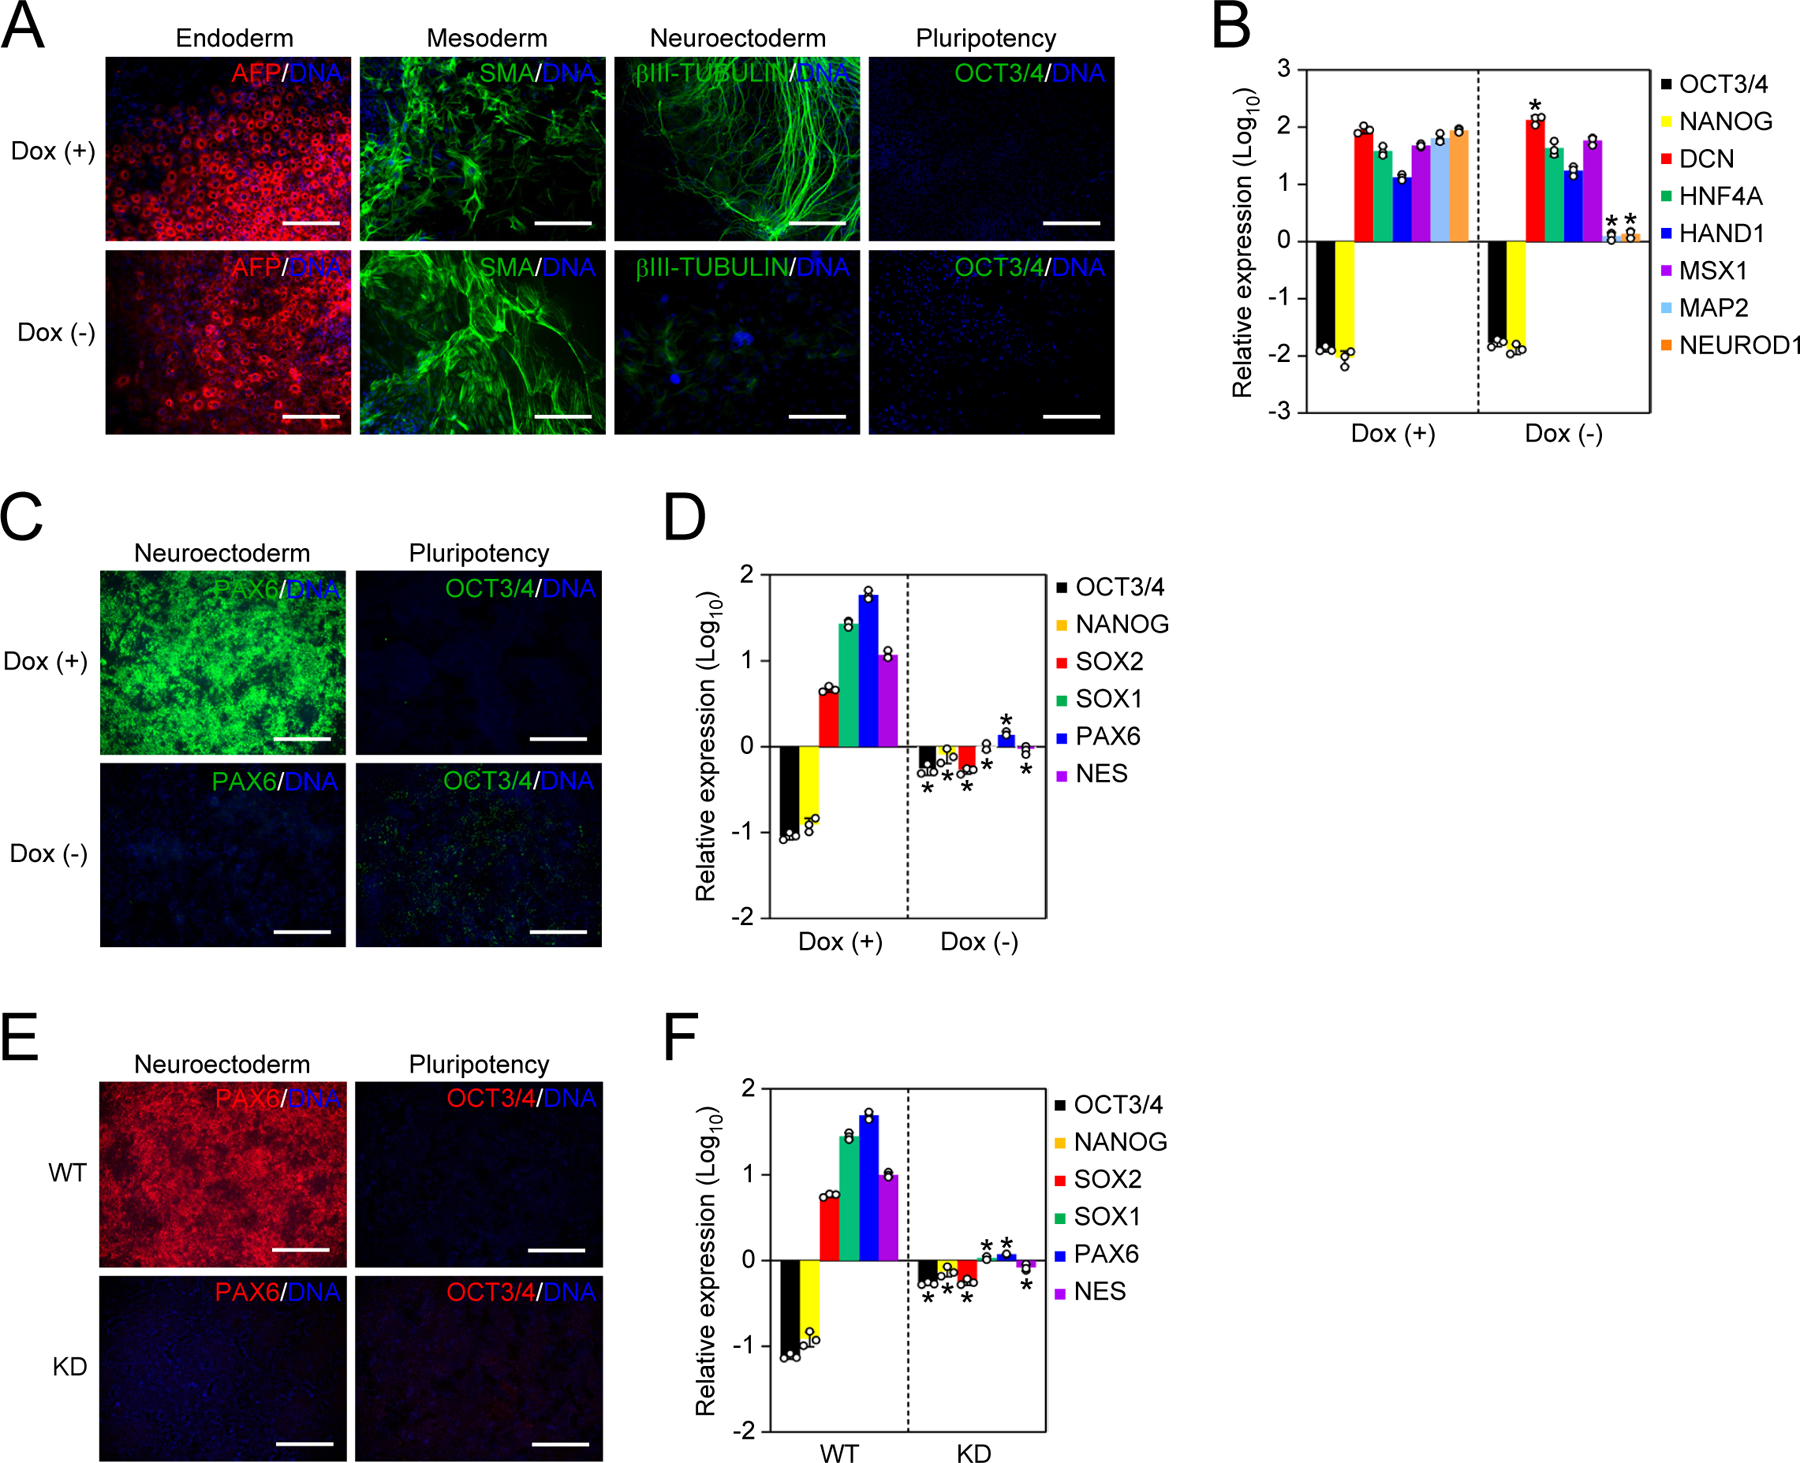
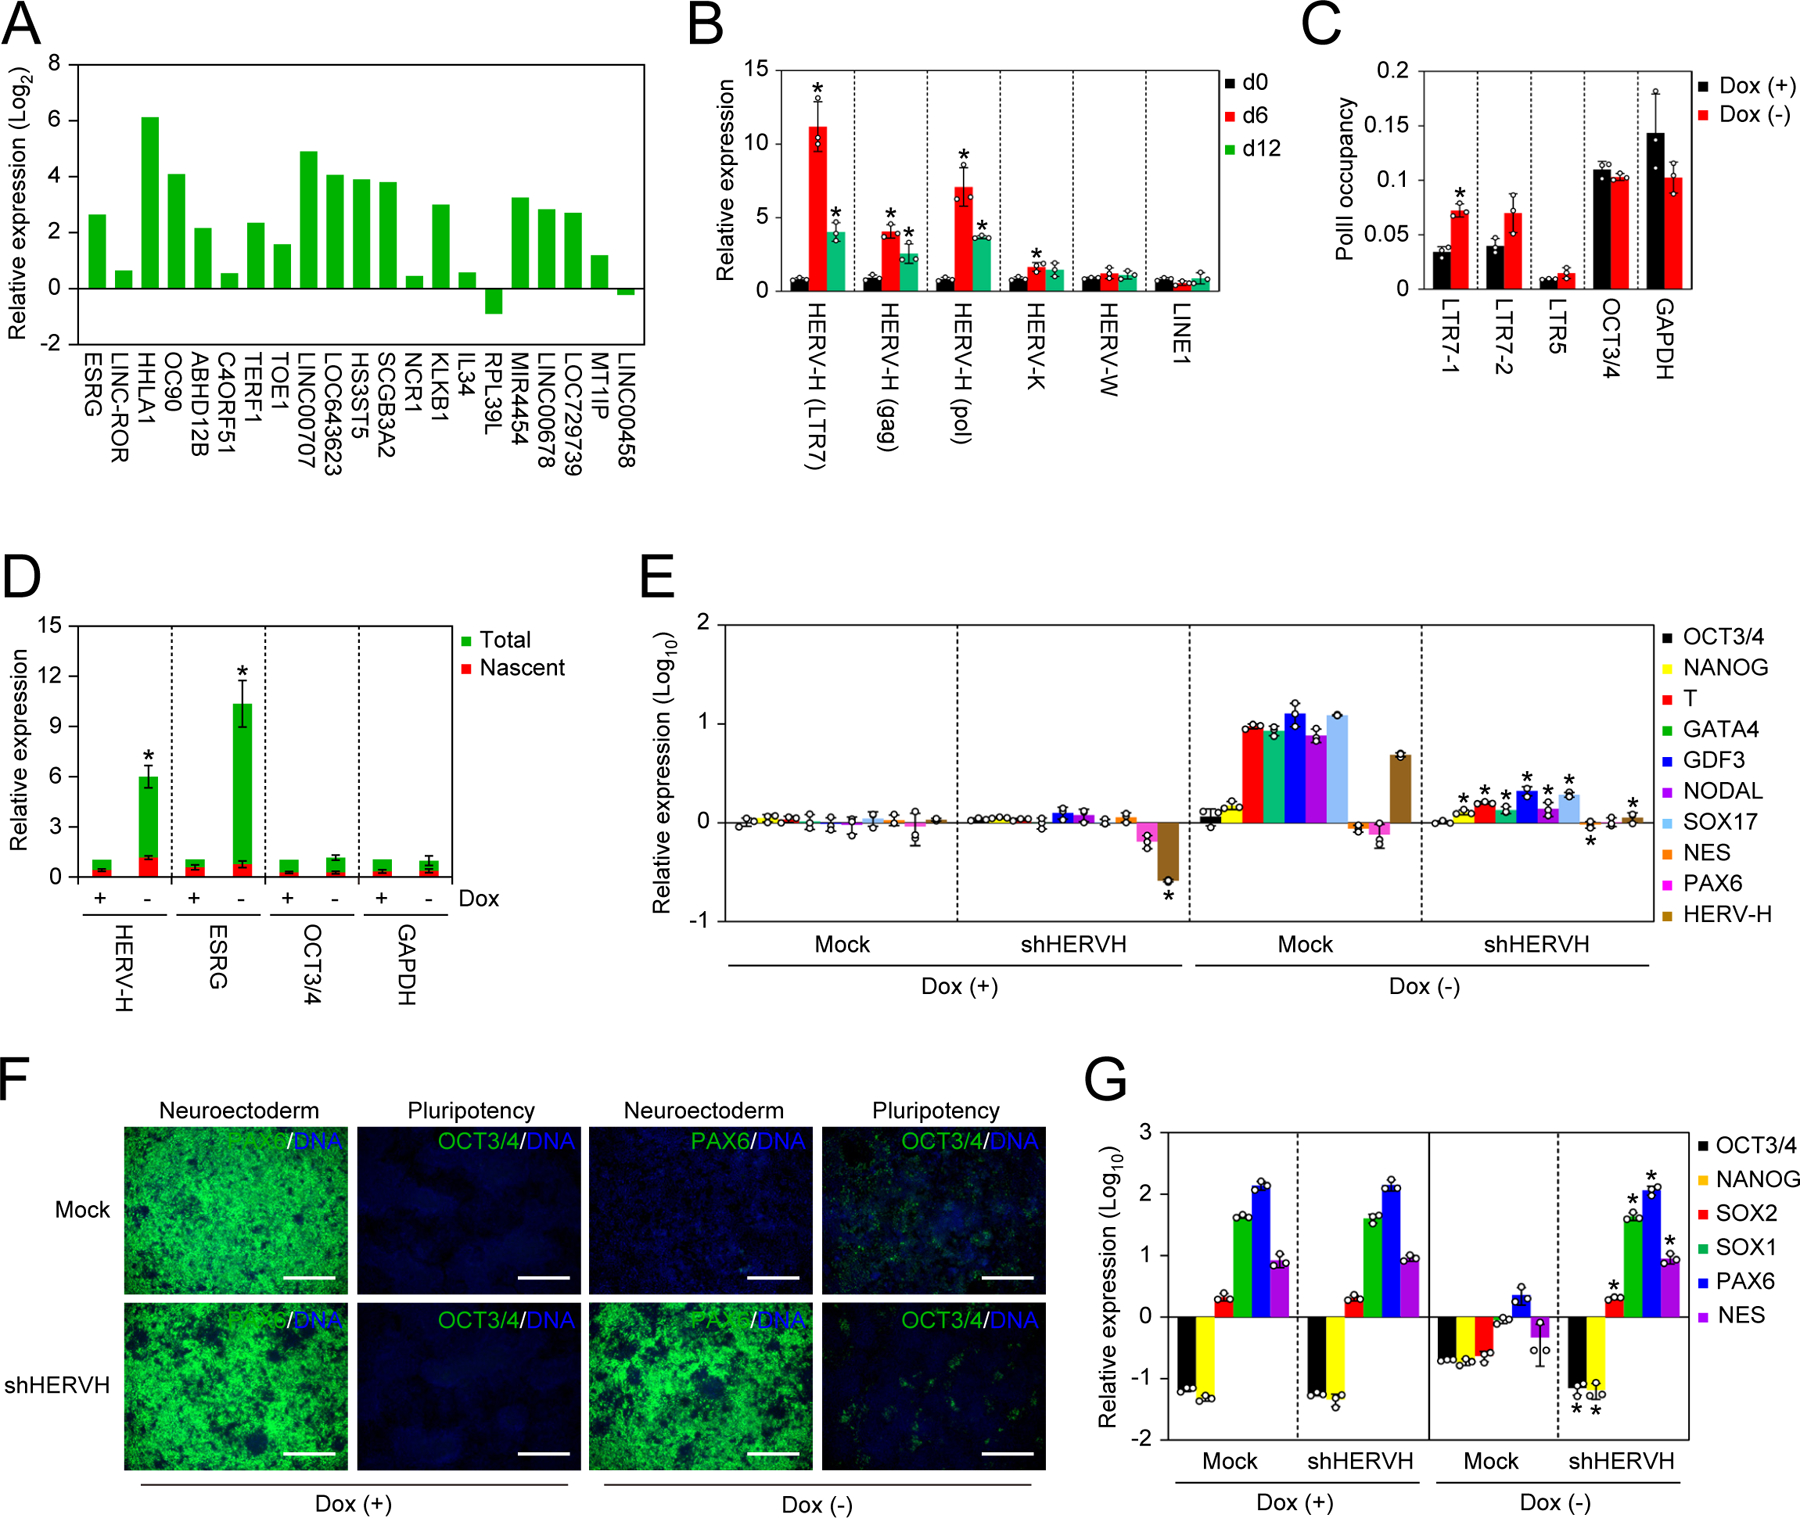
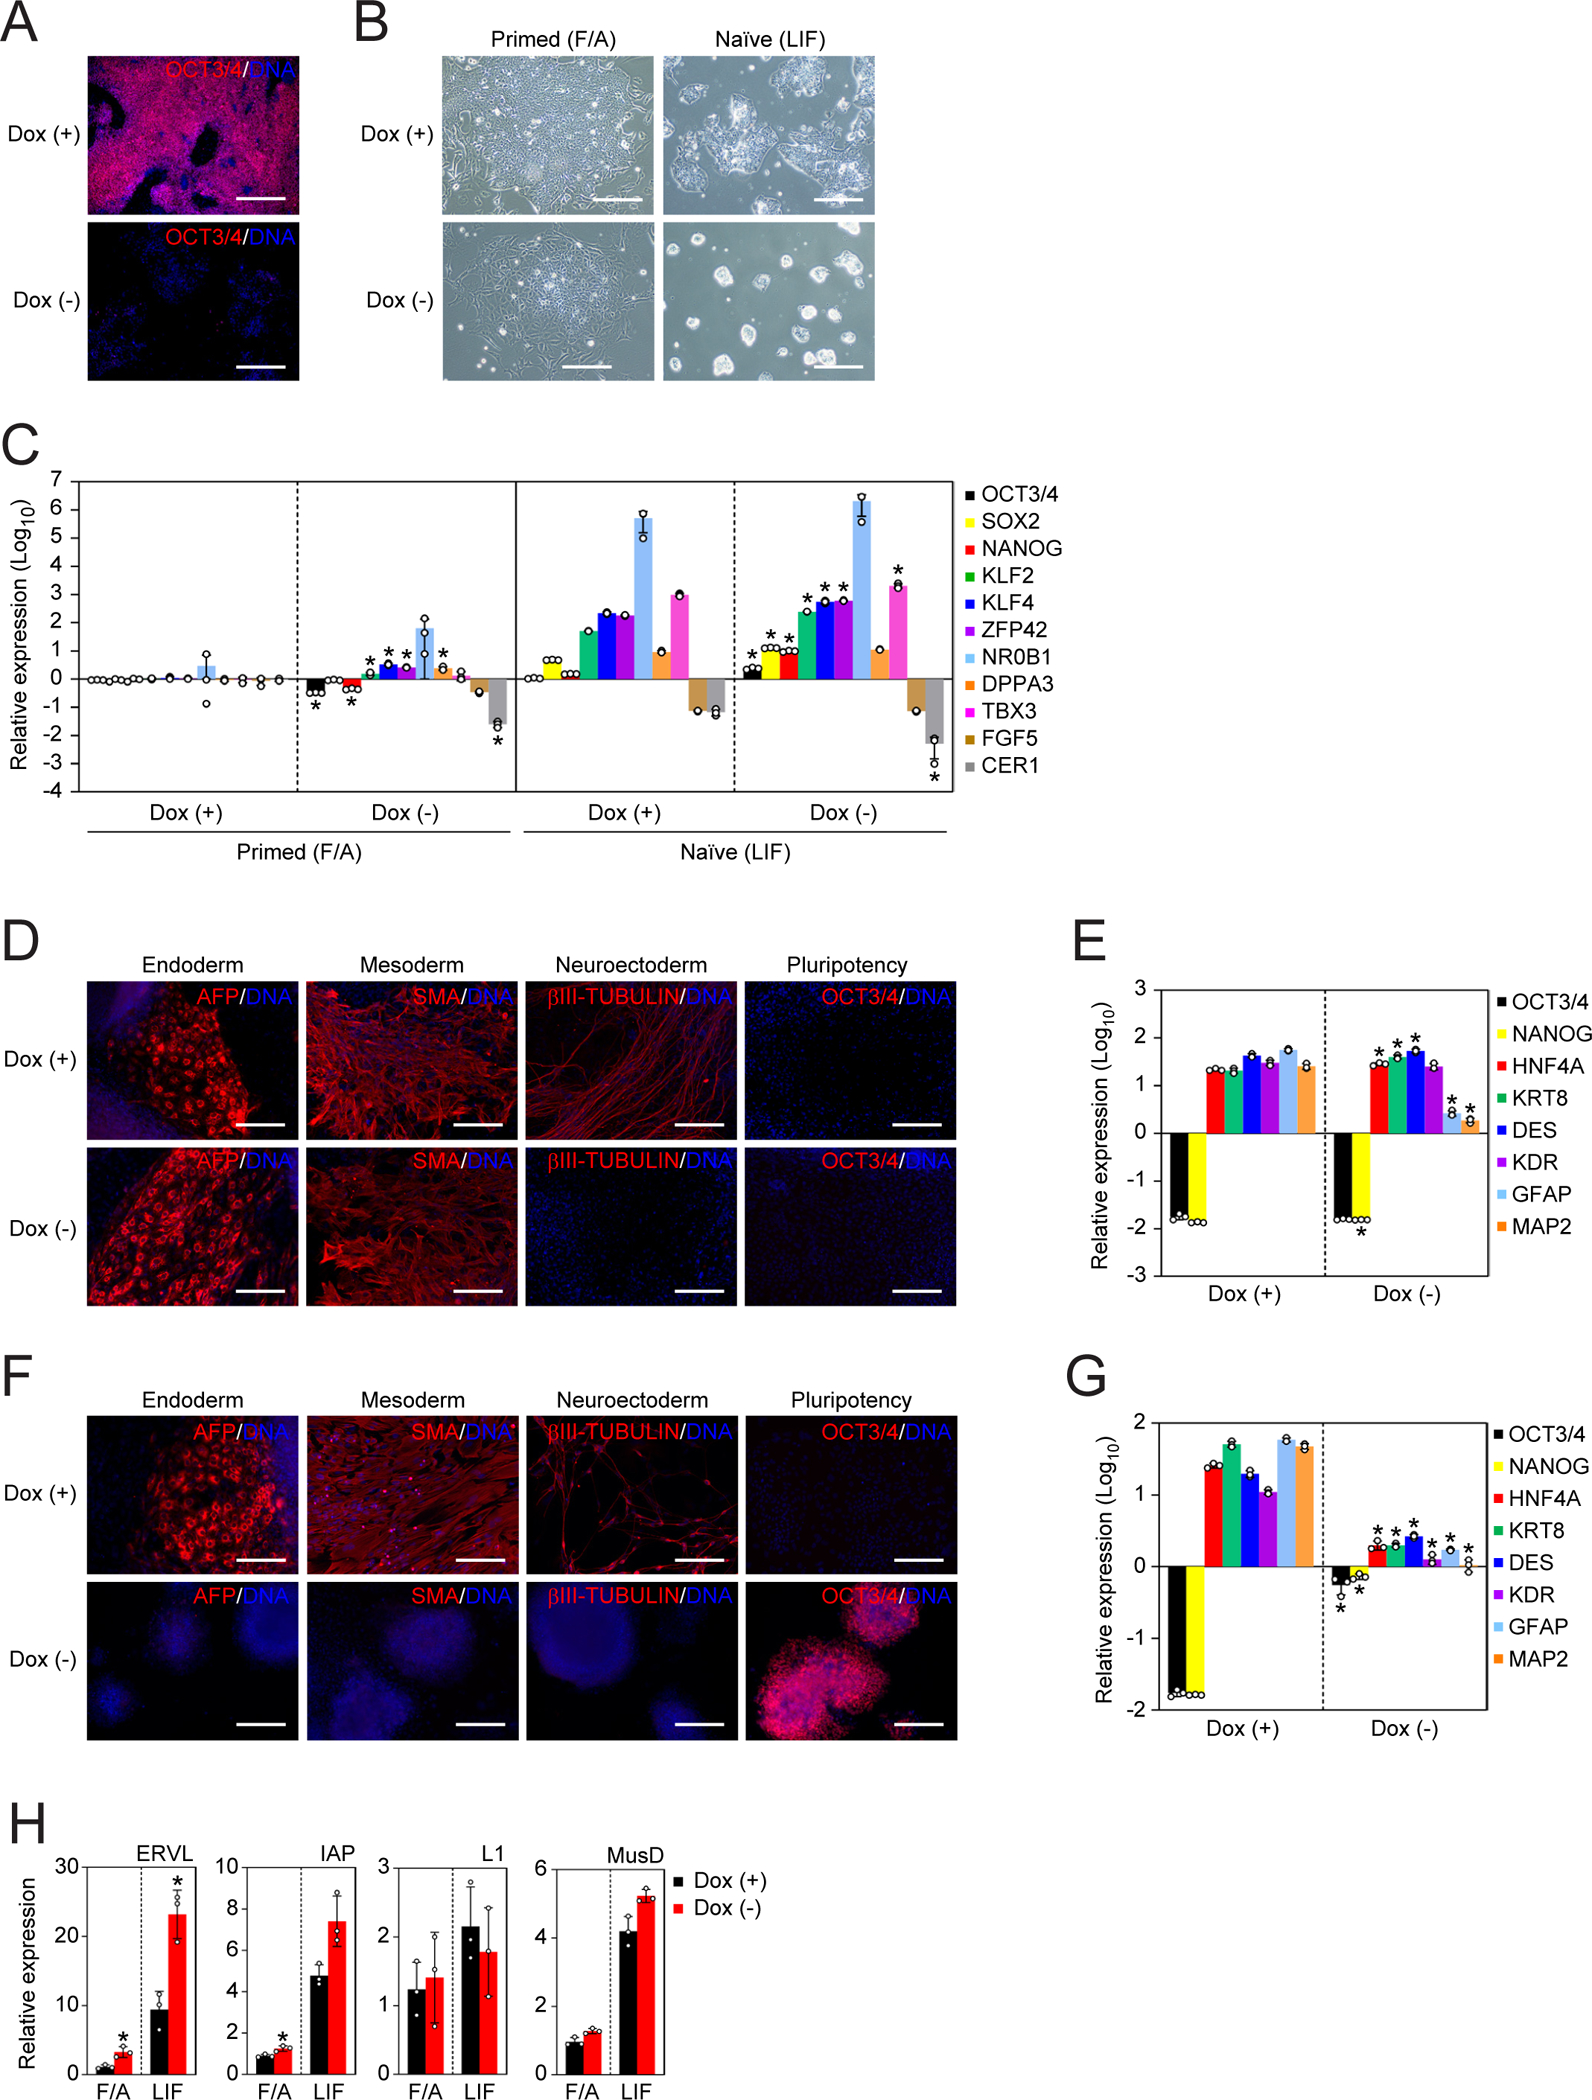
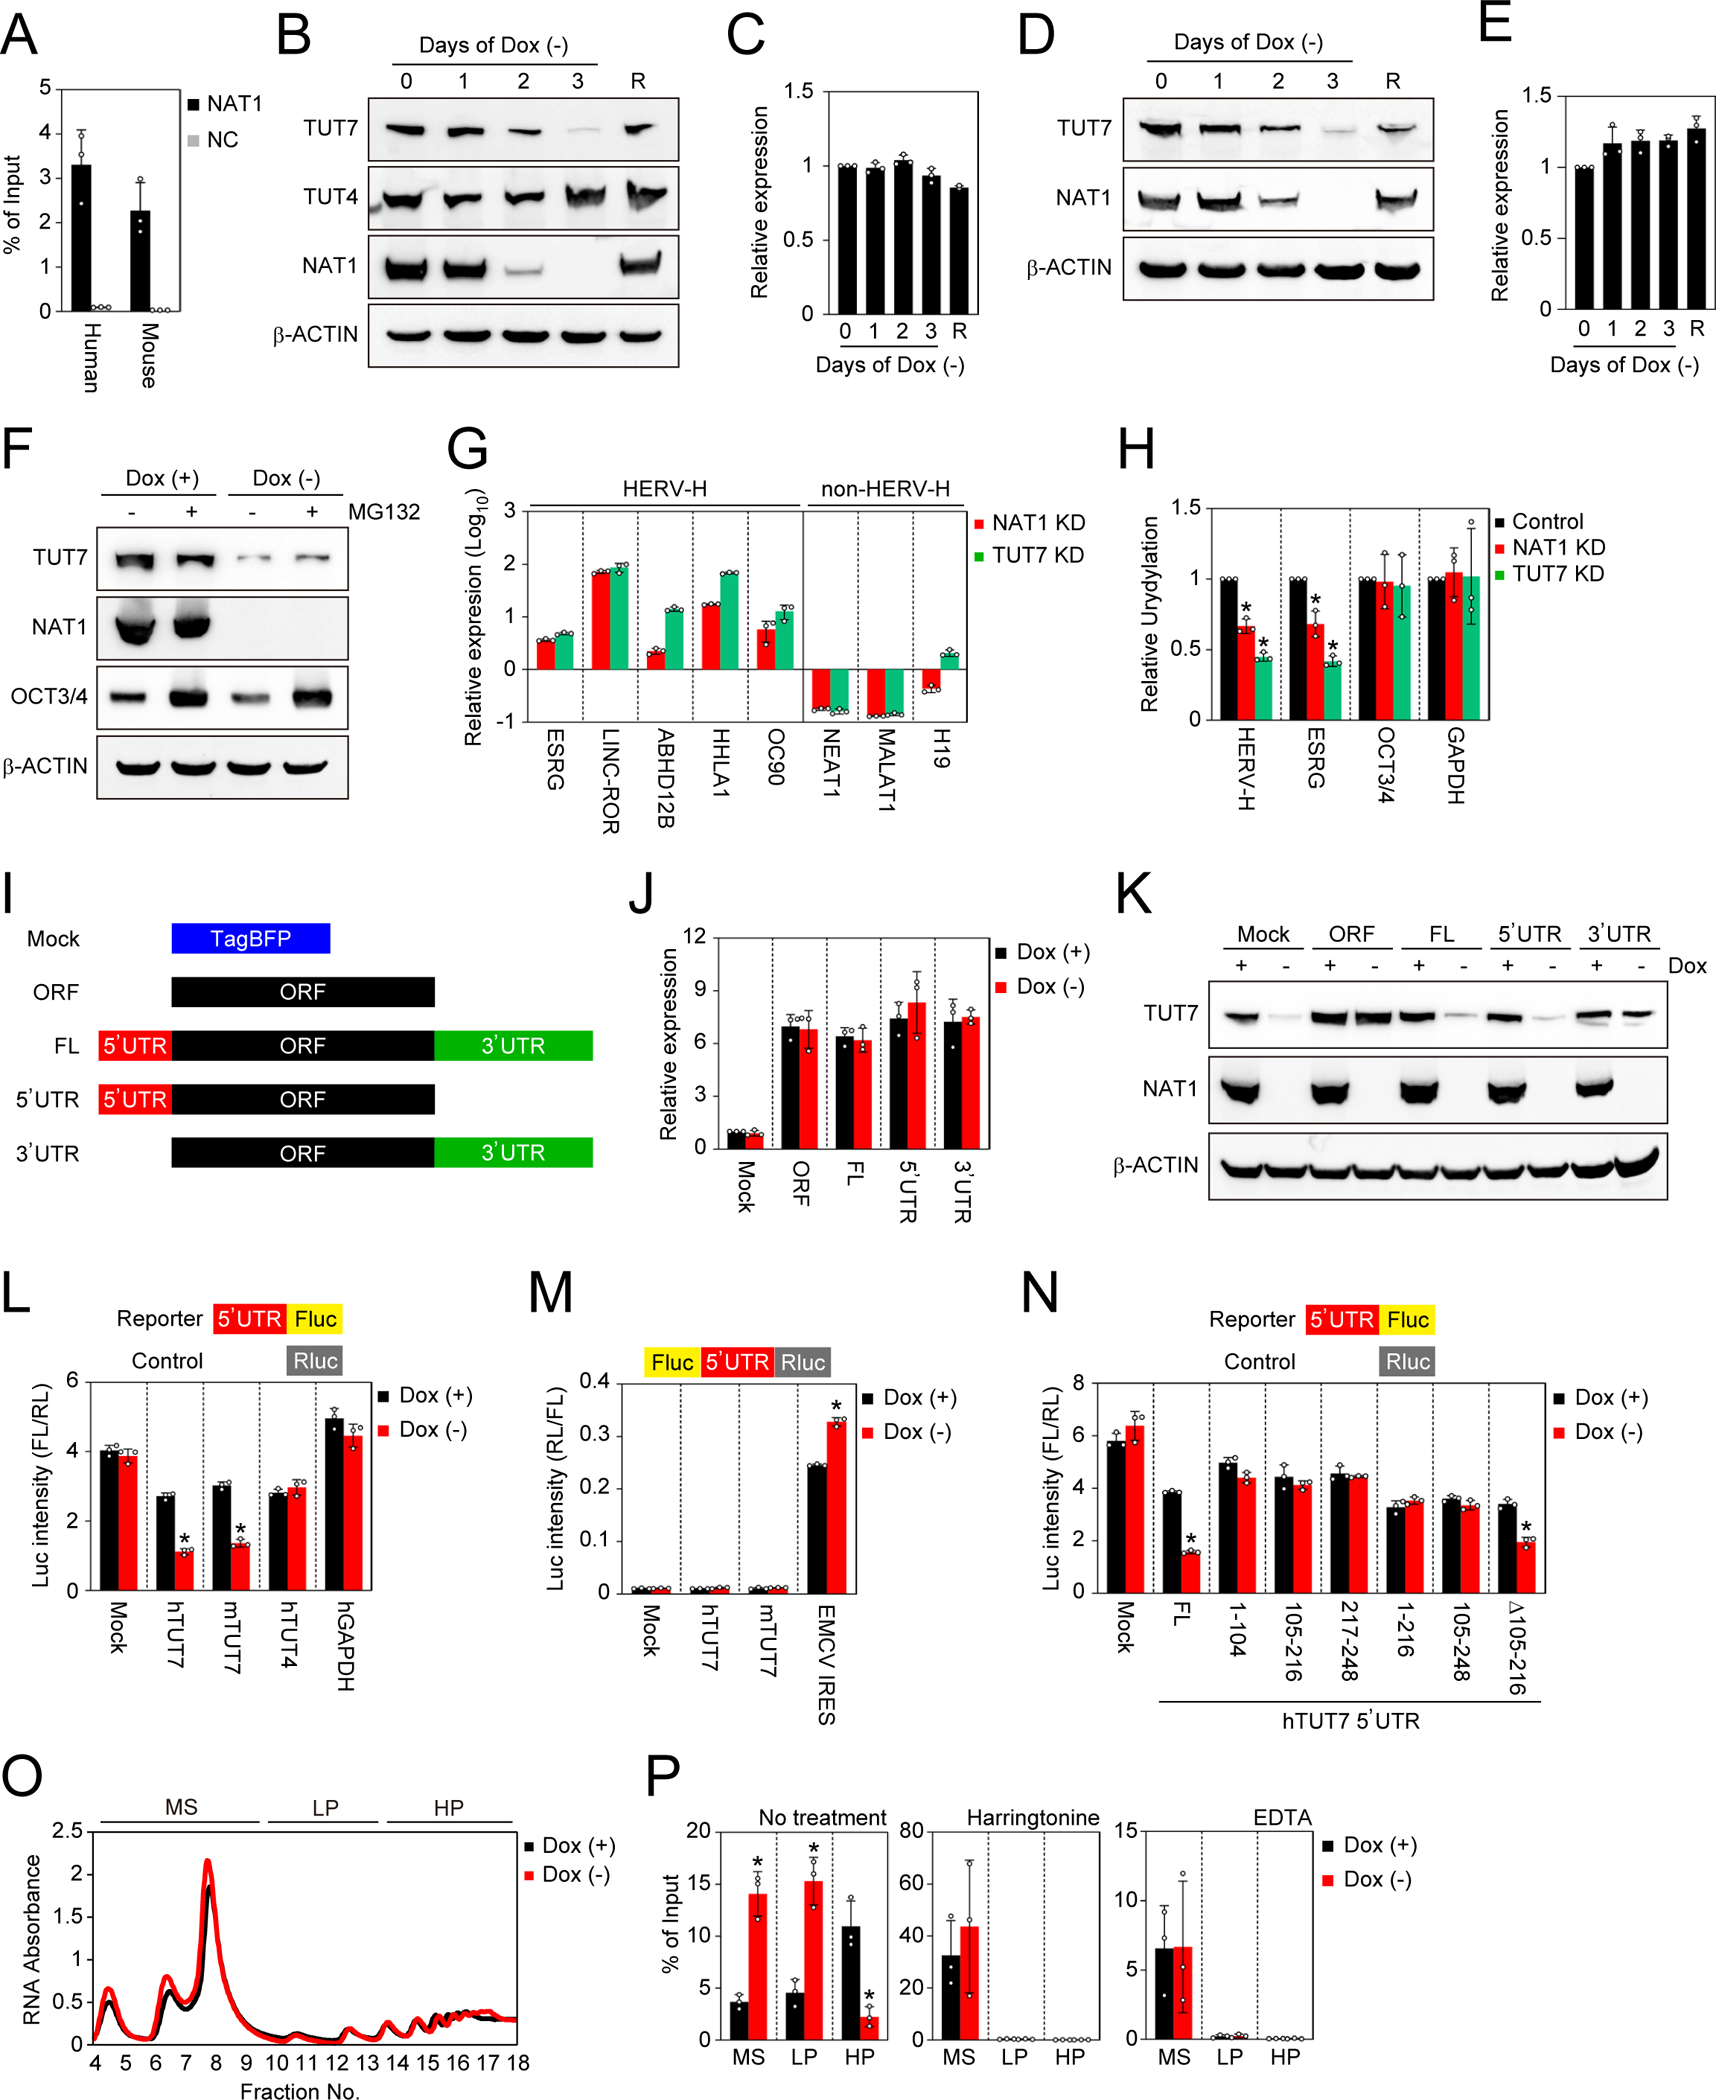
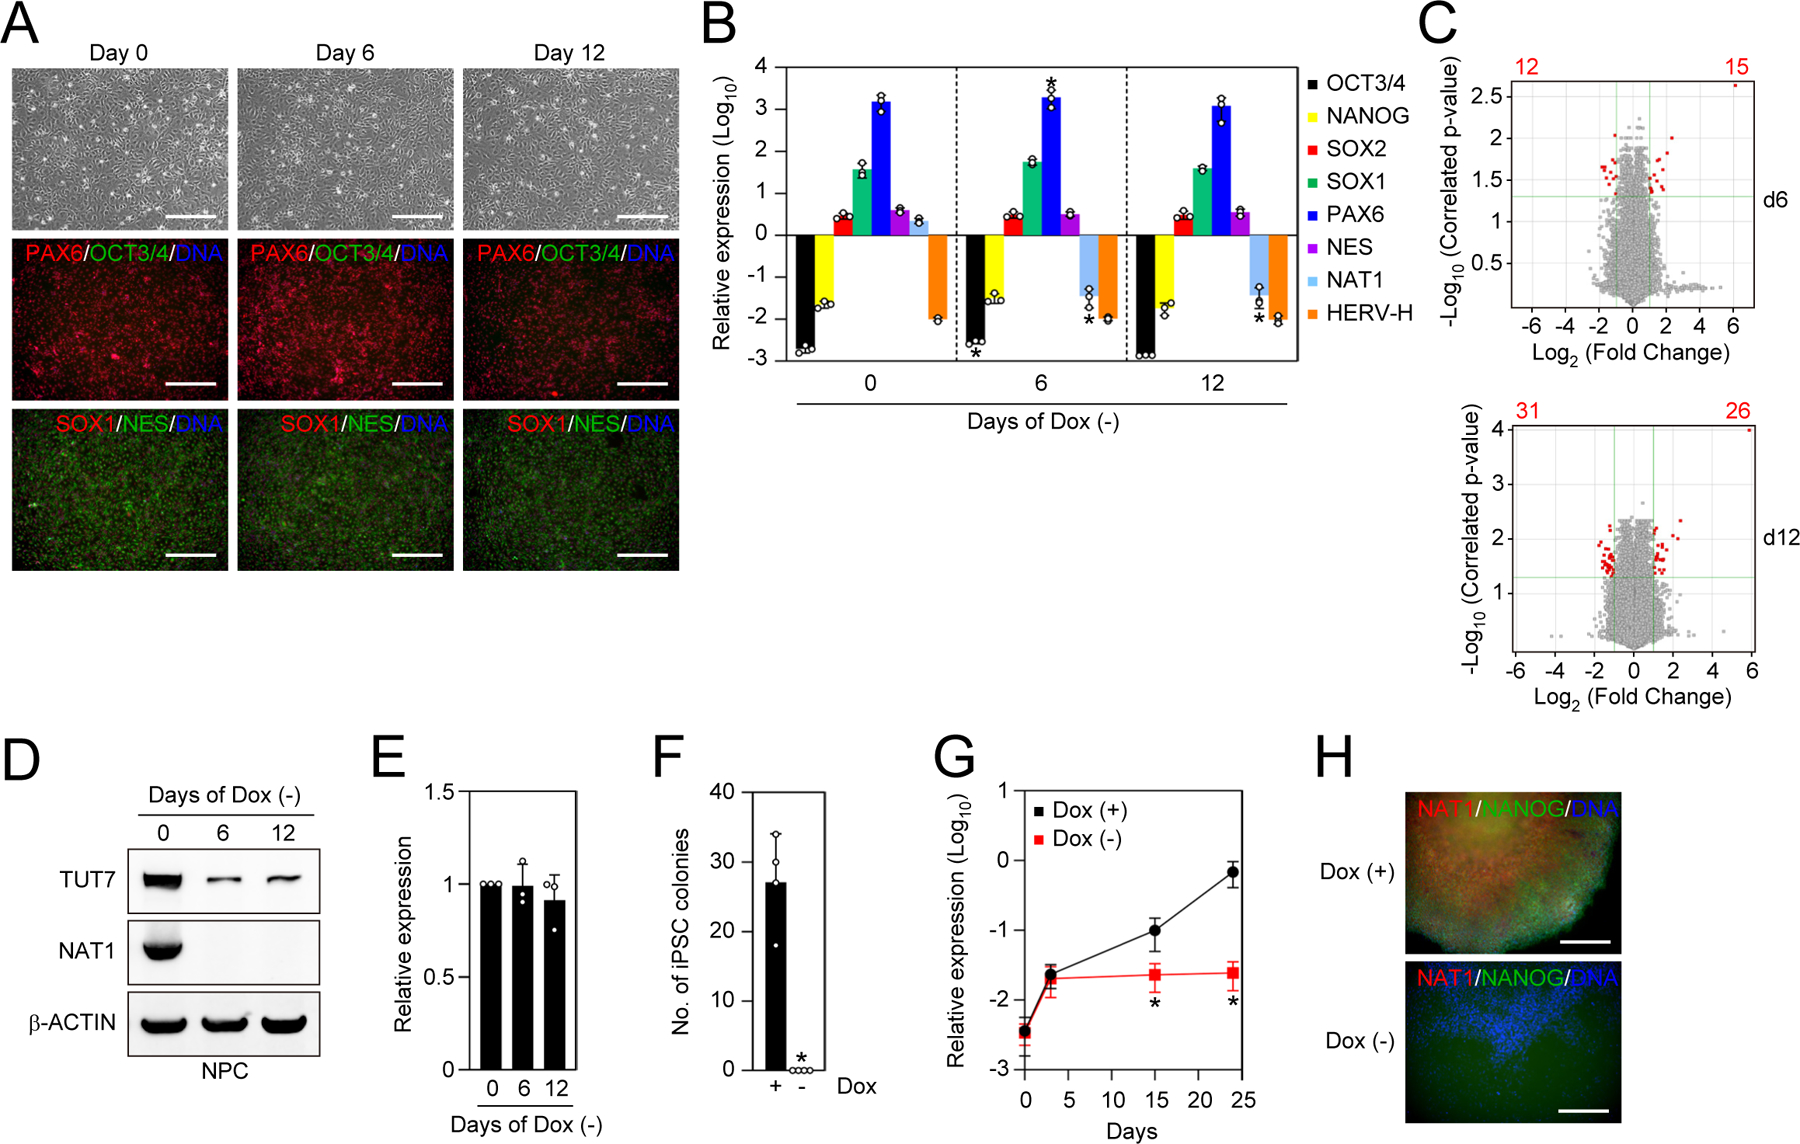
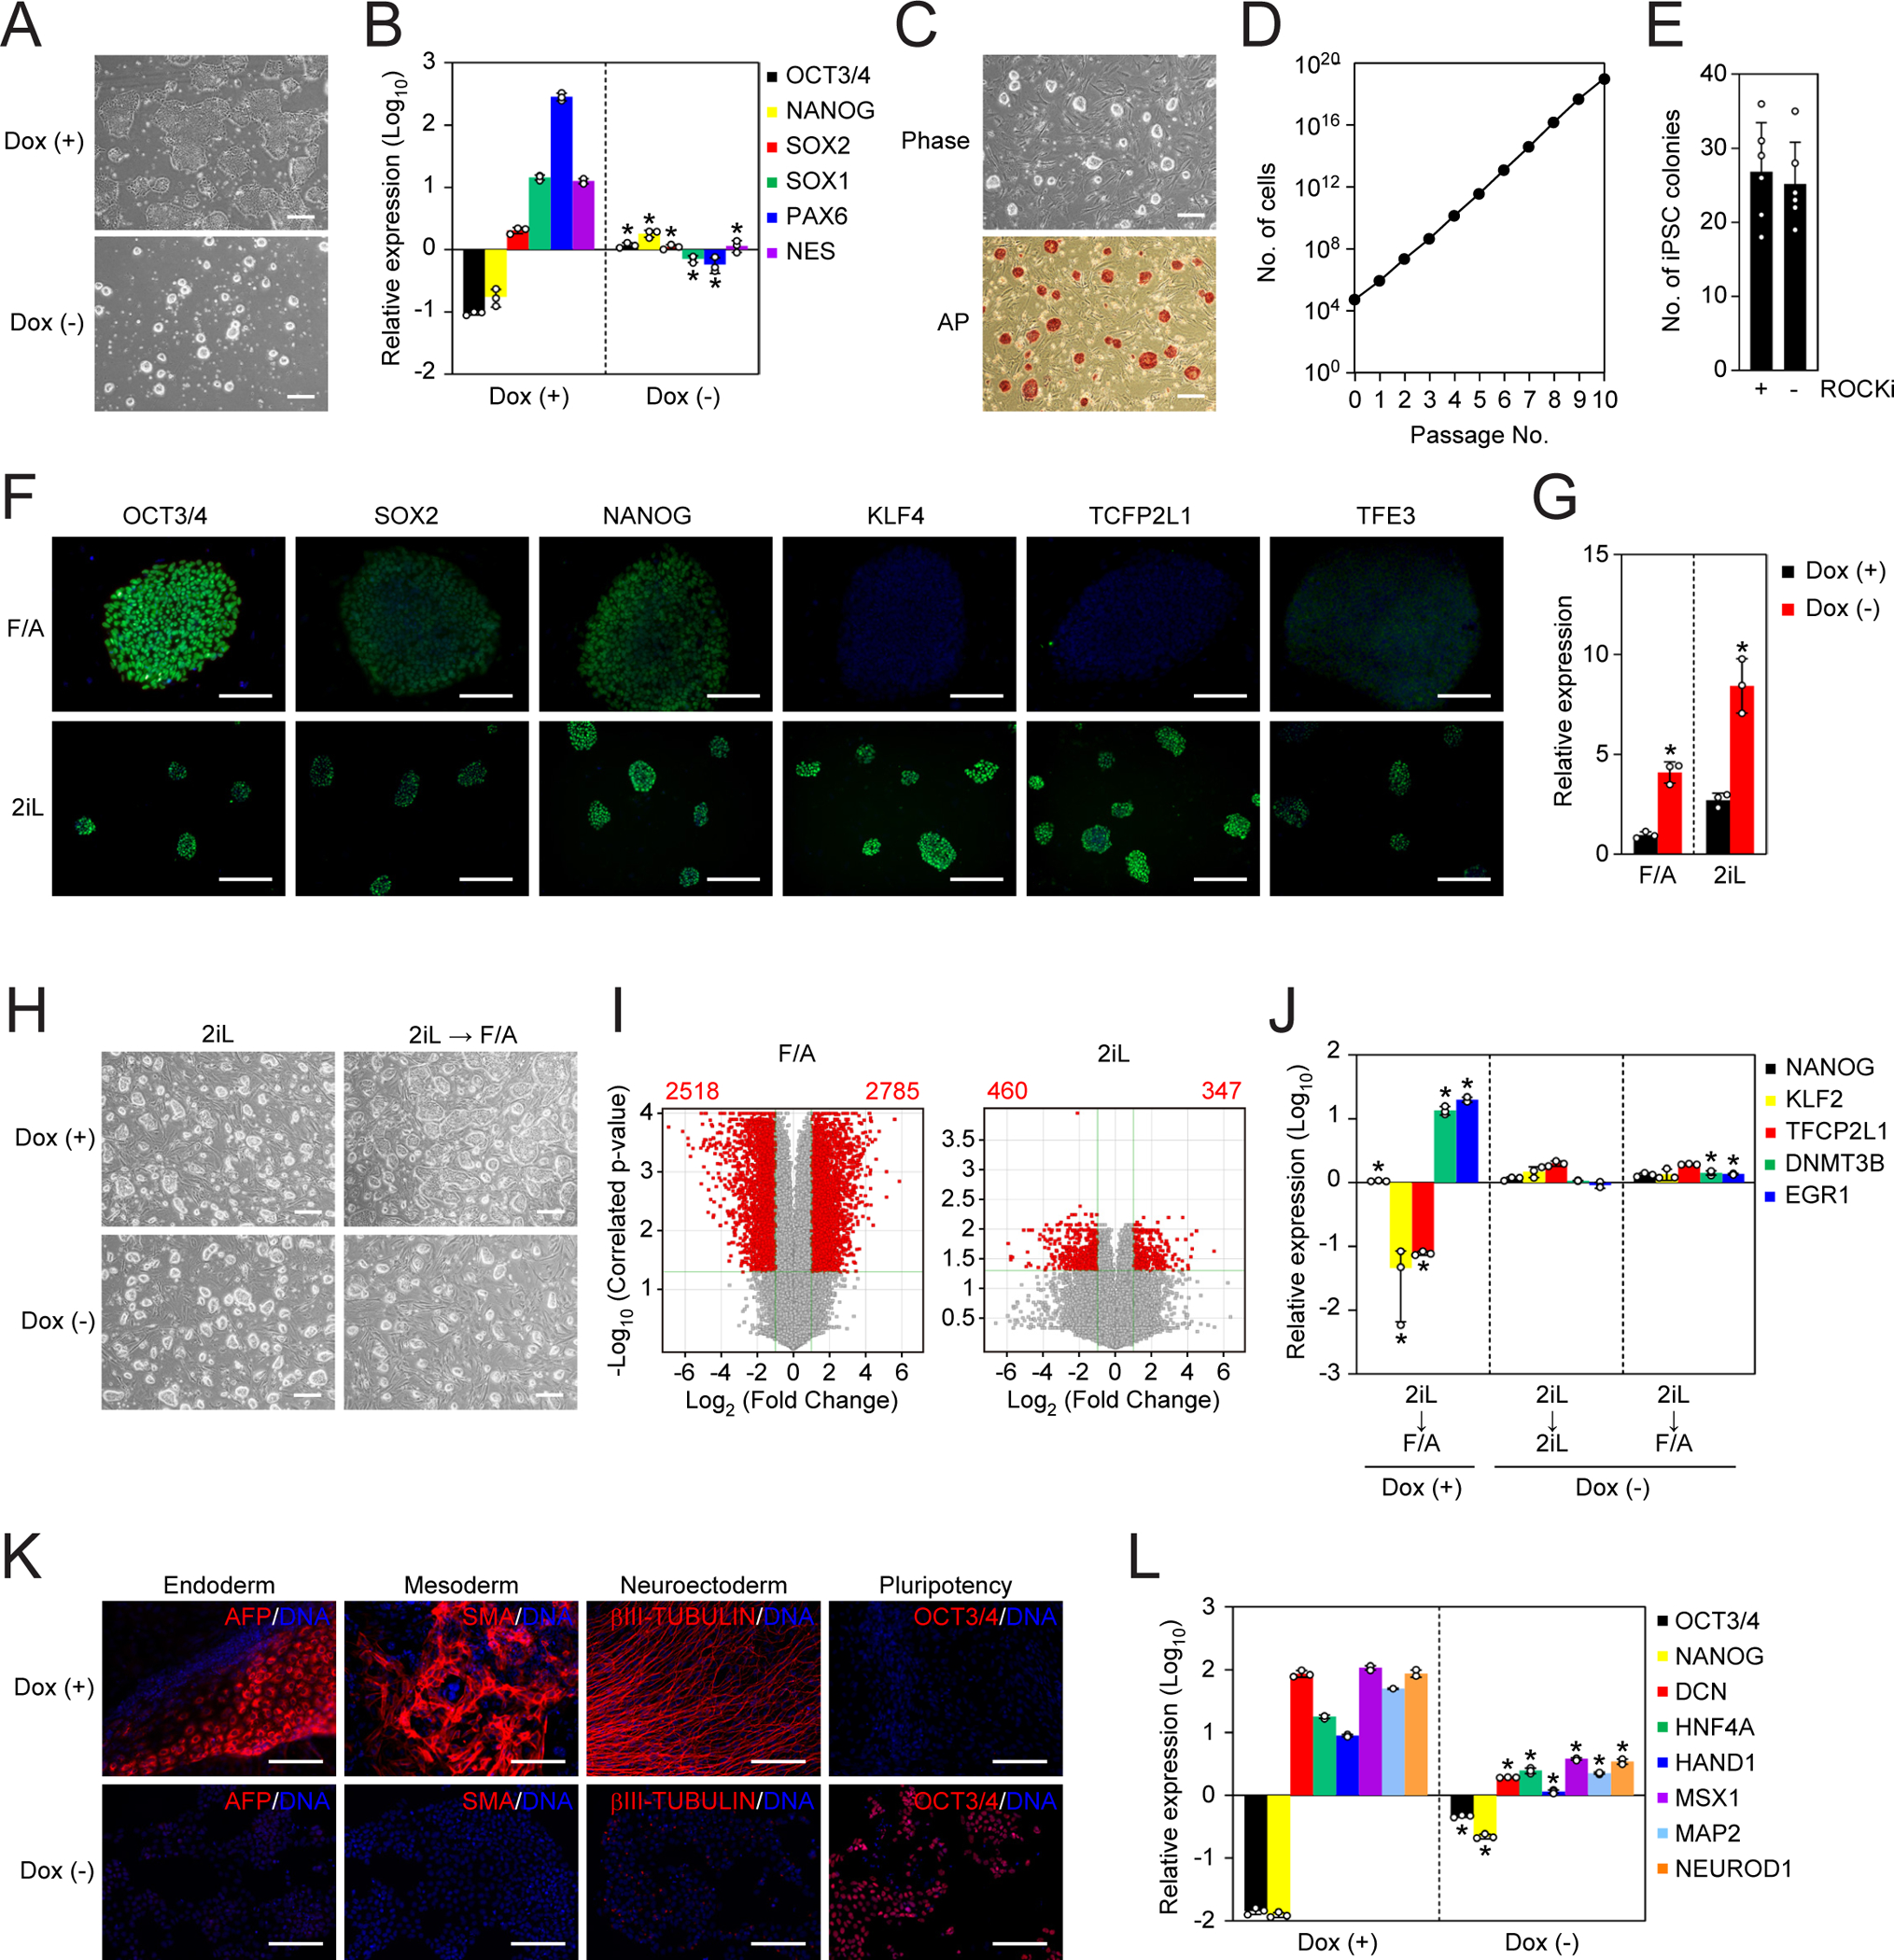
Previous studies have suggested that the loss of the translation initiation factor eIF4G1 homolog NAT1 induces excessive self-renewability of naive pluripotent stem cells (PSCs); yet the role of NAT1 in the self-renewal and differentiation of primed PSCs is still unclear. Here, we generate a conditional knockout of NAT1 in primed PSCs and use the cells for the functional analyses of NAT1. Our results show that NAT1 is required for the self-renewal and neural differentiation of primed PSCs. In contrast, NAT1 deficiency in naive pluripotency attenuates the differentiation to all cell types. We also find that NAT1 is involved in efficient protein expression of an RNA uridyltransferase, TUT7. TUT7 is involved in the neural differentiation of primed PSCs via the regulation of human endogenous retrovirus accumulation. These data demonstrate the essential roles of NAT1 and TUT7 in the precise transition of stem cell fate.

Keywords: endogenous retrovirus; neural differentiation; pluripotency; translation.


Conflict of interest statement

Declaration of Interests K.T. is on the scientific advisory board of I Peace, without salary. B.R.C. is a scientific advisor to Tenaya Therapeutics. S.Y. is a scientific advisor (without salary) to iPS Academia Japan.

Figures

Figure 1 |
Figure 1 |. NAT1 is required for the self-renewal of primed human iPSCs
A. Representative images of NAT1 KO human iPSCs in F/A condition. Bars indicate 100 μm. See also Figure S1. B. The loss of pluripotency by NAT1 KO was quantified by alkaline phosphatase (AP) staining. C. Relative expression of pluripotency and differentiation markers in the time course of NAT1 KO iPSCs in F/A condition analyzed by qRT-PCR. Values are normalized by GAPDH and compared with 585A1 human iPSCs. *P<0.05 vs. day 0 by unpaired t-test. n=3. D. Representative images of NAT1 cKO iPSCs with (+) or without (−) Dox on MEF feeders. Bars indicate 100 μm. E. Volcano plot showing global gene expression of NAT1 cKO iPSCs maintained in F/A condition with (+) or without (−) Dox for 6 days. Red dots indicate differentially expressed genes with statistical significance (FC>2, FDR<0.05). Pearson correlation coefficient was 0.9787. n=3. F. Relative expression of pluripotency, mesendodermal and neuroectodermal genes in NAT1 cKO iPSCs maintained in F/A condition with no Dox for 6 days compared with the same iPSCs with Dox analyzed by microarray. n=3. G. Relative expression of NAT1 on days 0–6 of Dox addition in F/A condition by qRT-PCR. Values are normalized by GAPDH and compared with 1B4 human iPSCs. n=3. H. Representative images of human iPSCs in the time course of NAT1 KD. Bars indicate 100 μm. I. Relative expression of pluripotency and differentiation markers in the cells shown in Fig. 1G by qRT-PCR. Values are normalized by GAPDH and compared with 1B4 human iPSCs. *P<0.05 vs. day 0 by unpaired t-test. n=3.
Figure 2 |
Figure 2 |. NAT1 is required for the transition from primed pluripotency to neural progenitor fate
A. Immunocytochemistry of differentiated NAT1 WT and KO iPSCs by EB formation. Bars indicate 100 μm. B. Relative expression of pluripotency and differentiation markers in the cells shown in Fig. 2A by qRT-PCR. Values are normalized by GAPDH and compared with 585A1 human iPSCs. *P<0.05 vs. Dox (+) by unpaired t-test. n=3. C. Immunocytochemistry of differentiated NAT1 cKO iPSCs in the presence or absence of Dox by dSMADi. Bars indicate 100 μm. D. Relative expression of pluripotency and neural genes in the cells shown in Fig. 2C analyzed by qRT-PCR. Values are normalized by GAPDH and compared with 585A1 human iPSCs. *P<0.05 vs. Dox (+) by unpaired t-test. n=3. E. Immunocytochemistry of differentiated NAT1 WT and KD iPSCs by dSMADi. Bars indicate 100 μm. F. Relative expression of pluripotency and neural genes in the cells shown in Fig. 2E analyzed by qRT-PCR. Values are normalized by GAPDH and compared with 1B4 human iPSCs. *P<0.05 vs. WT by unpaired t-test. n=3.
Figure 3 |
Figure 3 |. Loss of NAT1 enhances HERV-Hs to inhibit neural differentiation
A. Relative expression of HERV-H-related transcripts in NAT1 cKO human iPSCs maintained in F/A condition with no Dox compared to those in same cell line with Dox analyzed by microarray. n=3. B. Relative expression of transposable elements in NAT1 cKO human iPSCs maintained in F/A condition on days 0, 6 and 12 of Dox removal analyzed by qRT-PCR. Values are normalized by GAPDH and compared with 585A1 human iPSCs. *P<0.05 vs. day 0 by unpaired t-test. n=3. C. Fold enrichment of PolII occupancy on the promoter regions of HERVs, OCT3/4 and GAPDH in NAT1 cKO human iPSCs maintained in F/A condition with or without Dox for 6 days analyzed by qPCR. n=3. Values are normalized by input control. *P<0.05 vs. Dox (+) by unpaired t-test. n=3. D. Relative amounts of total and nascent transcribed pan HERV-Hs, ESRG, OCT3/4 and GAPDH RNAs in NAT1 cKO human iPSCs maintained in F/A condition with or without Dox for 6 days analyzed by qPCR. Values are normalized by spike RNA control and compared with the total of Dox (+). *P<0.05 vs. Dox (+) by unpaired t-test. n=3. E. Relative expression of pluripotency and differentiation markers in NAT1 cKO human iPSCs transfected with Mock or HERV-H shRNA (shHERVH) maintained in F/A condition with (+) or without (−) Dox for 6 days. Values are normalized by GAPDH and compared with 585A1 human iPSCs. *P<0.05 vs. Mock by unpaired t-test. n=3. See also Figure S2. F. Immunocytochemistry of differentiated NAT1 cKO human iPSCs transfected with Mock or HERV-H shRNA (shHERVH) in the presence (+) or absence (−) of Dox by dSMADi. Bars indicate 100 μm. See also Figure S2. G. Relative expression of pluripotency and neural genes in the cells shown in Fig. 3F analyzed by qRT-PCR. Values are normalized by GAPDH and compared with 585A1 human iPSCs. *P<0.05 vs. Mock by unpaired t-test. n=3. See also Figure S2.
Figure 4 |
Figure 4 |. NAT1 is required for the self-renewal and neural differentiation potential of mouse EpiSCs
A. Immunocytochemistry of NAT1 cKO mouse EpiSCs maintained with (+) or without (−) Dox for 6 days. Bars indicate 100 μm. See also Figure S3. B. Representative phase contrast images of NAT1 cKO primed EpiSCs maintained in F/A or naïve-converted cells in LIF-containing media with (+) or without (−) Dox. Bars indicate 100 μm. C. Relative expression of naïve and primed pluripotency markers in the cells shown in Fig. 4B analyzed by qRT-PCR. Values are normalized by Actb and compared with X-GFP mouse EpiSCs. *P<0.05 vs. Dox (+) by unpaired t-test. n=3. D. Immunocytochemistry of differentiated cells derived from primed NAT1 cKO mouse EpiSCs in the presence (+) or absence (−) of Dox by EB formation. Bars indicate 100 μm. E. Relative expression of pluripotency and differentiation markers in the cells shown in Fig. 4D analyzed by qRT-PCR. Values are normalized by Actb and compared with X-GFP mouse EpiSCs. *P<0.05 vs. Dox (+) by unpaired t-test. n=3. F. Immunocytochemistry of differentiated cells derived from naïve NAT1 cKO mouse EpiSCs in the presence (+) or absence (−) of Dox by EB formation. Bars indicate 100 μm. G. Relative expression of pluripotency and differentiation markers in the cells shown in Fig. 4F analyzed by qRT-PCR. Values are normalized by Actb and compared with RF8 mouse ESCs. *P<0.05 vs. Dox (+) by unpaired t-test. n=3. H. Relative expression of transposable elements in NAT1 cKO mouse primed EpiSCs (F/A) or naïve-converted cells (LIF) on day 6 of Dox removal compared to those in EpiSCs analyzed by qRT-PCR. Values are normalized by Actb and compared with X-GFP mouse EpiSCs. *P<0.05 vs. Dox (+) by unpaired t-test. n=3.
Figure 5 |
Figure 5 |. TUT7 is a target of NAT1
A. Pull down of TUT7 mRNA with NAT1 protein. TUT7 mRNAs in immunoprecipitants of 3xFLAG-tagged NAT1 (NAT1-FLAG) or non-tagged NAT1 (negative control, NC) human iPSCs and mouse EpiSCs purified using a FLAG antibody were quantified were by qRT-PCR. Values are normalized by input control. n=3. See also Tables S1 and S2. B. Western blots of NAT1 cKO iPSCs in F/A condition on days 0–3 after Dox removal. On day 3 after Dox removal, we added Dox and collected the cell lysate after 1 day as rescued cells (R). See also Figure S4. C. Relative expression of TUT7 in the cells shown in Fig. 5B analyzed by qRT-PCR. Values are normalized by GAPDH and compared with the sample on day 0. n=3. D. Western blots of NAT1 cKO mouse EpiSCs on days 0–3 after Dox removal. On day 3 after Dox removal, we added Dox and collected the cell lysate after 1 day as rescued cells (R). E. Relative expression of Tut7 in the cells shown in Fig. 5D analyzed by qRT-PCR. Values are normalized by Actb and compared with the sample on day 0. n=3. F. Western blots of NAT1 cKO human iPSCs maintained in F/A condition with (+) or without (−) Dox and treated with (+) or without (−) MG132. G. Relative expression of HERV-H and non-HERV-H non-coding RNAs in NAT1 KD or TUT7 KD human iPSCs in F/A condition analyzed by qRT-PCR. Values are normalized by GAPDH and compared with 1B4 human iPSCs. n=3. See also Figure S5. H. Relative uridylation levels of pan HERV-Hs, ESRG, OCT3/4 and GAPDH RNAs in NAT1 KD or TUT7 KD human iPSCs in F/A condition analyzed by qRT-PCR Values are normalized by spike RNA and compared with the control (1B4). *P<0.05 vs. control by unpaired t-test. n=3. See also Figure S5. I. Scheme of the TUT7 RNA dissection. See also Figure S6. J. Relative expression of TUT7 in NAT1 cKO human iPSCs transfected with the plasmids shown in Fig. 5H maintained in F/A condition with (+) or without (−) Dox. Values are normalized by GAPDH and compared with Mock. n=3. See also Figure S6. K. Western blots of the cells shown in Fig. 5J. See also Figure S6. L. The effects of the UTRs on the activity of firefly luciferase (Fluc) in NAT1 cKO iPSCs in F/A condition with (+) or without (−) Dox. Values of Fluc are normalized with co-transfected Renilla luciferase (Rluc) activity. *P<0.05 vs. Dox (+) by unpaired t-test. n=3. M. The effects of the UTRs on the activity of Rluc in NAT1 cKO human iPSCs in F/A condition with (+) or without (−) Dox. Values of Rluc are normalized with Fluc activity. *P<0.05 vs. Dox (+) by unpaired t-test. n=3. n. The truncation of TUT7 5’UTR. The effects of the series of truncated human TUT7 5’UTRs on the activity of Fluc in NAT1 cKO iPSCs in F/A condition with (+) or without (−) Dox were analyzed. Values of Fluc are normalized with co-transfected Rluc activity. *P<0.05 vs. Dox (+) by unpaired t-test. n=3. O. Representative absorbance profiling of the total fractionated RNA of NAT1 cKO human iPSCs maintained with (+) or without (−) Dox. MS, monosomes (fraction 4–9), LP, light polysomes (fraction 10–13); HP, heavy polysomes (fraction 14–18). P. The distribution of TUT7 mRNAs in fractionated MS, LP and HP of NAT1 cKO human iPSCs on days 0 (+) and 3 (−) of Dox removal treated with or without harringtonine or EDTA analyzed by qRT-PCR. Values are normalized by spike RNA and total input RNA, and compared with the sample on day 0. *P<0.05 vs. Dox (+) by unpaired t-test. n=3.
Figure 6 |
Figure 6 |. NAT1 is dispensable for the self-renewal of NPCs
A. The generation of NAT1 cKO human NPCs under the presence of NAT1 transgene expression. Shown are representative images of NAT1 cKO human iPSC-derived NPCs cultured with (day 0) or without (days 6 and 12) Dox. Bars indicate 100 μm. B. Relative expression of pluripotency and neural genes in NAT1 cKO human iPSC-derived NPCs cultured with (day 0) or without (days 6 and 12) Dox analyzed by qRT-PCR. Values are normalized by GAPDH and compared with 585A1 human iPSCs. *P<0.05 vs. day 0 by unpaired t-test. n=3. C. Volcano plots showing global gene expression of NAT1 cKO human iPSC-derived NPCs cultured with or without Dox for 6 (d6) and 12 (d12) days. Red dots indicate differentially expressed genes with statistically significance (FC>2, FDR<0.05). Pearson correlation coefficients of the d6 and d12 samples were 0.9966 and 0.9969, respectively. n=3. D. Western blots of NAT1 cKO human NPCs on days 0, 6 and 12 after Dox removal. E. Relative expression of TUT7 in the cells shown in Fig. 6D analyzed by qRT-PCR. Values are normalized by GAPDH and compared with the sample on day 0. *P<0.05 vs. day 0 by unpaired t-test. n=3. F. Number of AP (+) iPSC colonies from 5×10⁴ OSKM-transduced NAT1 cKO human NPCs in the presence (+) or absence (−) of Dox on day 24. *P<0.05 vs. Dox (+) by unpaired t-test. n=4. G. Relative expression of NANOG in the cultures of OSKM-transduced NAT1 cKO NPCs with (+) or without (−) Dox on days 0, 3, 15 and 24 analyzed by qRT-PCR. Values are normalized by GAPDH and compared with 585A1 iPSCs. *P<0.05 vs. Dox (+) by unpaired t-test. n=3. H. Immunocytochemistry of the cultures of OSKM-transduced NAT1 cKO NPCs with (+) or without (−) Dox on day 24. Bars indicate 100 μm.
Figure 7 |
Figure 7 |. Loss of NAT1 restricts the differentiation of naïve-like human iPSCs
A. Representative images of NAT1 cKO human iPSCs maintained with (+) or without (−) Dox in 2iL condition for 6 days. Bars indicate 100 μm. B. Relative expression of pluripotency and neural genes in the cells shown in Fig. 7A analyzed by qRT-PCR. Values are normalized by GAPDH and compared with 585A1 iPSCs. *P<0.05 vs. Dox (+) by unpaired ttest. n=3. C. Representative images of NAT1 KO iPSCs converted to the naïve-like state. Phase contrast image (upper) and AP stained image (lower) are shown. Bars indicate 100 μm. D. Growth curve of NAT1 KO iPSCs converted to the naïve-like state. E. Colony formation efficiency of naïve-like NAT1 KO human iPSCs plated with (+) or without (−) ROCK inhibitor (ROCKi). n=6. F. Immunocytochemistry of pluripotency markers in NAT1 cKO human iPSCs in F/A or 2iL conditions. Bars indicate 50 μm. G. Relative expression of HERV-Hs in NAT1 cKO human iPSCs in F/A or 2iL condition with (+) or without (−) Dox. Values are normalized by GAPDH and compared with 585A1 human iPSCs. *P<0.05 vs. Dox (+) by unpaired t-test. n=3. H. Representative phase contrast images of NAT1 cKO human iPSCs with (+) or without (−) Dox in 2iL condition or after transferring from 2iL to F/A condition. Bars indicate 100 μm. I. Volcano plots showing global gene expression of NAT1 cKO human iPSCs with (+) or without (−) Dox in F/A (left) or 2iL (right) condition. Red dots indicate differentially expressed genes with statistical significance (FC>2, FDR<0.05). Pearson correlation coefficients of F/A and 2iL samples were 0.9787 and 0.9827, respectively. n=3. The data of F/A samples are identical to those shown in Fig. 1E. J. Relative expression of naïve and primed pluripotency markers in the cells shown in Fig. 7H analyzed by qRT-PCR. Values are normalized by GAPDH and compared with Dox (+) in 2iL. *P<0.05 vs. 2iL by unpaired t-test. n=3. K. Immunocytochemistry of differentiated cells derived from naïve-like NAT1 cKO human iPSCs in the presence (+) or absence (−) of Dox by EB formation. Bars indicate 100 μm. L. Relative expression of pluripotency and differentiation markers in the cells shown in Fig. 7K compared with naïve-like human iPSCs analyzed by qRT-PCR. Values are normalized by GAPDH. *P<0.05 vs. Dox (+) by unpaired t-test. n=3.

References

    1. Aronesty E (2013). Comparison of Sequencing Utility Programs. The Open Bioinformatics Journal 7, 1–8.
    1. Bao S, Tang F, Li X, Hayashi K, Gillich A, Lao K, and Surani MA (2009). Epigenetic reversion of post-implantation epiblast to pluripotent embryonic stem cells. Nature 461, 1292–1295. - PMC - PubMed
    1. Blanco S, Bandiera R, Popis M, Hussain S, Lombard P, Aleksic J, Sajini A, Tanna H, Cortes-Garrido R, Gkatza N, et al. (2016). Stem cell function and stress response are controlled by protein synthesis. Nature 534, 335–340. - PMC - PubMed
    1. Bukhari SIA, Truesdell SS, Lee S, Kollu S, Classon A, Boukhali M, Jain E, Mortensen RD, Yanagiya A, Sadreyev RI, et al. (2016). A Specialized Mechanism of Translation Mediated by FXR1a-Associated MicroRNP in Cellular Quiescence. Molecular cell 61, 760–773. - PMC - PubMed
    1. Chambers SM, Fasano1 CA, Papapetrou EP, Tomishima M, Sadelain M, and Studer L (2009). Highly efficient neural conversion of human ES and iPS cells by dual inhibition of SMAD signaling. Nature biotechnology 27, 275–280. - PMC - PubMed

Publication types

MeSH terms