

Analysis of Genetically Regulated Gene Expression Identifies a Prefrontal PTSD Gene, SNRNP35, Specific to Military Cohorts
- PMID: 32492425
- PMCID: PMC7359754
- DOI: 10.1016/j.celrep.2020.107716
Analysis of Genetically Regulated Gene Expression Identifies a Prefrontal PTSD Gene, SNRNP35, Specific to Military Cohorts
Abstract
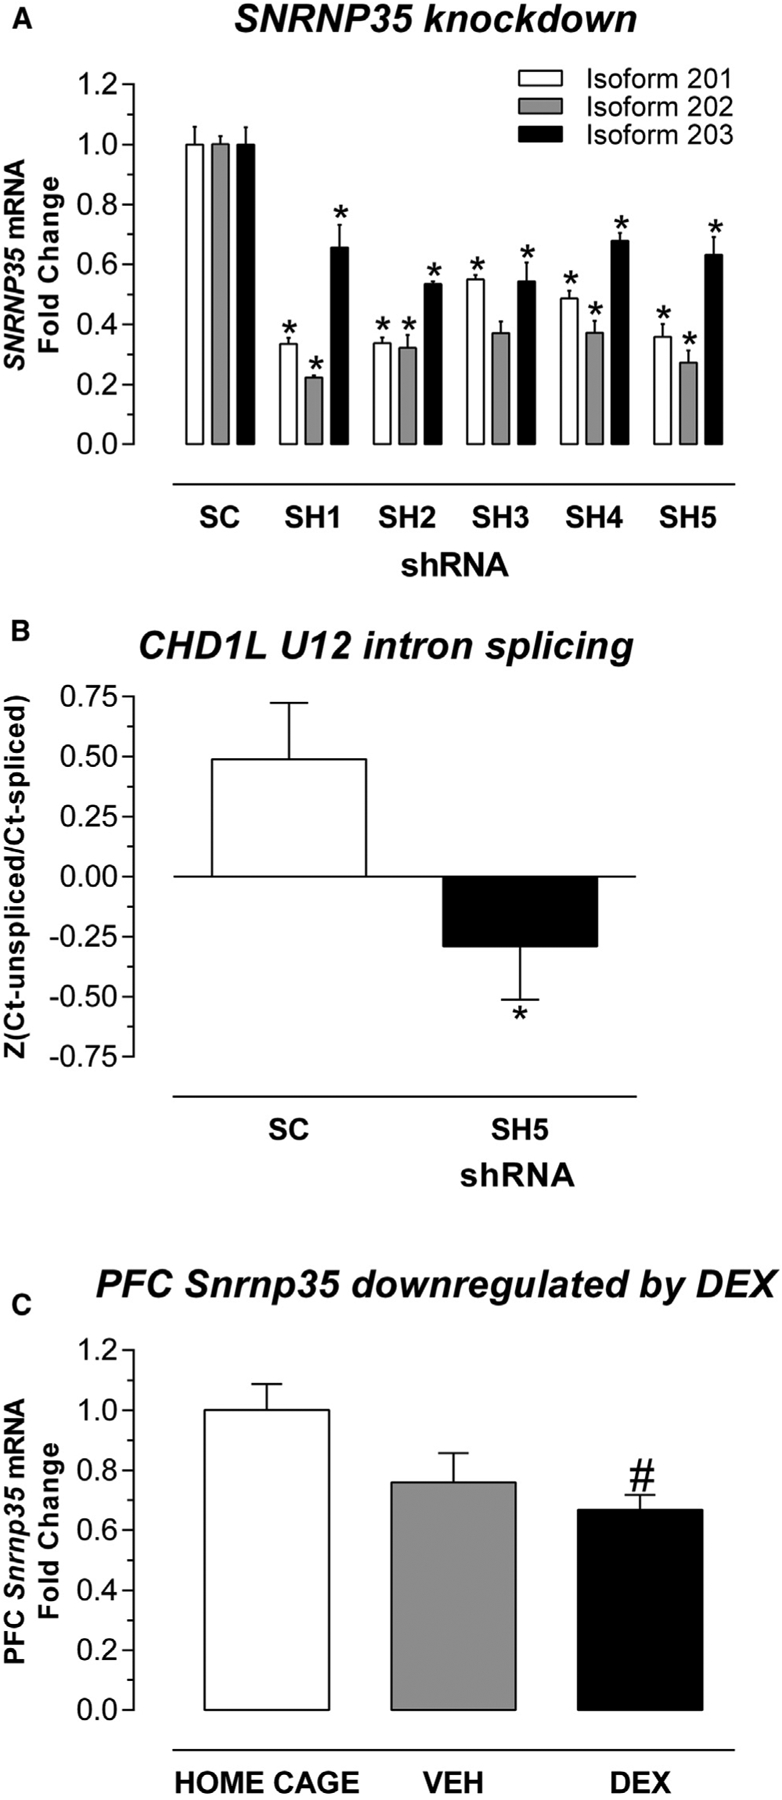
To reveal post-traumatic stress disorder (PTSD) genetic risk influences on tissue-specific gene expression, we use brain and non-brain transcriptomic imputation. We impute genetically regulated gene expression (GReX) in 29,539 PTSD cases and 166,145 controls from 70 ancestry-specific cohorts and identify 18 significant GReX-PTSD associations corresponding to specific tissue-gene pairs. The results suggest substantial genetic heterogeneity based on ancestry, cohort type (military versus civilian), and sex. Two study-wide significant PTSD associations are identified in European and military European cohorts; ZNF140 is predicted to be upregulated in whole blood, and SNRNP35 is predicted to be downregulated in dorsolateral prefrontal cortex, respectively. In peripheral leukocytes from 175 marines, the observed PTSD differential gene expression correlates with the predicted differences for these individuals, and deployment stress produces glucocorticoid-regulated expression changes that include downregulation of both ZNF140 and SNRNP35. SNRNP35 knockdown in cells validates its functional role in U12-intron splicing. Finally, exogenous glucocorticoids in mice downregulate prefrontal Snrnp35 expression.
Keywords: GWAS; PTSD; blood; civilian; glucocorticoid; military; prefrontal cortex; sex; splicing; transcriptomic imputation.
Copyright © 2020 The Author(s). Published by Elsevier Inc. All rights reserved.
Conflict of interest statement
Declaration of Interests J.W.S. is an unpaid member of the Bipolar/Depression Research Community Advisory Panel of 23andMe. D.J.S. has received research grants and/or consultancy honoraria from Biocodex, Lundbeck, and Sun. R.Y. is a co-inventor of the following patent: “Genes associated with posttraumatic-stress disorder, WO 2010029176 A1.” I.L. has been a consultant for ARMGO Pharmaceuticals, Sunovion Pharmaceuticals, and Trimaran Pharma. K.J.R. has received consulting income from Alkermes and is on scientific advisory boards for Janssen, Verily, and Resilience Therapeutics. He has also received sponsored research support from Takeda and Brainsway. N.P.D. has held a part-time paid position at Cohen Veteran Bioscience. He has also been a consultant for Sunovion Pharmaceuticals.
Figures
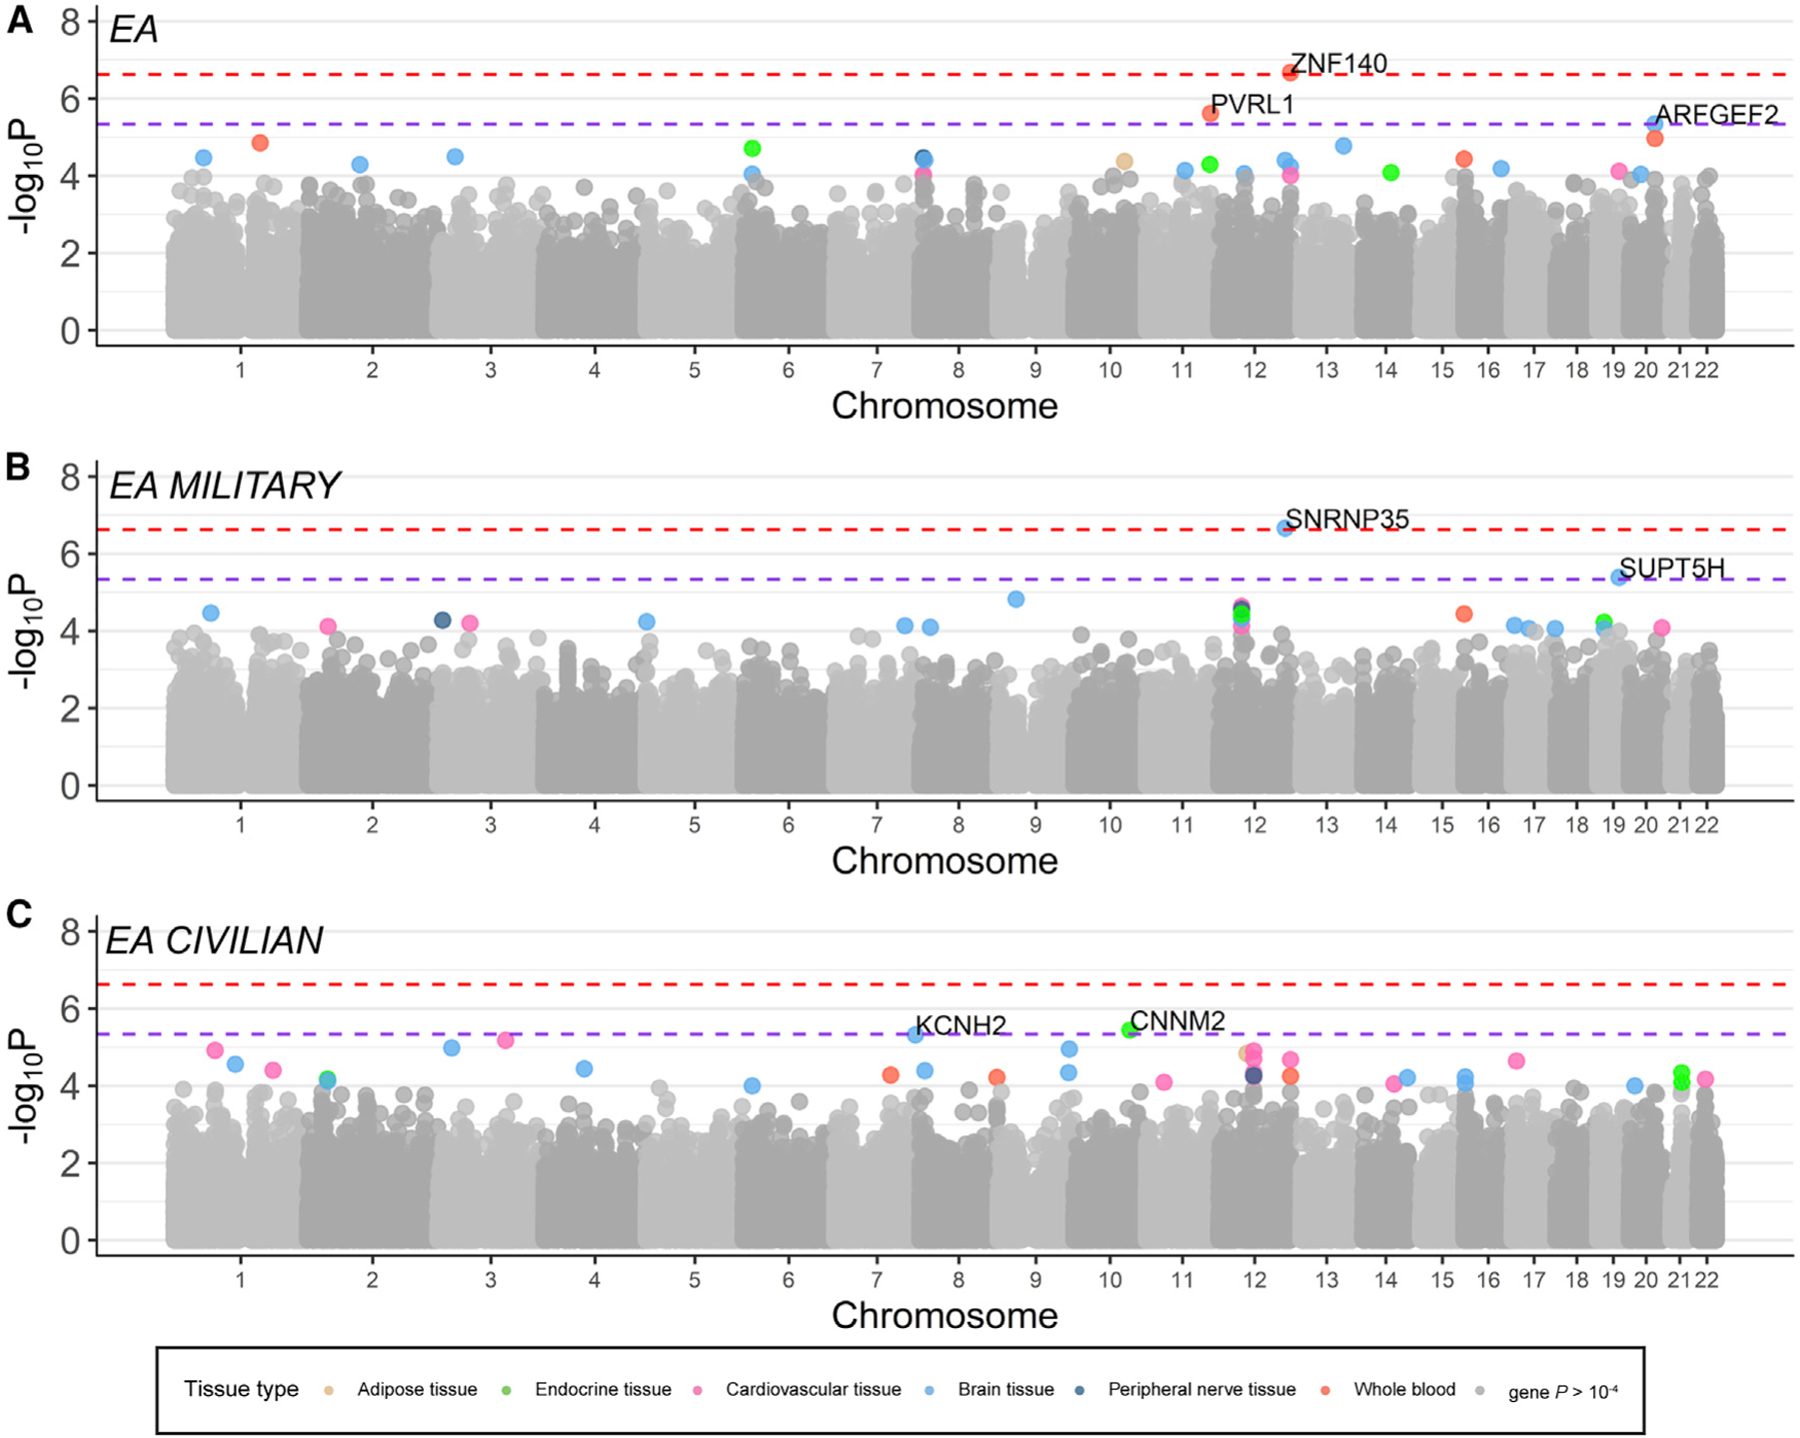
 10–4 are color coded according to tissue type.
References
-
- Aiken MP, and Berry MJ (2015). Posttraumatic stress disorder: possibilities for olfaction and virtual reality exposure therapy. Virt. Real 19, 95–109.
-
- Arloth J, Bogdan R, Weber P, Frishman G, Menke A, Wagner KV, Balsevich G, Schmidt MV, Karbalai N, Czamara D, et al.; Major Depressive Disorder Working Group of the Psychiatric Genomics Consortium (PGC); Major Depressive Disorder Working Group of the Psychiatric Genomics Consortium PGC (2015). Genetic Differences in the Immediate Transcriptome Response to Stress Predict Risk-Related Brain Function and Psychiatric Disorders. Neuron 86, 1189–1202. - PMC - PubMed
-
- Baker DG, Nash WP, Litz BT, Geyer MA, Risbrough VB, Nievergelt CM, O’Connor DT, Larson GE, Schork NJ, Vasterling JJ, et al.; MRS Team (2012). Predictors of risk and resilience for posttraumatic stress disorder among ground combat Marines: methods of the Marine Resiliency Study. Prev. Chronic Dis 9, E97. - PMC - PubMed
-
- Barbeira AN, Dickinson SP, Bonazzola R, Zheng J, Wheeler HE, Torres JM, Torstenson ES, Shah KP, Garcia T, Edwards TL, et al.; GTEx Consortium (2018). Exploring the phenotypic consequences of tissue specific gene expression variation inferred from GWAS summary statistics. Nat. Commun 9, 1825. - PMC - PubMed
Publication types
MeSH terms
Substances
Grants and funding
- KL2 TR002542/TR/NCATS NIH HHS/United States
- R01 MH117292/MH/NIMH NIH HHS/United States
- R01 MH107666/MH/NIMH NIH HHS/United States
- UL1 TR002541/TR/NCATS NIH HHS/United States
- R01 MH124847/MH/NIMH NIH HHS/United States
- R01 MH118278/MH/NIMH NIH HHS/United States
- P50 MH115874/MH/NIMH NIH HHS/United States
- U01 MH109536/MH/NIMH NIH HHS/United States
- R01 MH124839/MH/NIMH NIH HHS/United States
- R01 MH101820/MH/NIMH NIH HHS/United States
- T32 MH017119/MH/NIMH NIH HHS/United States
- U01 MH109539/MH/NIMH NIH HHS/United States
- R01 MH106595/MH/NIMH NIH HHS/United States
- P30 DK020595/DK/NIDDK NIH HHS/United States
LinkOut - more resources
Full Text Sources
Other Literature Sources
Medical
Molecular Biology Databases
