. 2020 Jun 2;31(9):107717.
doi: 10.1016/j.celrep.2020.107717.

Functional Divergence of the Arabidopsis Florigen-Interacting bZIP Transcription Factors FD and FDP

Affiliations

Functional Divergence of the Arabidopsis Florigen-Interacting bZIP Transcription Factors FD and FDP

Maida Romera-Branchat et al. Cell Rep. .

Erratum in

Abstract

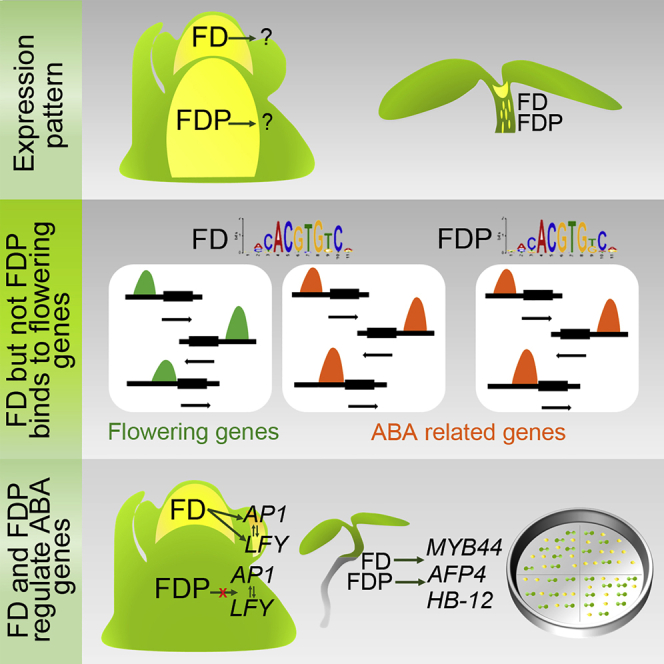
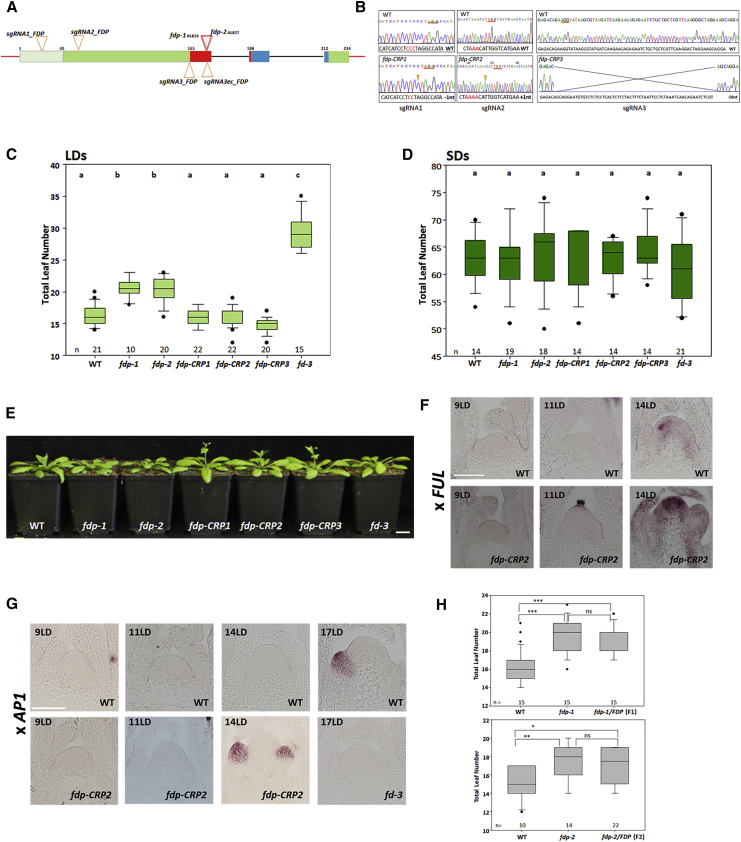
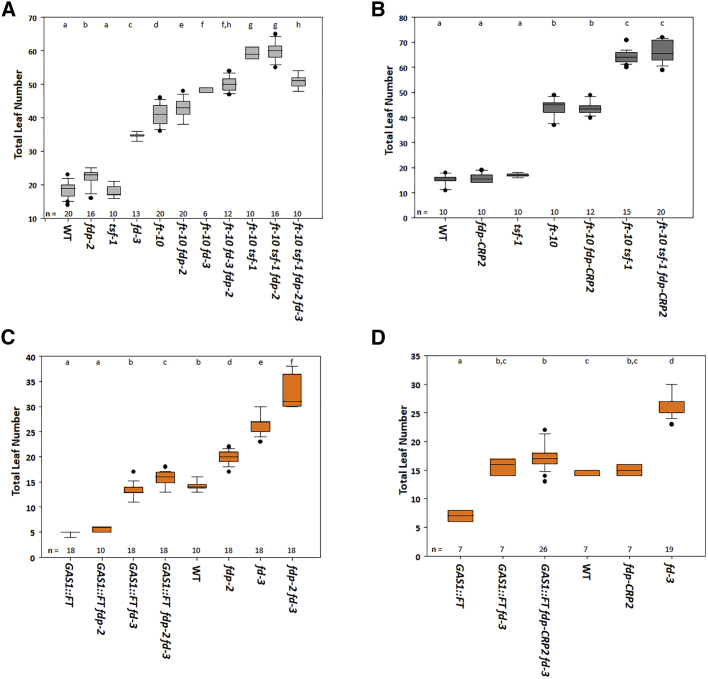
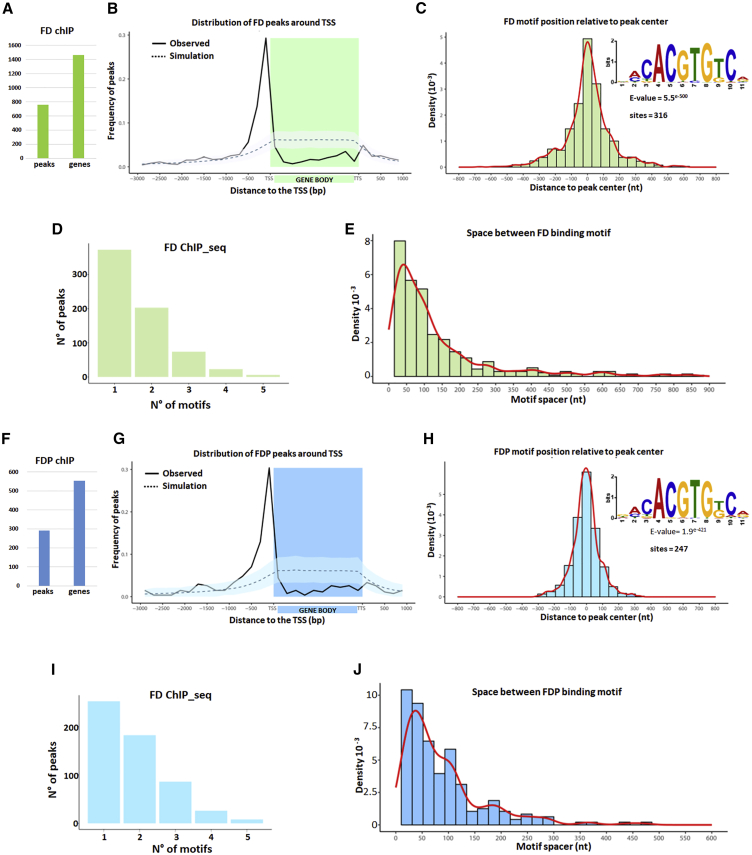
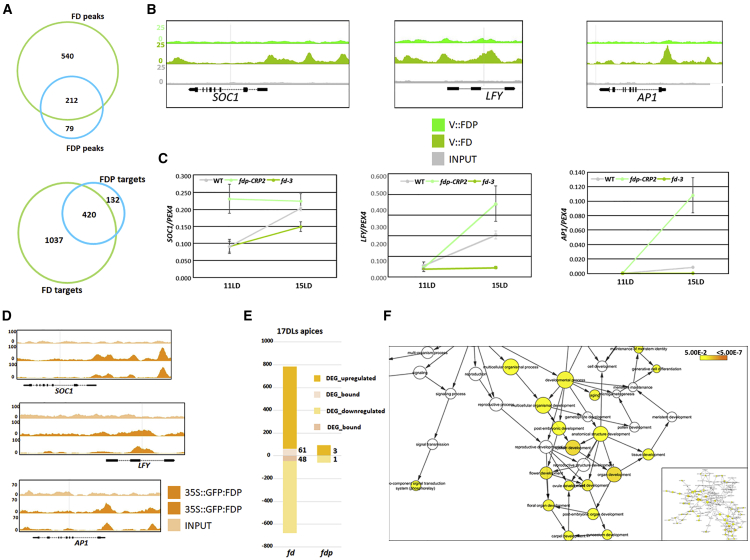
Flowering of many plant species depends on interactions between basic leucine zipper (bZIP) transcription factors and systemically transported florigen proteins. Members of the genus Arabidopsis contain two of these bZIPs, FD and FDP, which we show have largely complementary expression patterns in shoot apices before and during flowering. CRISPR-Cas9-induced null mutants for FDP flower slightly earlier than wild-type, whereas fd mutants are late flowering. Identical G-box sequences are enriched at FD and FDP binding sites, but only FD binds to genes involved in flowering and only fd alters their transcription. However, both proteins bind to genes involved in responses to the phytohormone abscisic acid (ABA), which controls developmental and stress responses. Many of these genes are differentially expressed in both fd and fdp mutant seedlings, which also show reduced ABA sensitivity. Thus, florigen-interacting bZIPs have distinct functions in flowering dependent on their expression patterns and, at earlier stages in development, play common roles in phytohormone signaling.

Keywords: ABA; Arabidopsis; ChIP-seq; FD; FDP; FT; RNA-seq; bZIPs; florigen; flowering.


Conflict of interest statement

Declaration of Interests The authors declare no competing interests.

Figures

None
Graphical abstract
Figure 1
Figure 1
Characterization and Flowering Time of fdp Mutants (A) FDP mutant alleles. Red boxes: exons encoding the basic region of the bZIP domain. Blue boxes: exons encoding the leucine zipper domain. Light green box: exon encoding N-terminal coding sequence defined in this work. Green boxes: other exons. Dark gray lines: introns. Red lines: 5′ and 3′ UTRs. Red triangles: the TILLING alleles fdp-1 and fdp-2. The amino acid changes in fdp-1 and fdp-2 are shown. Orange triangles: the positions of single guide RNAs (sgRNAs) used to generate CRISPR alleles. (B) Chromatogram of the nucleotide sequences of the CRISPR alleles. The PAM region is underlined in orange. In fdp-CRP1, the single-nucleotide deletion is marked by an orange arrow. In fdp-CRP2, one additional nucleotide is marked by an orange arrow. In fdp-CRP3, a 58-nt deletion exists between the two sgRNAs. (C) Flowering time of WT, five fdp mutants, and fd-3 mutants under LDs. (D) Flowering time of WT, five fdp mutants, and fd-3 mutants under SDs. (E) Mutants and WT plants grown for 30 LDs. (F) In situ hybridization of FUL mRNA in apices of 9-, 11-, and 14-day-old WT and fdp-CRP2 plants under LDs. (G) In situ hybridization of AP1 mRNA in apices of 9-, 11-, 14-, and 17-day-old WT and fdp-CRP2 plants and 17-day-old fd-3 plants under LDs. (H) Top: flowering time of fdp-1 homozygotes and heterozygotes compared to WT. Bottom: flowering time of fdp-2 homozygotes and heterozygotes compared to WT. In (C), (D), and (H), one-way ANOVA followed by Turkey test was used for the statistical analysis. Letters shared in common between the genotypes in (C) and (D) indicate no significant differences in flowering time. In (C) and (H), groups were different with p ≤ 0.001, whereas in (D), p = 0201. In (H), ∗∗∗p ≤ 0.001, ∗∗p ≤ 0.01, p ≤ 0.05; and ns, no significance. Scale bar, 2 cm (E); 50 μm (F and G). The whiskers are defined in the STAR Methods.
Figure 2
Figure 2
Genetic Interactions between FD and FDP (A) Flowering times of the illustrated genotypes under LDs. (B) Plants of the illustrated genotypes grown under LDs for 36 days. (C) Flowering times of 35S::HA:FDP and 35S::GFP:FDP transgenic plants compared to WT. (D) Flowering times of the illustrated genotypes grown under LDs. (E) Plants of the illustrated genotypes grown under LDs for 28 days. (F) Rosette leaves series of 35S::HA:FD, 35S::HA:FD, and WT of 28-day-old plants. In (A) and (F), one-way ANOVA followed by Turkey test was used. In (C), one-way ANOVA followed by the Holm-Sidak test was used. Shared letters between the genotypes in (A), (C), and (F) indicate no significant difference in flowering time. In (A) and (F), groups were considered statistically different when p ≤ 0.001, whereas in (C) when p ≤ 0.05. Scale bars, 1 cm (F) and 2.5 cm (B).
Figure 3
Figure 3
FT Promotes Flowering Independently of FD and FDP (A) Flowering time of the illustrated genotypes incorporating fdp-2 grown under LDs. (B) Flowering time of the illustrated genotypes incorporating fdp-CRP2 grown under LDs. (C) Flowering time of the illustrated genotypes incorporating GAS1::FT into the allele fdp-2 grown under LDs. (D) Flowering time of the illustrated genotypes incorporating GAS1:FT into allele fdp-CRP2 grown under LDs. In all panels, statistical analysis was performed as in Figure 1. In (A) and (B), groups were considered statistically different when p ≤ 0.001, whereas in (C) and (D), when p ≤ 0.05.
Figure 4
Figure 4
Expression Patterns of FD and FDP (A) VISTA plot generated from the pairwise alignment of the Arabidopsis thaliana FD and FDP loci. Sequence similarity (%) was calculated using a 100-bp sliding window; color indicates greater than 75% base identity. (B) In situ hybridizations performed on apices of plants grown for 3 weeks under SD (0 LD) and then transferred to LDs for 3, 5, or 7 days. Sections were hybridized with FD (left panels) or FDP (right panels) probes. White arrow: adaxial leaf tissue. Red arrow: boundary region. (C and E) Confocal analysis of dissected apices of pFD::VENUS:FD in fd-3 and pFDP-VENUS:FDP in fdp-2 grown for the indicated number of LDs. White arrow: adaxial leaf tissue. Red arrow: hypocotyl tissue. (D) Cross sections of 10-day-old hypocotyls (two top panels) and stems (two bottom panels) below the apical meristems of 30-day-old plants grown under LDs. VENUS signal is shown in red color. White arrows point to signal from a single cell, whereas yellow arrows point to signal coming from several cells. (E) Confocal images of seedlings of pFD::VENUS:FD and pFDP::VENUS:FDP 3DAS. Scale bars, 50 μm.
Figure 5
Figure 5
Genome-wide Target Sites of FD and FDP (A–E) FD genome-wide targets. (A) The number of FD ChIP-seq peaks and associated genes. (B) Distribution of FD peaks in a region between 3 kb upstream of the transcription start site (TSS) and 1 kb downstream of the transcription termination site (TTS) of the closest gene. The solid line shows the positional distribution of observed FD peaks. The observed positional distribution was compared to those of 1,000 randomly generated peak sets. As the distributions were determined using bins, both the mean (dashed line) and the 95% confidence interval (light shaded color) for each bin are depicted. (C) Density plot of distances between the center of the G-boxes and the center of FDP peaks. The red line marks the shape of the distribution. The inset shows the logo of the enriched sequence motif identified by MEME motif analysis. The E-value indicates the statistical significance of the identified motif. (D) Number of FD ChIP-seq peaks containing the indicated number of G-box motifs. (E) Distance between neighboring G-box motifs in FD targets. The red line marks the shape of the distribution. (F–J) FDP genome-wide targets. (F) Predicted number of FDP peaks and corresponding associated genes. (G) Distribution of FDP peaks as described for FD in (B). (H) Density plot of distances of G-boxes to the center of FDP peaks, as described for FD in (C). (I) Number of FD ChIP-seq peaks containing the indicated number of G-box motifs. (J) Distance between neighboring G-box motifs in FDP targets.
Figure 6
Figure 6
Characterization of FD and FDP Target Genes (A) Venn diagram illustrating common peaks (top panel) and genes (bottom panel) in the FD and FDP ChIP-seq datasets. (B) FD and FDP binding profiles to flowering genes. The three panels display FD and FDP and the control (INPUT) peaks at SOC1, LFY, and AP1 visualized with the Integrated Genome Browser (IGB). (C) qRT-PCR analysis of SOC1, LFY, and AP1 mRNA abundance in apices of fd-3 and fdp-CRP2 mutants in 11- and 15-day-old plants under LDs. (D) FDP-binding profiles to flowering genes when expressed from the 35S promoter. (E) Proportion of DEGs (adj. p ≤ 0.05) that are up- or downregulated in the RNA-seq of 17 LD apices of fd-3 and fdp-CRP2. The number of DEGs directly bound by FD or FDP is illustrated in digits. (F) GO terms enriched within the 109 genes differentially expressed and bound by FD using apices of 17-day-old plants. The color of the circles reflects the p value and the size the overrepresentation or underrepresentation of GO categories according a hypergeometric test (false discovery rate [FDR] < 0.05). The inset on the left shows an overview of all GO terms.
Figure 7
Figure 7
fd and fdp Are Less Sensitive to ABA in Greening Cotyledons (A) GO analysis of the biological processes enriched in the common 420 genes bound by FD and FDP, analyzed and presented as in Figure 6F. (B) Proportion of DEGs (adj. p ≤ 0.05) from the RNA-seq 3 DAS (of fd-3 and fdp-CRP2 mutants compared to WT), which are up- or downregulated, and within those, the subset of genes that are directly bound either by FD or FDP in inflorescences. (C) Venn diagram showing the overlap between the DEGs in 3 DAS whole seedlings of fd-3 and fdp-CRP2 shown in (B). (D) Venn diagram comparing the overlap of genes bound and regulated in fd-3 and fdp-CRP2 mutants in 3 DAS whole seedlings. (E) FD- and FDP-binding profiles to ABA-related genes. The three panels display FD and FDP and the control (INPUT) peaks at the shown loci visualized with the IGB browser. (F) Validation by ChIP-PCR of three common target genes involved in ABA responses. For each target, fold enrichment relative to its input is shown. Primers of TUBULIN (TUB) were used as negative controls. Data are shown as mean ± standard deviation. (G) Greening cotyledon assay. The diagram represents the percentage of greening cotyledons (y axis) 7 DAS on plates containing different concentrations of ABA (x axes). The error bars represent standard errors (SEs) of two independent biological replicates.

References

    1. Abe M., Kobayashi Y., Yamamoto S., Daimon Y., Yamaguchi A., Ikeda Y., Ichinoki H., Notaguchi M., Goto K., Araki T. FD, a bZIP protein mediating signals from the floral pathway integrator FT at the shoot apex. Science. 2005;309:1052–1056. - PubMed
    1. Abe M., Kosaka S., Shibuta M., Nagata K., Uemura T., Nakano A., Kaya H. Transient activity of the florigen complex during the floral transition in Arabidopsis thaliana. Development. 2019;146:dev171504. - PubMed
    1. Anders S., Pyl P.T., Huber W. HTSeq—a Python framework to work with high-throughput sequencing data. Bioinformatics. 2015;31:166–169. - PMC - PubMed
    1. Andrés F., Coupland G. The genetic basis of flowering responses to seasonal cues. Nat. Rev. Genet. 2012;13:627–639. - PubMed
    1. Bae S., Park J., Kim J.S. Cas-OFFinder: a fast and versatile algorithm that searches for potential off-target sites of Cas9 RNA-guided endonucleases. Bioinformatics. 2014;30:1473–1475. - PMC - PubMed

Publication types

MeSH terms

LinkOut - more resources