Randomized Controlled Trial
. 2020 Aug 1;105(8):e2941-e2959.
doi: 10.1210/clinem/dgaa345.

Moderate-Intensity Exercise and High-Intensity Interval Training Affect Insulin Sensitivity Similarly in Obese Adults

Affiliations
Randomized Controlled Trial

Moderate-Intensity Exercise and High-Intensity Interval Training Affect Insulin Sensitivity Similarly in Obese Adults

Benjamin J Ryan et al. J Clin Endocrinol Metab. .

Abstract

Objective: We compared the effects of high-intensity interval training (HIIT) and moderate-intensity continuous training (MICT) on insulin sensitivity and other important metabolic adaptations in adults with obesity.

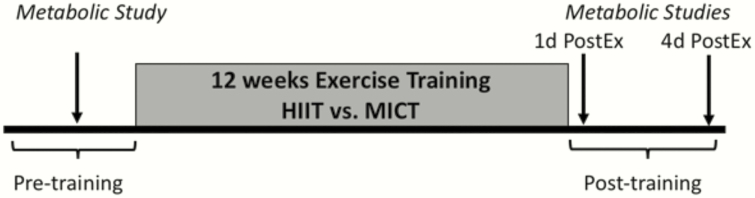
Methods: Thirty-one inactive adults with obesity (age: 31 ± 6 years; body mass index: 33 ± 3 kg/m2) completed 12 weeks (4 sessions/week) of either HIIT (10 × 1-minute at 90%HRmax, 1-minute active recovery; n = 16) or MICT (45 minutes at 70%HRmax; n = 15). To assess the direct effects of exercise independent of weight/fat loss, participants were required to maintain body mass.

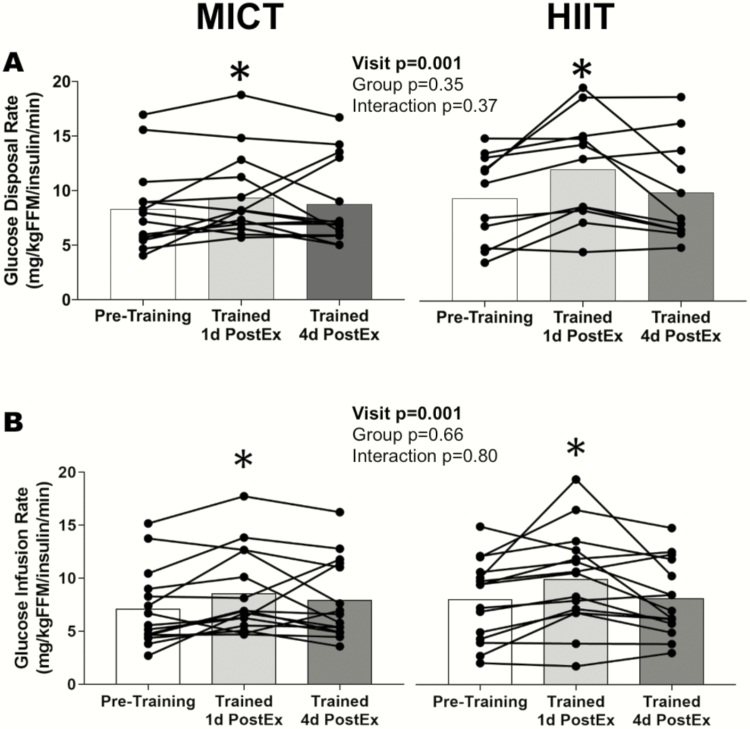
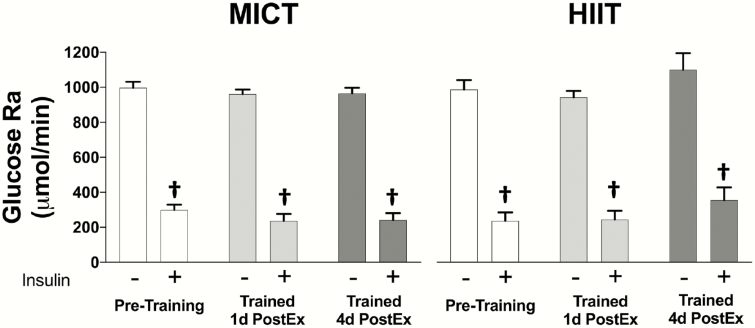
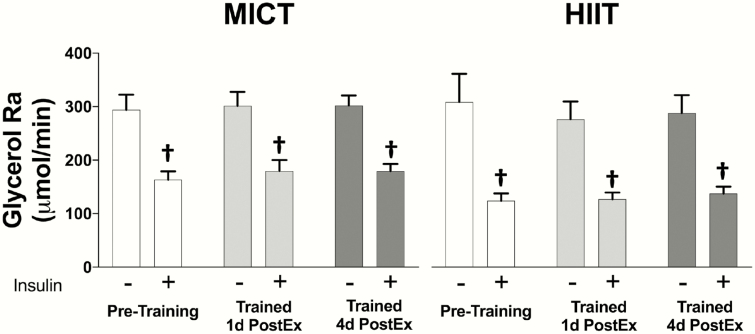
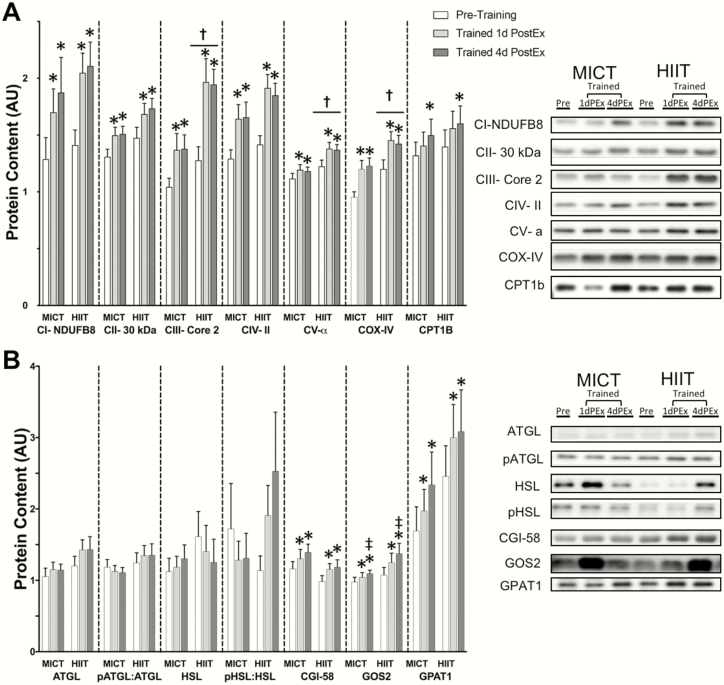
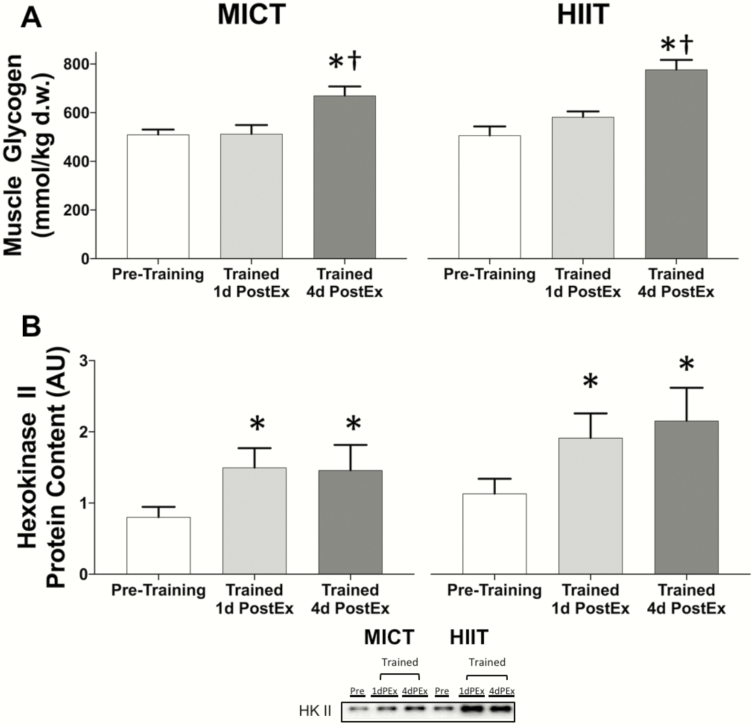
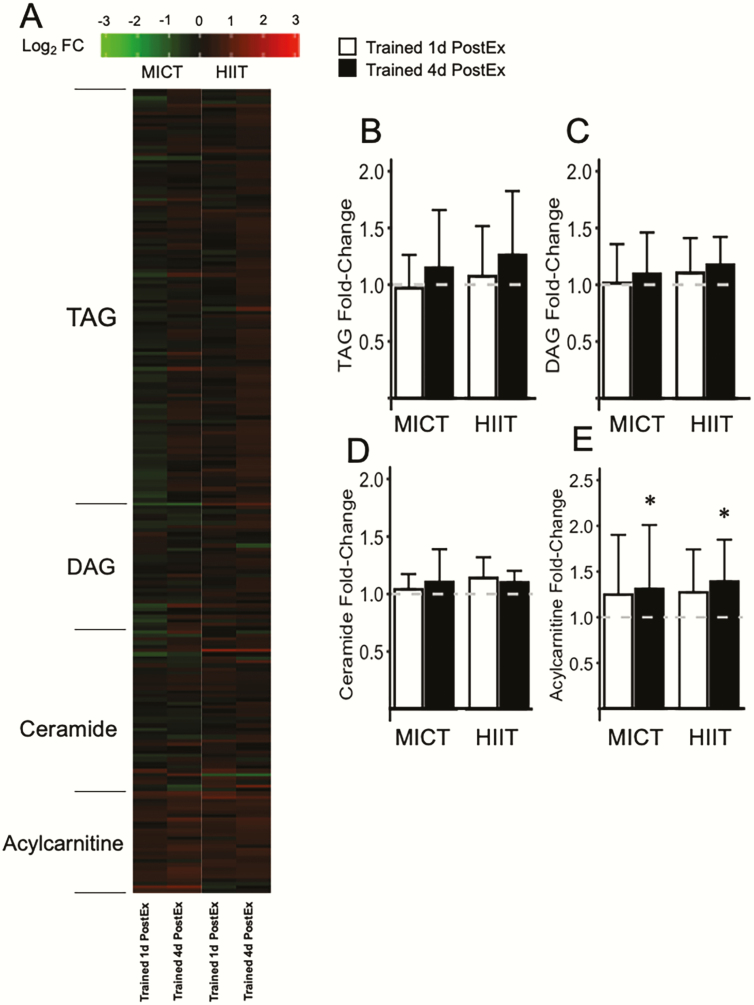
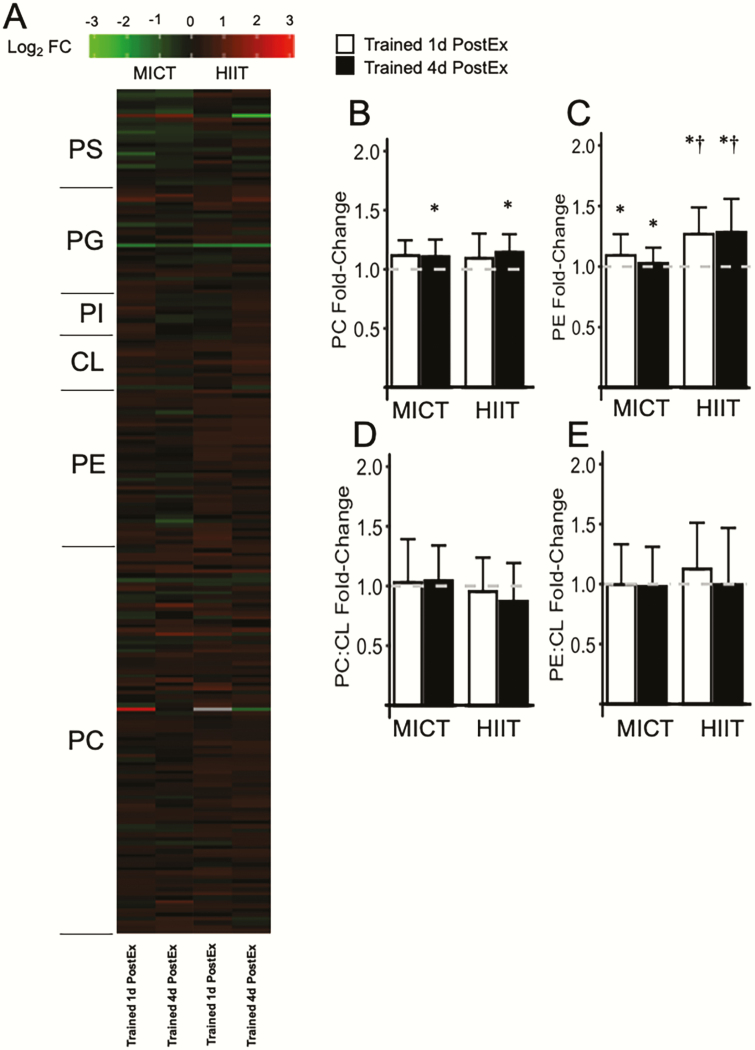
Results: Training increased peak oxygen uptake by ~10% in both HIIT and MICT (P < 0.0001), and body weight/fat mass were unchanged. Peripheral insulin sensitivity (hyperinsulinemic-euglycemic clamp) was ~20% greater the day after the final exercise session compared to pretraining (P < 0.01), with no difference between HIIT and MICT. When trained participants abstained from exercise for 4 days, insulin sensitivity returned to pretraining levels in both groups. HIIT and MICT also induced similar increases in abundance of many skeletal muscle proteins involved in mitochondrial respiration and lipid and carbohydrate metabolism. Training-induced alterations in muscle lipid profile were also similar between groups.

Conclusion: Despite large differences in training intensity and exercise time, 12 weeks of HIIT and MICT induce similar acute improvements in peripheral insulin sensitivity the day after exercise, and similar longer term metabolic adaptations in skeletal muscle in adults with obesity. These findings support the notion that the insulin-sensitizing effects of both HIIT and MICT are mediated by factors stemming from the most recent exercise session(s) rather than adaptations that accrue with training.

Trial registration: ClinicalTrials.gov NCT02706093.

Keywords: Insulin resistance; exercise training; high-intensity interval training; skeletal muscle.


Figures

Figure 1.
Figure 1.
Overview of study design. All participants completed their final exercise session at 1800 hours the night preceding the 1d postEx metabolic study.
Figure 2.
Figure 2.
Peripheral insulin sensitivity in response to training. (A) Rate of glucose disposal normalized to fat-free mass and insulin concentration during the hyperinsulinemic-euglycemic clamp (MICT n = 14, HIIT n = 11). (B) M-value: rate of exogenous glucose infusion normalized to fat-free mass and insulin concentration during the hyperinsulinemic-euglycemic clamp (MICT n = 15, HIIT n = 15). *Significant main effect for visit. Post hoc analysis identified trained 1d postEx was significantly greater than pretraining and trained 4d postEx (P < 0.05). The group means are indicated by bars and individual subjects’ data are connected by lines. HIIT, high-intensity interval training; MICT, moderate-intensity continuous training.
Figure 3.
Figure 3.
Hepatic glucose production in response to training. Glucose rate of appearance in the systemic circulation under fasting and insulin-stimulated conditions (MICT n = 14, HIIT n = 10). †Significant main effect of insulin (P < 0.05). There were no significant main effects of group or visit, and no significant interactions. Data are presented as mean ± SEM. HIIT, high-intensity interval training; MICT, moderate-intensity continuous training.
Figure 4.
Figure 4.
Whole-body lipolytic rate in response to training. Glycerol rate of appearance in the systemic circulation under fasting and insulin-stimulated conditions (MICT n = 14, HIIT n = 12). †Significant main effect of insulin (P < 0.05). There were no significant main effects of group or visit, and no significant interactions. Data are presented as mean ± SEM. HIIT, high-intensity interval training; MICT, moderate-intensity continuous training.
Figure 5.
Figure 5.
Skeletal muscle protein adaptations in response to training. (A) Protein abundance of mitochondrial proteins. (B) Protein abundance of proteins related to lipolysis and esterification. Sample sizes were MICT n = 14 and HIIT n = 16. *Significant main effect of visit, with post hoc tests identifying a significant difference compared with pretraining (P < 0.05). ‡Significant main effect of visit, with post hoc tests identifying significant difference compared with trained 1d postEx (P < 0.05). †Significant main effect of group (P < 0.05). There were no significant group × visit interactions. Data are presented as mean ± SEM. In the representative blots, “PEx” refers to postexercise. HIIT, high-intensity interval training; MICT, moderate-intensity continuous training.
Figure 6.
Figure 6.
Skeletal muscle glycogen content and hexokinase II protein abundance in response to training. (A) Muscle glycogen content (mmol per kilogram dry tissue weight). (B) Relative protein abundance of hexokinase II. Sample sizes were MICT n = 14 and HIIT n = 16. *Significant main effect of visit, with post hoc tests identifying a significant difference compared with pretraining (P < 0.05). †Significant main effect of visit, with post hoc tests identifying a significant difference compared with trained 1d postEx (P < 0.05). There were no significant main effects of group and no significant group × visit interactions. Data are presented as mean ± SEM. In the representative blots, “PEx” refers to postexercise. HIIT, high-intensity interval training; MICT, moderate-intensity continuous training.
Figure 7.
Figure 7.
Skeletal muscle triacylglycerol, diacylglycerol, ceramide, and acylcarnitine abundance in response to training. (A) Heatmap displaying log2 fold-change (log2 FC) relative to pretraining for individual triacylglycerol (TAG), diacylglycerol (DAG), ceramide, and acylcarnitine species. (B-E) Relative abundance of total TAG, DAG, ceramide, and acylcarnitine normalized to pretraining. The pretraining level is indicated by the dashed line at 1.0. *Significant main effect of visit compared with pretraining (P < 0.05). There were no significant main effects of group and no significant group × visit interactions. Data are presented as mean ± SD (MICT n = 9, HIIT n = 8). HIIT, high-intensity interval training; MICT, moderate-intensity continuous training.
Figure 8.
Figure 8.
Skeletal muscle phospholipid abundance in response to training. (A) Heatmap displaying log2 fold-change (log2 FC) relative to pretraining, for individual phospholipid species; phosphatidylserine (PS), phosphatidylglycerol (PG), phosphatidylinositol (PI), cardiolipin (CL), phosphatidylethanolamine (PE), and phosphatidylcholine (PC). (B-C) Relative abundance of total PC and PE normalized to pretraining. The pretraining level is indicated by the dashed line at 1.0. (D-E) Total PC and PE abundance expressed relative to total CL and normalized to pretraining. The pretraining ratio is indicated by the dashed line at 1.0. *Significant main effect of visit compared with pretraining (P < 0.05). †Significant group × visit interaction, with a larger increase compared with pretraining in HIIT versus MICT (P < 0.05). Data are presented as mean ± SD (MICT n = 9, HIIT n = 8). HIIT, high-intensity interval training; MICT, moderate-intensity continuous training.

Comment in

References

    1. Garber CE, Blissmer B, Deschenes MR, et al. ; American College of Sports Medicine American College of Sports Medicine position stand. Quantity and quality of exercise for developing and maintaining cardiorespiratory, musculoskeletal, and neuromotor fitness in apparently healthy adults: guidance for prescribing exercise. Med Sci Sports Exerc. 2011;43(7):1334-1359. - PubMed
    1. Bray GA, Frühbeck G, Ryan DH, Wilding JP. Management of obesity. Lancet. 2016;387(10031):1947-1956. - PubMed
    1. Colberg SR, Sigal RJ, Yardley JE, et al. . Physical activity/exercise and diabetes: a position statement of the American Diabetes Association. Diabetes Care. 2016;39:2065-2079. - PMC - PubMed
    1. Pedersen BK, Saltin B. Exercise as medicine - evidence for prescribing exercise as therapy in 26 different chronic diseases. Scand J Med Sci Sports. 2015;25Suppl 3:1-72. - PubMed
    1. Magkos F, Fraterrigo G, Yoshino J, et al. . Effects of moderate and subsequent progressive weight loss on metabolic function and adipose tissue biology in humans with obesity. Cell Metab. 2016;23(4):591-601. - PMC - PubMed

Publication types

Associated data