

Spatio-temporal distribution and associated factors of home delivery in Ethiopia. Further multilevel and spatial analysis of Ethiopian demographic and health surveys 2005-2016
- PMID: 32493302
- PMCID: PMC7268646
- DOI: 10.1186/s12884-020-02986-w
Spatio-temporal distribution and associated factors of home delivery in Ethiopia. Further multilevel and spatial analysis of Ethiopian demographic and health surveys 2005-2016
Abstract
Background: Globally, between 2012 and 2017, 80% of live births occurred at health facilities assisted by skilled health personnel. In Ethiopia, in 2016 only 26% of live births attended by skilled health personal. This study aimed to assess the spatial patterns and associated factors of home delivery in Ethiopia using 2005, 2011, and 2016 Ethiopian Demographic and Health Surveys.
Methods: A total of 33,482 women who gave live birth in the 5 years preceding each survey were included for this study. ArcGIS version 10.7 software was used to visualize the spatial distribution of home delivery. The Bernoulli model was applied using Kilduff SaTScan version 9.6 software to identify significant purely spatial clusters for home delivery in Ethiopia. A multilevel logistic regression model was fitted to identify factors associated with home delivery. A p-value < 0.05 was taken to declare statistically significant predictors.
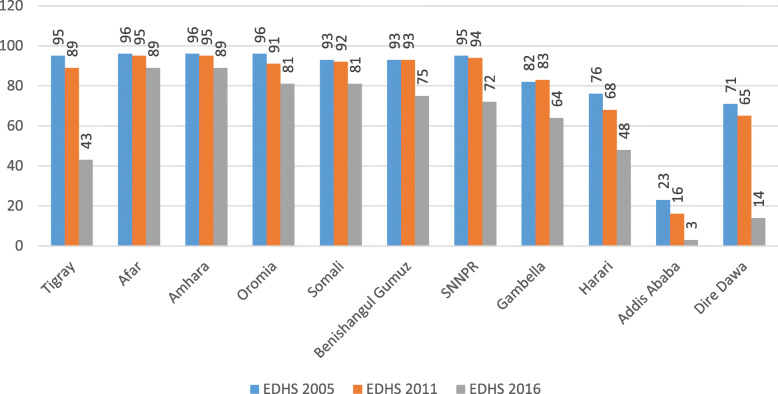
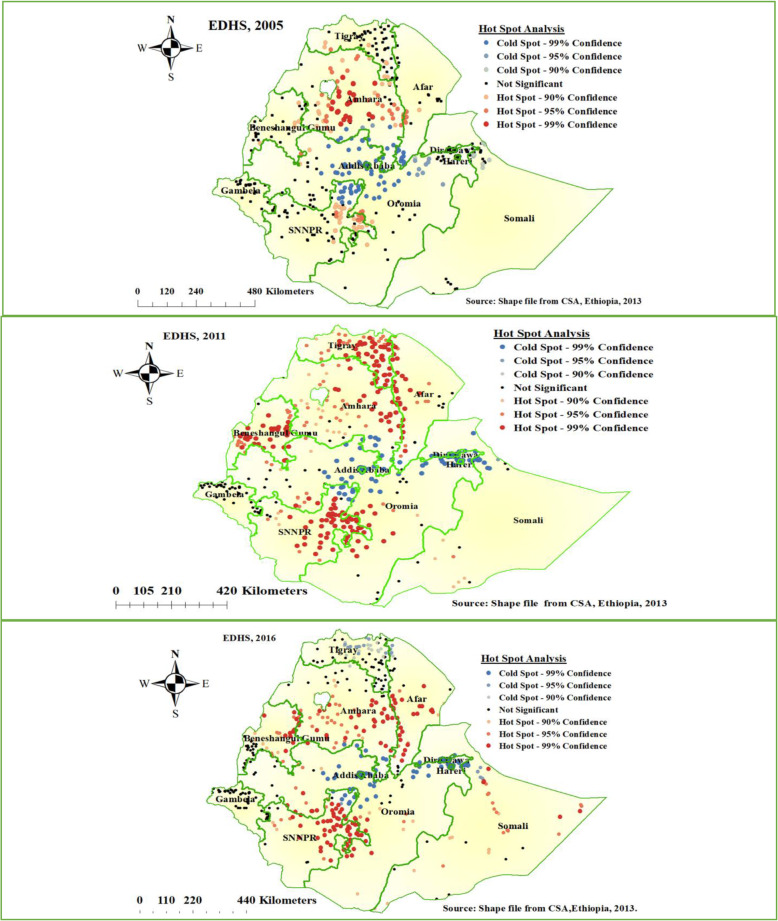
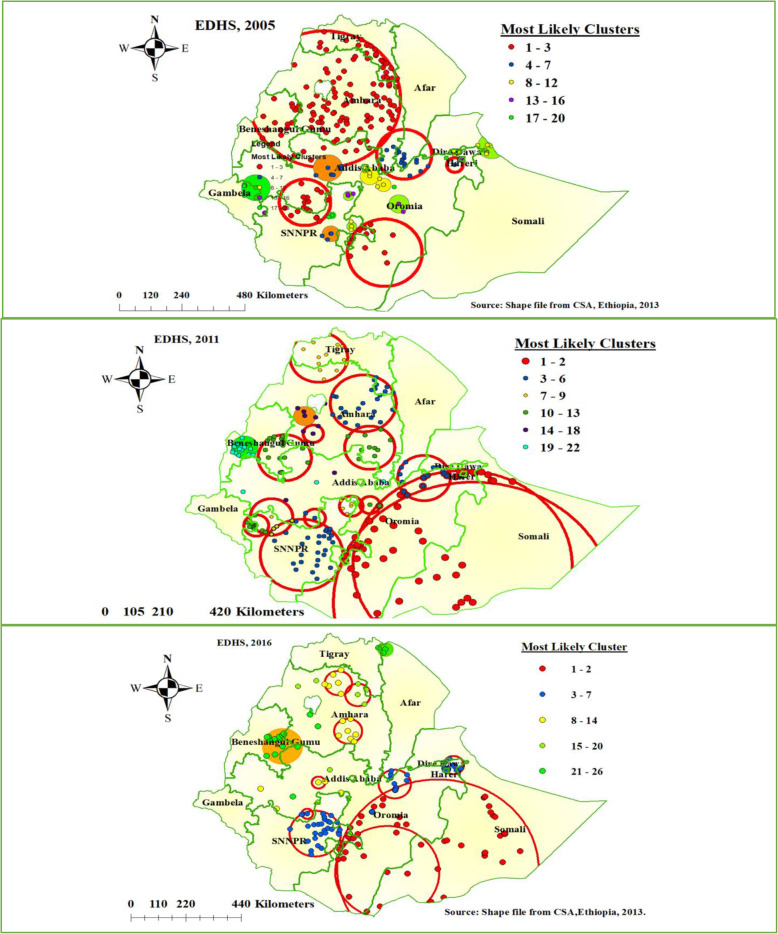
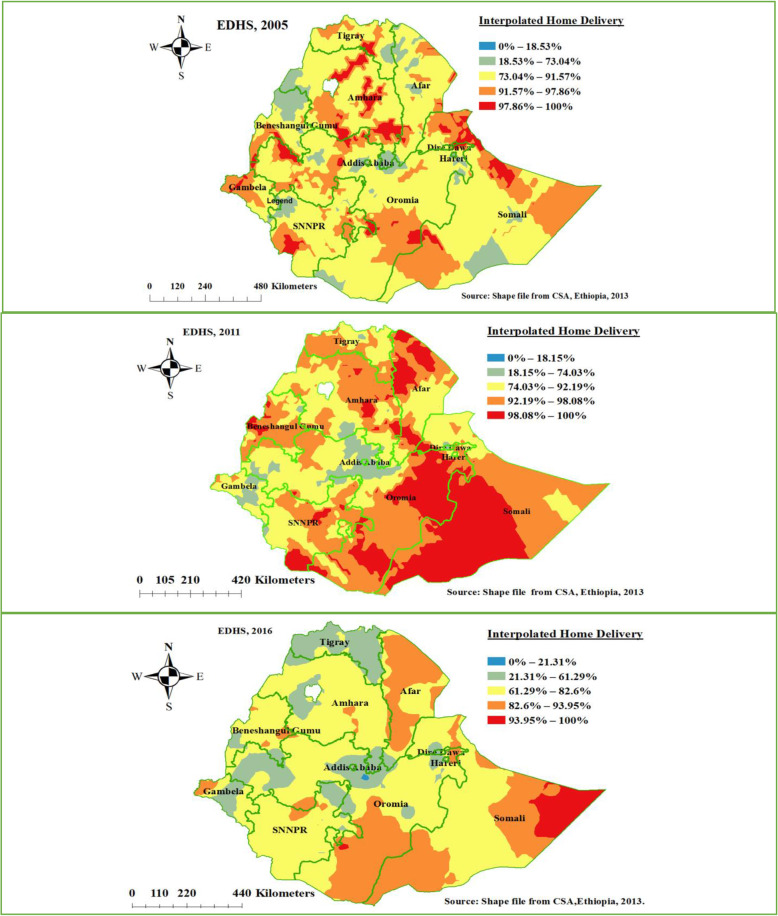
Results: Home delivery was declined from 94.78% in 2005, 90.05% in 2011, and 73.44% in 2016 in Ethiopia. Among the three surveys, consistently high clustering of home delivery was observed in Amhara and Southern Nations Nationalities and People's Regions (SNNPR) of Ethiopia. In spatial scan statistics analysis, a total of 128 clusters (RR = 1.04, P-value < 0.001) in 2005, and 90 clusters (RR = 1.11, P-value < 0.001) in 2011, and 55 clusters (RR = 1.29, P-value < 0.001) in 2016 significant primary clusters were identified. Educational status of women and husband, religion, distance to the health facility, mobile access, antenatal care visit, birth order, parity, wealth index, residence, and Region were statistically significant predictors of home delivery.
Conclusion: The spatial distribution of home delivery among the three consecutive surveys were non-random in Ethiopia. Educational status of women and husband, religion, distance to the health facility, wealth index, residence, parity, mobile access, Region, and antenatal care visit were statistically significant predictors of home delivery in Ethiopia. Therefore, an intervention needs to improve the coverage of antenatal care visit, and health care facilities. Ministry of health and other stakeholders should give special attention to women living in Amhara and SNNPR states of Ethiopia.
Keywords: EDHS; Ethiopia; Home delivery; Spatial distribution.
Conflict of interest statement
The authors declare that they have no competing interests.
Figures
Similar articles
-
Spatial clustering and determinants of home birth after at least one antenatal care visit in Ethiopia: Ethiopian demographic and health survey 2016 perspective.BMC Pregnancy Childbirth. 2020 Feb 11;20(1):97. doi: 10.1186/s12884-020-2793-6. BMC Pregnancy Childbirth. 2020. PMID: 32046677 Free PMC article.
-
Individual and community-level determinants, and spatial distribution of institutional delivery in Ethiopia, 2016: Spatial and multilevel analysis.PLoS One. 2020 Nov 12;15(11):e0242242. doi: 10.1371/journal.pone.0242242. eCollection 2020. PLoS One. 2020. PMID: 33180845 Free PMC article.
-
Spatial variations of women's home delivery after antenatal care visits at lay Gayint District, Northwest Ethiopia.BMC Public Health. 2019 Jun 3;19(1):677. doi: 10.1186/s12889-019-7050-4. BMC Public Health. 2019. PMID: 31159775 Free PMC article.
-
The effect of antenatal care on use of institutional delivery service and postnatal care in Ethiopia: a systematic review and meta-analysis.BMC Health Serv Res. 2018 Jul 24;18(1):577. doi: 10.1186/s12913-018-3370-9. BMC Health Serv Res. 2018. PMID: 30041655 Free PMC article.
-
The effect of lack of ANC visit and unwanted pregnancy on home child-birth in Ethiopia: a systematic review and meta-analysis.Sci Rep. 2022 Jan 27;12(1):1490. doi: 10.1038/s41598-022-05260-5. Sci Rep. 2022. PMID: 35087152 Free PMC article.
Cited by
-
Antenatal care booked rural residence women have home delivery during the era of COVID-19 pandemic in Gidan District, Ethiopia.PLoS One. 2023 Dec 5;18(12):e0295220. doi: 10.1371/journal.pone.0295220. eCollection 2023. PLoS One. 2023. PMID: 38051747 Free PMC article.
-
Spatial variation and determinant of home delivery in Ethiopia: Spatial and mixed effect multilevel analysis based on the Ethiopian mini demographic and health survey 2019.PLoS One. 2022 Mar 11;17(3):e0264824. doi: 10.1371/journal.pone.0264824. eCollection 2022. PLoS One. 2022. PMID: 35275944 Free PMC article.
-
How applicable is geospatial analysis in maternal and neonatal health in sub-Saharan Africa? A systematic review.J Glob Health. 2022 Aug 9;12:04066. doi: 10.7189/jogh.12.04066. J Glob Health. 2022. PMID: 35939400 Free PMC article.
-
Magnitude, Trends, and Determinants of Institutional Delivery Among Reproductive Age Women in Kersa Health and Demographic Surveillance System Site, Eastern Ethiopia: A Multilevel Analysis.Front Glob Womens Health. 2022 Feb 28;3:821858. doi: 10.3389/fgwh.2022.821858. eCollection 2022. Front Glob Womens Health. 2022. PMID: 35295677 Free PMC article.
-
Spatial distribution and associated factors' of early marriage among reproductive age women in Ethiopia: a secondary data analysis of Ethiopian Demographic and Health Survey 2016.BMC Womens Health. 2020 Dec 7;20(1):268. doi: 10.1186/s12905-020-01103-5. BMC Womens Health. 2020. PMID: 33287819 Free PMC article.
References
-
- United Nation . Transforming our world: the 2030 agenda for sustainable development. 2016. pp. 12–14.
-
- WHO. UNICEF U and the WB . Trends in Maternal Mortality: 1990 to 2015, trends in maternal mortality: 1990 to 2015. Geneva: WHO; 2015.
-
- WHO. UNICEF. UNFPA WBG. the UNPD . Trends in maternal mortality : 2000 to 2017. Geneva: WHO, UNICEF, UNFPA, World Bank Gr United Nations Popul Div; 2019.
-
- WHO . Trends in maternal mortality 1990 to 2015. Estimates developed by WHO, UNICEF, UNFPA, and The World Bank. 2015. p. 96.
MeSH terms
LinkOut - more resources
Full Text Sources
Medical
