

An integrative phylogenomic approach to elucidate the evolutionary history and divergence times of Neuropterida (Insecta: Holometabola)
- PMID: 32493355
- PMCID: PMC7268685
- DOI: 10.1186/s12862-020-01631-6
An integrative phylogenomic approach to elucidate the evolutionary history and divergence times of Neuropterida (Insecta: Holometabola)
Erratum in
-
Correction to: An integrative phylogenomic approach to elucidate the evolutionary history and divergence times of Neuropterida (Insecta: Holometabola).BMC Evol Biol. 2020 Oct 15;20(1):133. doi: 10.1186/s12862-020-01695-4. BMC Evol Biol. 2020. PMID: 33059595 Free PMC article.
Abstract
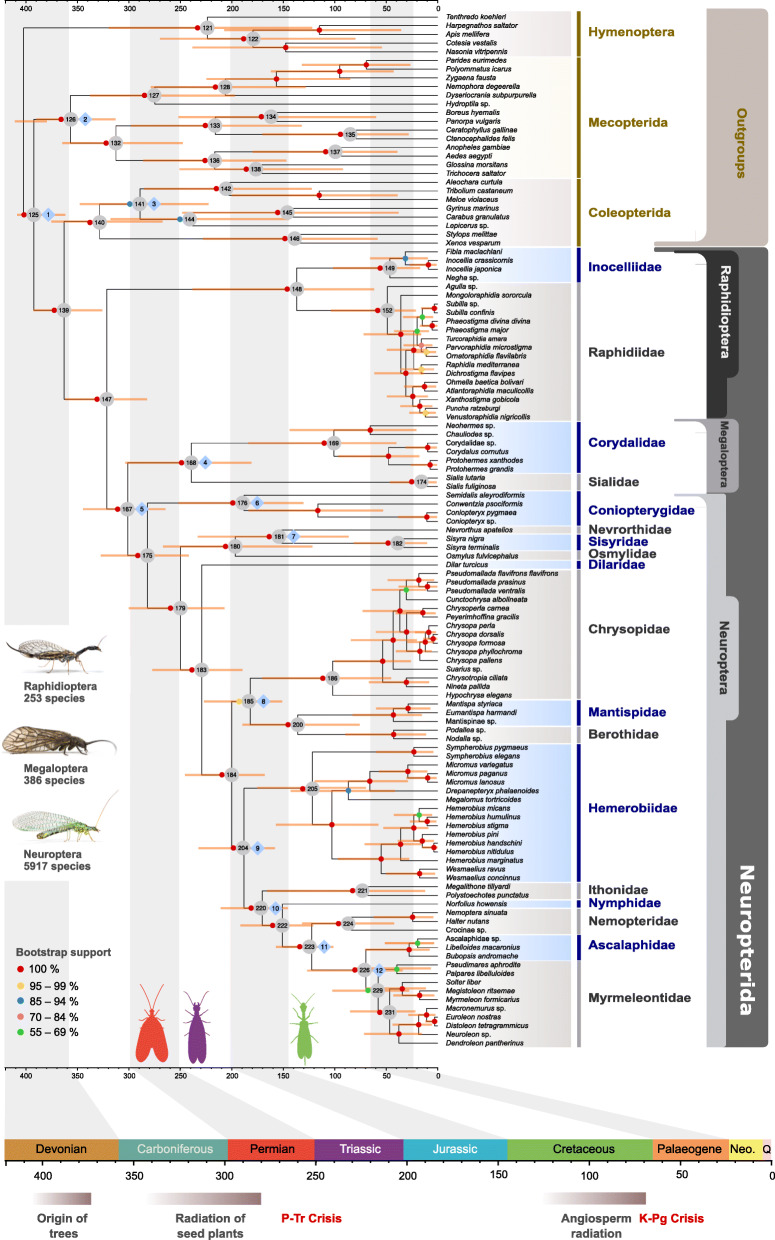
Background: The latest advancements in DNA sequencing technologies have facilitated the resolution of the phylogeny of insects, yet parts of the tree of Holometabola remain unresolved. The phylogeny of Neuropterida has been extensively studied, but no strong consensus exists concerning the phylogenetic relationships within the order Neuroptera. Here, we assembled a novel transcriptomic dataset to address previously unresolved issues in the phylogeny of Neuropterida and to infer divergence times within the group. We tested the robustness of our phylogenetic estimates by comparing summary coalescent and concatenation-based phylogenetic approaches and by employing different quartet-based measures of phylogenomic incongruence, combined with data permutations.
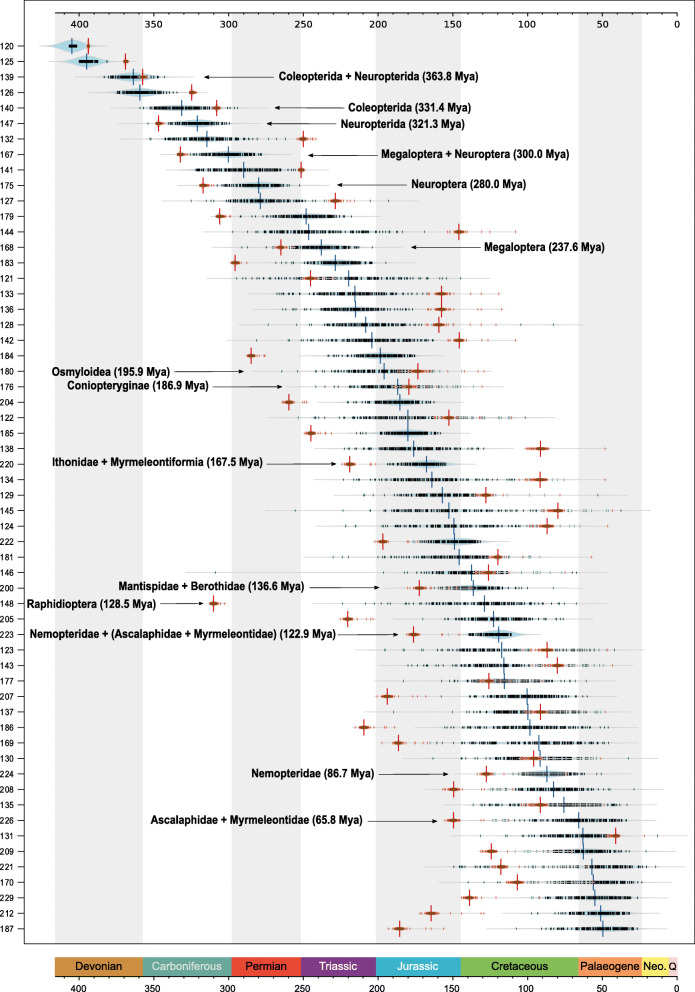
Results: Our results suggest that the order Raphidioptera is sister to Neuroptera + Megaloptera. Coniopterygidae is inferred as sister to all remaining neuropteran families suggesting that larval cryptonephry could be a ground plan feature of Neuroptera. A clade that includes Nevrorthidae, Osmylidae, and Sisyridae (i.e. Osmyloidea) is inferred as sister to all other Neuroptera except Coniopterygidae, and Dilaridae is placed as sister to all remaining neuropteran families. Ithonidae is inferred as the sister group of monophyletic Myrmeleontiformia. The phylogenetic affinities of Chrysopidae and Hemerobiidae were dependent on the data type analyzed, and quartet-based analyses showed only weak support for the placement of Hemerobiidae as sister to Ithonidae + Myrmeleontiformia. Our molecular dating analyses suggest that most families of Neuropterida started to diversify in the Jurassic and our ancestral character state reconstructions suggest a primarily terrestrial environment of the larvae of Neuropterida and Neuroptera.
Conclusion: Our extensive phylogenomic analyses consolidate several key aspects in the backbone phylogeny of Neuropterida, such as the basal placement of Coniopterygidae within Neuroptera and the monophyly of Osmyloidea. Furthermore, they provide new insights into the timing of diversification of Neuropterida. Despite the vast amount of analyzed molecular data, we found that certain nodes in the tree of Neuroptera are not robustly resolved. Therefore, we emphasize the importance of integrating the results of morphological analyses with those of sequence-based phylogenomics. We also suggest that comparative analyses of genomic meta-characters should be incorporated into future phylogenomic studies of Neuropterida.
Keywords: Endopterygota; Four-cluster likelihood mapping; Megaloptera; Multi-species coalescent; Neuroptera; RNA-seq; Raphidioptera; Supermatrices; Transcriptomics.
Conflict of interest statement
The authors declare that they have no competing interests.
Figures


References
-
- Oswald JD. LDL Neuropterida species of the world (version July 2018). Species 2000 & ITIS catalogue of life, 26th February 2019. 2019.
-
- Misof B, Liu S, Meusemann K, Peters RS, Donath A, Mayer C, et al. Phylogenomics resolves the timing and pattern of insect evolution. Science. 2014;346:763–767. - PubMed
-
- Aspöck U. Phylogeny of the Neuropterida (Insecta: Holometabola) Zool Scr. 2002;31:51–55.
Publication types
MeSH terms
Associated data
Grants and funding
LinkOut - more resources
Full Text Sources
Other Literature Sources
