. 2020 Jun 4;18(1):55.
doi: 10.1186/s12915-020-00785-5.

A tissue level atlas of the healthy human virome

Affiliations

A tissue level atlas of the healthy human virome

Ryuichi Kumata et al. BMC Biol. .

Abstract

Background: Human-resident microbes can influence both health and disease. Investigating the microbiome using next-generation sequencing technology has revealed examples of mutualism and conflict between microbes and humans. Comparing to bacteria, the viral component of the microbiome (i.e., the "virome") is understudied. Somatic tissues of healthy individuals are usually inaccessible for the virome sampling; therefore, there is limited understanding of the presence and distribution of viruses in tissues in healthy individuals and how virus infection associates with human gene expression and perturbs immunological homeostasis.

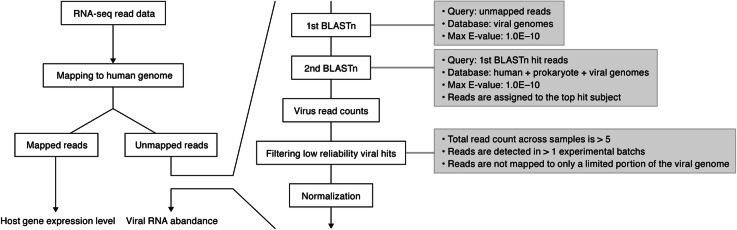
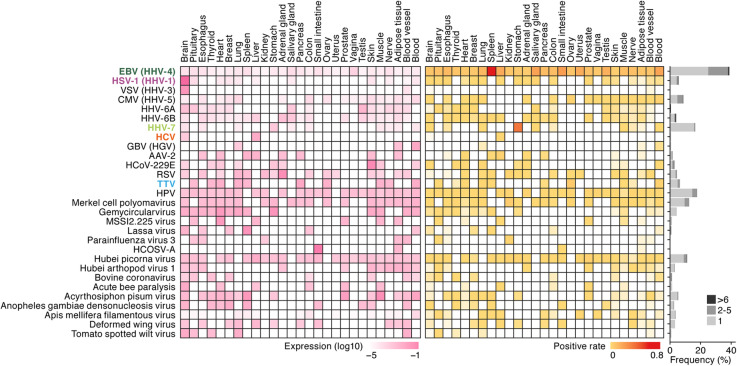
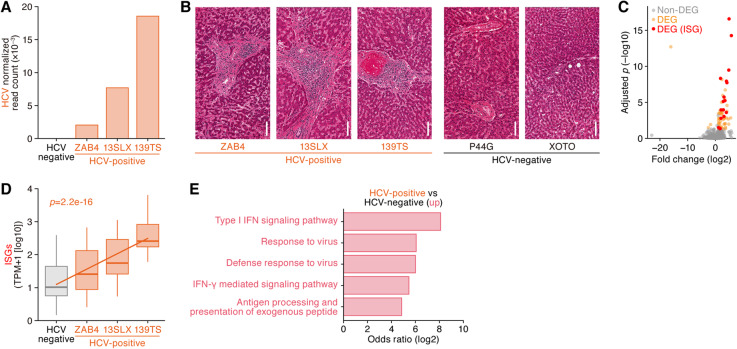
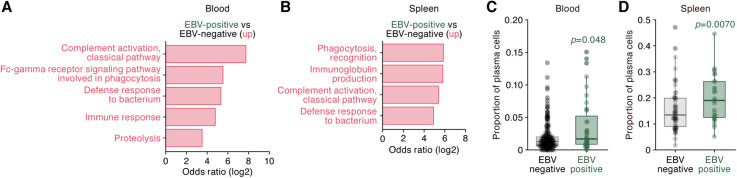
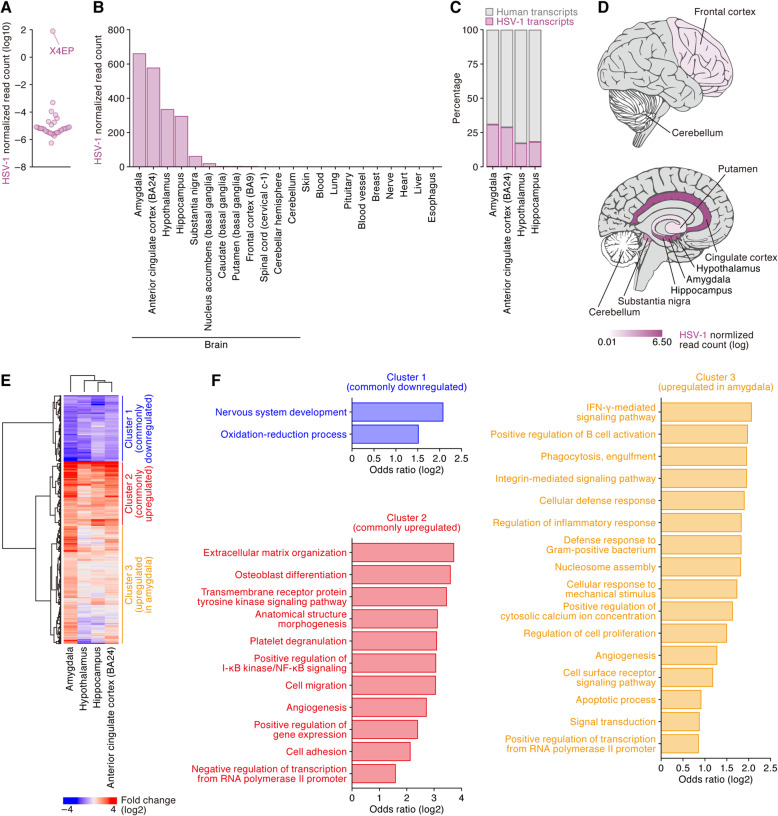
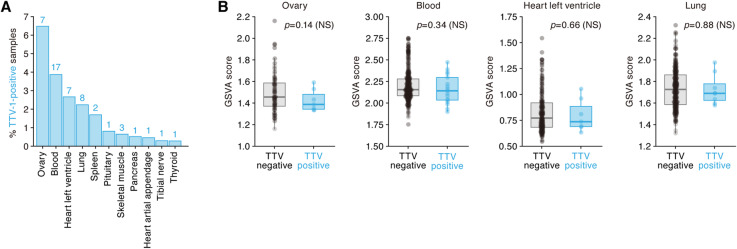
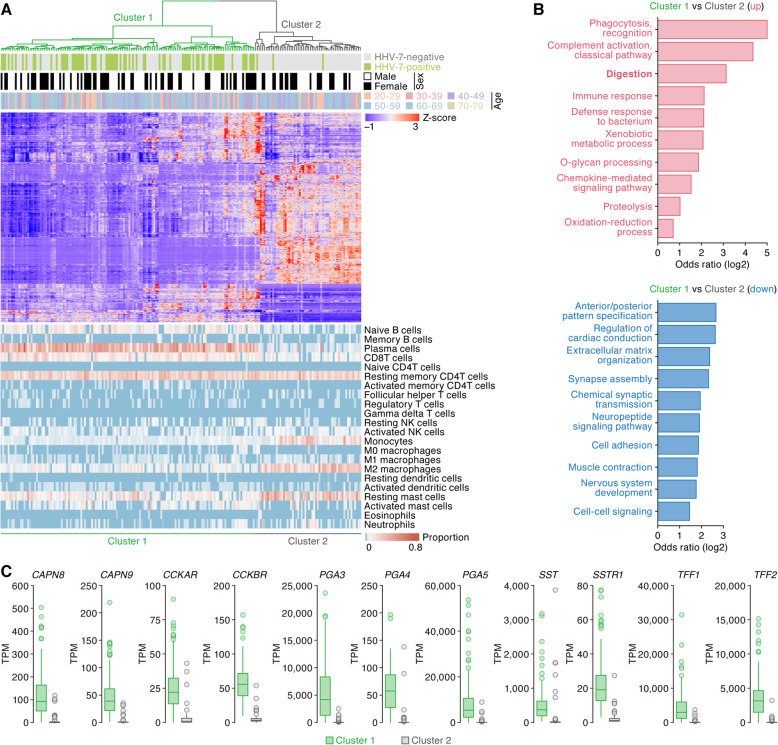
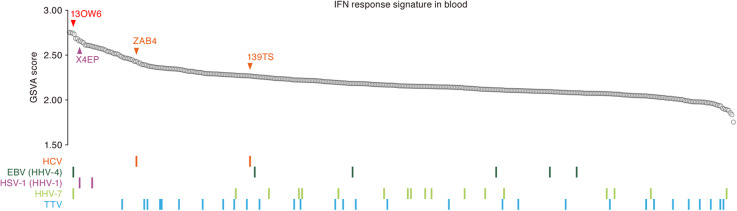
Results: To characterize the human virome in a tissue-specific manner, here we performed meta-transcriptomic analysis using the RNA-sequencing dataset from the Genotype-Tissue Expression (GTEx) Project. We analyzed the 8991 RNA-sequencing data obtained from 51 somatic tissues from 547 individuals and successfully detected 39 viral species in at least one tissue. We then investigated associations between virus infection and human gene expression and human disease onset. We detected some expected relationships; for instance, hepatitis C virus infection in the liver was strongly associated with interferon-stimulated gene upregulation and pathological findings of chronic hepatitis. The presence of herpes simplex virus type 1 in one subject's brain strongly associated with immune gene expression. While torque teno virus was detected in a broad range of human tissues, it was not associated with interferon responses. Being notable in light of its association with lymphoproliferative disorders, Epstein-Barr virus infection in the spleen and blood was associated with an increase in plasma cells in healthy subjects. Human herpesvirus 7 was often detected in the stomach; intriguingly, it associated with the proportion of human leukocytes in the stomach as well as digestive gene expression. Moreover, virus infections in the local tissues associated with systemic immune responses in circulating blood.

Conclusions: To our knowledge, this study is the first comprehensive investigation of the human virome in a variety of tissues in healthy individuals through meta-transcriptomic analysis. Further investigation of the associations described here, and application of this analytical pipeline to additional datasets, will be useful to reveal the impact of viral infections on human health.

Keywords: GTEx; Human gene expression; Human virome; Microbiome; Transcriptome.


Conflict of interest statement

The authors declare that they have no competing interests.

Figures

Fig. 1
Fig. 1
Workflow of this study. Flow diagrams of the meta-transcriptomic analysis pipeline constructed in this study. A detailed description is provided in the “Methods” section
Fig. 2
Fig. 2
Landscape of the healthy human virome. The viruses detected in the GTEx dataset are summarized. The results of various subtypes of TTVs, HPVs, and Hubei picornaviruses detected were unified. The viruses for further investigations in Figs. 3, 4, 5, 6, and 7 (EBV, HSV-1, HHV-7, HCV, and TTV) are indicated in bold and colored. The alternative name of each virus is indicated in parentheses. (Left) The level of the transcript of each virus in each human tissue. The averages in the positive samples are shown as a heatmap. (Middle) The positive rate for each virus in each human tissue. (Right) The frequency of the individuals positive for respective viruses is summarized in bar graphs. The numbers of tissues positive for the respective viruses (1, 2–5, or more than 6) are also shown. AAV, adeno-associated virus; HCoV, human coronavirus; RSV, respiratory syncytial virus
Fig. 3
Fig. 3
HCV in the livers with chronic hepatitis. a Detection of three individuals positive for HCV transcripts in the liver. The normalized read counts of HCV in the respective samples (sample IDs: ZAB4, 13SLX, and 139TS) are shown. b Histological observations in the liver of the three HCV-positive individuals. The photos of hematoxylin and eosin staining are provided from the GTEx dataset [29]. Two HCV-negative livers (sample IDs: P44G and XOTO) are shown as the negative controls. c Differential expression of genes between HCV-positive and HCV-negative livers. The X-axis indicates the fold change score, and the Y-axis indicates the statistical score. The positive and negative fold change scores indicate the up- and downregulations in the HCV-positive livers, respectively. The DEGs are indicated in pink dots, and ISGs are indicated in red with each gene symbol. d Expression levels of the upregulated ISGs in the three HCV-positive livers. Statistical significance was evaluated by linear regression test. e GO enrichment analysis of the upregulated genes in HCV-positive livers. The statistical summary of distribution is shown as a box plot. The terms with statistical significance (FDR < 0.05) are shown
Fig. 4
Fig. 4
EBV in blood and spleen. a, b GO enrichment analysis of the upregulated genes in EBV-positive samples in blood (a) and spleen (b). The terms with statistical significance (FDR < 0.05) are shown. c, d Increase in the proportion of plasma cells in EBV-positive samples. The results of deconvolution analysis in the blood (c) and spleen (d) are shown. Each dot indicates the result from respective samples, and the statistical summary of distribution is shown as a box plot. Statistical significance was evaluated by Welch’s t test. See also Additional file 8: Figure S3 and Additional file 9: Figure S4
Fig. 5
Fig. 5
HSV-1 in the brain of an individual. a Detection of an individual (sample ID: X4EP) with severe HSV-1 infection. Each dot indicates the normalized read count of HSV-1 in each individual (n = 32). Note that HSV-1 reads were undetectable in 515 individuals. b HSV-1 transcript abundance across tissues in the individual (sample ID: X4EP). The normalized read counts of HSV-1 are shown. Only the brain was subdivided into each region. BA, Brodmann’s area. c Proportion of HSV-1 reads in the total assigned reads. The percentages in the respective brain regions of the individual (sample ID: X4EP) are shown. d Anatomical distribution of HSV-1 transcripts in the brain. The normalized expression levels of HSV-1 in the respective brain regions of the individual (sample ID: X4EP) are shown as a brain-shaped heatmap. The regions without RNA-Seq data are shown in gray. e Differential gene expression in the brain. DESeq2 was used for feature selection of genes toward downstream analyses. The heatmap contains 1242 DEGs (X4EP sample versus other samples) that were detected in any of the four brain regions (amygdala, hypothalamus, hippocampus, and anterior cingulate cortex). The DEGs were classified into three clusters: cluster 1 (blue), cluster 2 (red), and cluster 3 (orange), mainly consisting of commonly downregulated genes, commonly upregulated genes, and the genes upregulated specifically in the amygdala, respectively. f GO enrichment analysis of the three gene clusters. The terms with statistical significance (FDR < 0.05) are shown
Fig. 6
Fig. 6
TTV in a variety of tissues in multiple individuals. a Percentages of the samples positive for TTV in each tissue. The numbers on the bar graphs indicate the number of samples positive for TTV. b The gene set-level expression score (GSVA score) of ISGs in the four tissues of TTV-positive and TTV-negative samples. Each dot indicates the score of each sample. Statistical significance is evaluated by Welch’s t test. NS, no statistical significance
Fig. 7
Fig. 7
Potential effect of HHV-7 infection on human gene expression in the stomach. a Association of the human gene expression pattern with HHV-7 infection in the stomach. Stomach samples (n = 203) were classified into the two clusters based on the 1000 most highly expressed human genes. (Top) The relative expression levels of human genes are shown as a heatmap. (Middle) Distribution of the samples positive for HHV-7 (n = 78). Note that HHV-7-positive samples accumulated in cluster 1. (Bottom) Deconvolution analysis of human leukocytes residing in the stomach. The proportions of the respective human leukocytes are shown as a heatmap. b GO enrichment analysis of the DEGs between clusters 1 and 2. The top 10 terms significantly upregulated (top) and downregulated (bottom) in cluster 1 compared to those in cluster 2 are shown. c Differential expression of the genes associated with the digestion process. The expression levels of 11 genes associated with the digestion process (CAPN8, CAPN9, CCKAR, CCKBR, PGA3-5, SST, SSTR1, TFF1, and TFF2) in clusters 1 and 2 are shown as TPM
Fig. 8
Fig. 8
Effect of virus infections on IFN responses in body-circulating blood. (Top) The gene set-level expression score (GSVA score) of ISGs in the blood. The colored arrows with sample IDs indicate the positions of the samples positive for HCV (orange) and HSV-1 (purple). The sample positive for both EBV and HHV-7 (sample ID: 13OW6) is indicated by a red arrow. (Bottom) Individuals positive for respective viruses. “Positive” means that the virus abundance is more than the upper quartile

Comment in

References

    1. Breitbart M, Salamon P, Andresen B, Mahaffy JM, Segall AM, Mead D, Azam F, Rohwer F. Genomic analysis of uncultured marine viral communities. Proc Natl Acad Sci U S A. 2002;99(22):14250–14255. - PMC - PubMed
    1. Gregory AC, Zayed AA, Conceicao-Neto N, Temperton B, Bolduc B, Alberti A, Ardyna M, Arkhipova K, Carmichael M, Cruaud C, et al. Marine DNA viral macro- and microdiversity from pole to pole. Cell. 2019;177(5):1109–1123. - PMC - PubMed
    1. Roux S, Brum JR, Dutilh BE, Sunagawa S, Duhaime MB, Loy A, Poulos BT, Solonenko N, Lara E, Poulain J, et al. Ecogenomics and potential biogeochemical impacts of globally abundant ocean viruses. Nature. 2016;537(7622):689–693. - PubMed
    1. Venter JC, Remington K, Heidelberg JF, Halpern AL, Rusch D, Eisen JA, Wu D, Paulsen I, Nelson KE, Nelson W, et al. Environmental genome shotgun sequencing of the Sargasso Sea. Science. 2004;304(5667):66–74. - PubMed
    1. Jin M, Guo X, Zhang R, Qu W, Gao B, Zeng R. Diversities and potential biogeochemical impacts of mangrove soil viruses. Microbiome. 2019;7(1):58. - PMC - PubMed

LinkOut - more resources