. 2020 Jun 3;17(1):69.
doi: 10.1186/s12984-020-00698-y.

Augmenting propulsion demands during split-belt walking increases locomotor adaptation of asymmetric step lengths

Affiliations

Augmenting propulsion demands during split-belt walking increases locomotor adaptation of asymmetric step lengths

Carly J Sombric et al. J Neuroeng Rehabil. .

Abstract

Background: Promising studies have shown that the gait symmetry of individuals with hemiparesis due to brain lesions, such as stroke, can improve through motor adaptation protocols forcing patients to use their affected limb more. However, little is known about how to facilitate this process. Here we asked if increasing propulsion demands during split-belt walking (i.e., legs moving at different speeds) leads to more motor adaptation and more symmetric gait in survivors of a stroke, as we previously observed in subjects without neurological disorders.

Methods: We investigated the effect of propulsion forces on locomotor adaptation during and after split-belt walking in the asymmetric motor system post-stroke. To test this, 12 subjects in the chronic phase post-stroke experienced a split-belt protocol in a flat and incline session so as to contrast the effects of two different propulsion demands. Step length asymmetry and propulsion forces were used to compare the motor behavior between the two sessions because these are clinically relevant measures that are altered by split-belt walking.

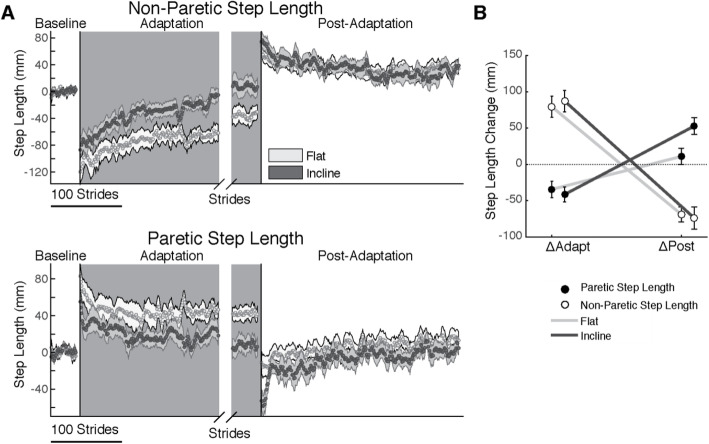
Results: The incline session resulted in more symmetric step lengths during late split-belt walking and larger after-effects following split-belt walking. In both testing sessions, subjects who have had a stroke adapted to regain speed and slope-specific leg orientations similarly to young, intact adults. Importantly, leg orientations, which were set by kinetic demands, during baseline walking were predictive of those achieved during split-belt walking, which in turn predicted each individual's post-adaptation behavior. These results are relevant because they provide evidence that survivors of a stroke can generate the leg-specific forces to walk more symmetrically, but also because we provide insight into factors underlying the therapeutic effect of split-belt walking.

Conclusions: Individuals post-stroke at a chronic stage can adapt more during split-belt walking and have greater after-effects when propulsion demands are augmented by inclining the treadmill surface. Our results are promising since they suggest that increasing propulsion demands during paradigms that force patients to use their paretic side more could correct gait asymmetries post-stroke more effectively.

Keywords: Hemiparesis; Motor learning; Stroke.


Conflict of interest statement

The authors declare that they have no competing interests.

Figures

Fig. 1
Fig. 1
Experimental Paradigm and Kinetic and Kinematic Analysis. a Paradigm used for both the flat and incline sessions to assess locomotor adaptation during and after split-belt walking. Subjects walked flat for the entire flat session, and incline (either 5° or 8.5°) for the entire incline session. The walking speeds, duration of epochs, resting breaks and inclination were based on each subject’s ability. b The decomposition of step length into leading (α) and trailing (X) leg positions with respect to the body is illustrated for each sloped condition. The body position, which is computed as the average of the greater trochanters, is illustrate with a white dot, and the perpendicular projection of the body onto the surface of the treadmill is illustrated as the black line coming from intersection of the legs. The position of the ankles is illustrated with white dots at the intersection of the foot and shank. This decomposition was done because it is known that inclination affects these aspects of step length differently [15, 16, 46]. Also note that when taking a step, the step length will depend on the position of the leading and trailing leg, which are generating a braking and propulsion force, respectively
Fig. 2
Fig. 2
Step Length Asymmetry Adaptation and Recalibration. a Stride-by-stride time course of step length asymmetry during Baseline, Adaptation, and Post-Adaptation for each session are shown. Note that each subject’s baseline bias has been removed, resulting in average step length asymmetry values of zero during Baseline. Each data point represents the average of 5 consecutive strides and shaded regions indicate the standard error for each session. For display purposes only, we include in the time courses stride values that were computed with a minimum of 10 subjects and the late adaptation behavior is aligned to the end of each subject’s adaptation epoch. The black arrow indicates a discontinuity in the data caused by many subjects taking a resting break at the same time. b-e The height of the bars indicates group average step length asymmetry ± standard errors. Individual subjects are represented with colored dots connected with lines. b Baseline: Baseline step length asymmetry is not influenced by slope. c Late Adaptation: Note that each session plateaued at different step length asymmetry values during the Adaptation epoch such that subjects reached more symmetric step lengths in the incline session than the flat session (d) ΔAdapt: Participants changed their gait by similar amounts during the Adaptation epoch in both sessions. e After-effects: Subjects had larger After-Effects during early Post-Adaptation in the incline session than the flat session, which is consistent with the Late Adaptation differences across sessions
Fig. 3
Fig. 3
Step length Adaptation and After-Effects. a Time courses of step lengths when stepping with either the non-paretic leg (top panel, fast leg during Adaptation) or the paretic leg (bottom panel, slow leg during Adaptation) during three epochs: Baseline, Adaptation, and Post-Adaptation. Note that each subject’s baseline bias has been removed, resulting in average step length values of zero during Baseline. The negative values in the non-paretic step lengths indicate that on average subjects are taking shorter steps with the non-paretic leg relative to baseline walking, whereas the opposite is observed with the paretic one. Each data point represents the average of 5 consecutive steps and shaded regions indicate the standard error for each group. For display purposes only, we include averaged values during Post-Adaptation that were computed with a minimum of 10 subjects and the late adaptation behavior is aligned to the end of each subject’s adaptation epoch. b The effect of slope on each leg’s change during Adaptation (ΔAdapt) and Post-Adaptation (ΔPost) is illustrated. Note that both the paretic and non-paretic leg adapted similarly. While the non-paretic leg has recalibrated (ΔPost≠0) following both the flat and incline session, the paretic leg is only recalibrated following incline Adaptation
Fig. 4
Fig. 4
Leg orientation Adaptation and After-Effects. a Leg orientations are depicted for individual subjects (as indicated with different colors) in both the flat and incline conditions. Note that subjects orient their legs about their bodies differently and that leg orientations are based on slope. Thick vertical black lines indicated a significant effect of leg (i.e., paretic or non-paretic) and slope (i.e., flat or incline) on trailing leg positions. b Schematic of the slow and fast (predicted) baseline behavior for the paretic and non-paretic leg orientations, respectively. The speed-specific leg orientations were regained during Late Adaptation. c The similarity between leg orientations across the speed-specific Baseline and Late Adaptation epochs is illustrated by the significant regression (solid cyan line; |y| = a∗|x|, 95% confidence interval for a = [0.92, 1.13]). Recall that a slow Baseline was only collected in the flat session, thus only the slow Baseline and Late Adaptation for the paretic leg (which walked slow during Adaptation) are shown. Note that the regression line closely overlaps with the idealized situation in which baseline and late adaptation values are identical (dashed gray line; i.e., y = x) and the behavior of young, healthy adults ([70], dashed magenta line). d Schematic of the leg orientations during early Post-Adaptation. The forward leg positions are ipsilaterally and the trailing leg positions are contralaterally maintained from split-to-tied walking. e The ipsilateral and contralateral similarity between α and X, respectively, across the Late Adaptation and early Post-Adaptation epochs is quantified with a significant correlation (solid cyan line; |y| = a∗|x|, 95% confidence interval for a = [0.94, 1.02]). The idealized situation in which Late Adaptation and early Post-Adaptation values are identical (dashed gray line; i.e., y = x) and the behavior of young, healthy adults ([70], dashed magenta line) are presented as a reference
Fig. 5
Fig. 5
Propulsion force Adaptation and After-Effects. a Stride-by-stride time courses of propulsion forces of the non-paretic (top panel) and paretic leg (bottom panel) are shown during self-selected Baseline, Adaptation, and Post-Adaptation. Note that each subject’s baseline bias has been removed, resulting in average propulsion values of zero during Baseline. Each data point represents the average of 5 consecutive strides and shaded regions indicate the standard error for each group. For display purposes only, we include stride values during Post-Adaptation that were computed with a minimum of 10 subjects and the late adaptation behavior is aligned to the end of each subject’s adaptation epoch. b-e We display group average values for propulsion force outcome measures ± standard errors. Individual subjects are represented with colored dots connected with lines. b Baseline: Thick horizontal black lines indicated that there is a significant effect of leg (i.e., paretic or non-paretic) and slope (i.e., flat or incline) on propulsion forces. On average, stroke subjects generate larger propulsion forces with their non-paretic leg, and they generate larger propulsion forces with both legs when walking incline. However, some individual stroke subjects generate larger propulsion forces with their paretic than their non-paretic leg. c Late Adaptation: Stroke subjects were closer to their baseline propulsion forces in the incline than the flat sessions. Moreover, baseline propulsion forces in the incline session were larger than the flat session (Fig. 2c). Taken together, these results suggest that stroke subjects are forced to propel more during incline split-belt walking with both legs compared to flat split-belt walking. d ΔAdapt: Propulsion forces were similarly modulated during the Adaptation epoch for both sloped conditions. e After-Effects: Even though both sloped sessions did not change the extent of propulsion force adaptation (ΔAdapt), slope influenced the After-Effects for the non-paretic leg, but not the paretic leg

References

    1. Andrews SC, Curtin D, Hawi Z, Wongtrakun J, Stout JC, Coxon JP. Intensity matters: high-intensity interval exercise enhances motor cortex plasticity more than moderate exercise. Cereb Cortex. 2019;30(1):1–12. - PubMed
    1. Awad LN, Hsiao HY, Binder-Macleod SA. Central drive to the paretic ankle Plantarflexors affects the relationship between propulsion and walking speed after stroke. J Neurol Phys Ther. 2020;44(1):42–48. - PMC - PubMed
    1. Awad LN, Reisman DS, Kesar TM, Binder-Macleod SA. Targeting paretic propulsion to improve poststroke walking function: a preliminary study. Arch Phys Med Rehabil. 2014;95(5):840–848. - PMC - PubMed
    1. Balasubramanian CK, Bowden MG, Neptune RR, Kautz SA. Relationship between step length asymmetry and walking performance in subjects with chronic hemiparesis. Arch Phys Med Rehabil. 2007;88(1):43–49. - PubMed
    1. Bastian AAJ. Understanding sensorimotor adaptation and learning for rehabilitation. Curr Opin Neurol. 2008;21(6):628–633. - PMC - PubMed

Publication types