

Real-time monitoring the transmission potential of COVID-19 in Singapore, March 2020
- PMID: 32493466
- PMCID: PMC7268586
- DOI: 10.1186/s12916-020-01615-9
Real-time monitoring the transmission potential of COVID-19 in Singapore, March 2020
Abstract
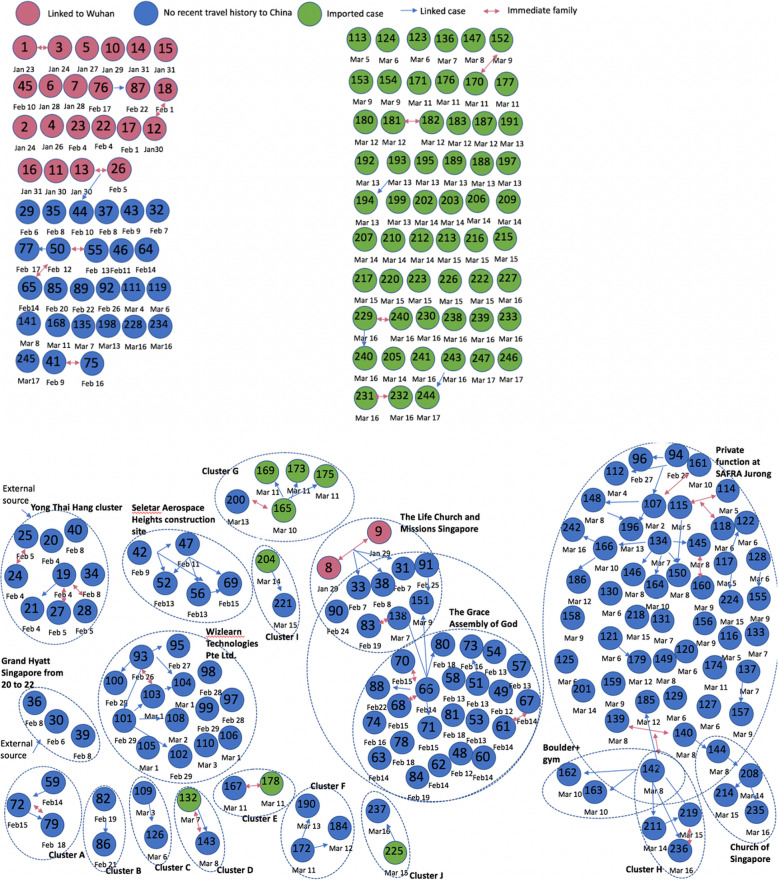
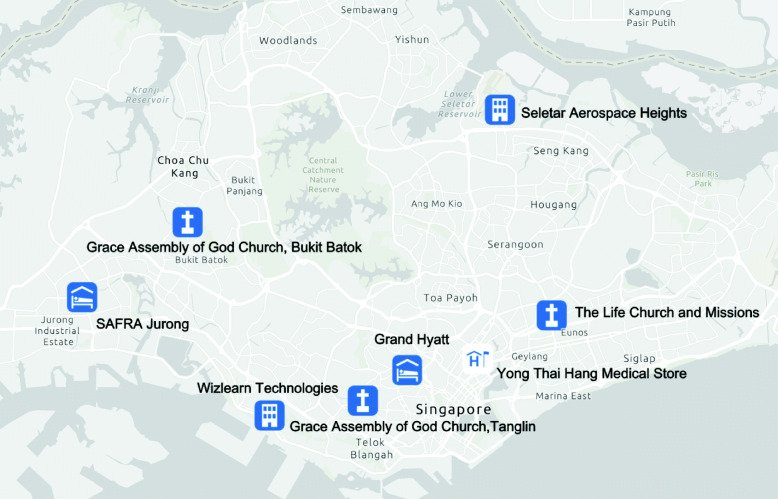
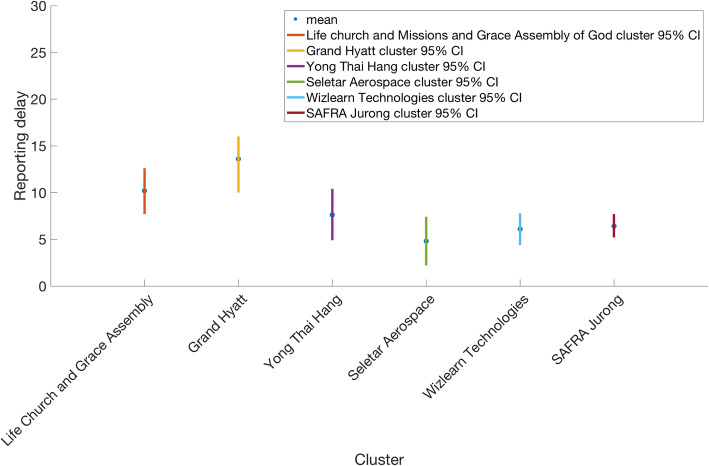
Background: As of March 31, 2020, the ongoing COVID-19 epidemic that started in China in December 2019 is now generating local transmission around the world. The geographic heterogeneity and associated intervention strategies highlight the need to monitor in real time the transmission potential of COVID-19. Singapore provides a unique case example for monitoring transmission, as there have been multiple disease clusters, yet transmission remains relatively continued.
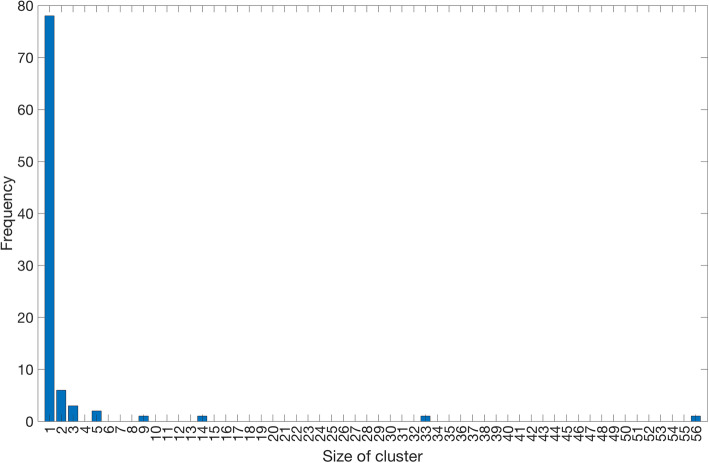
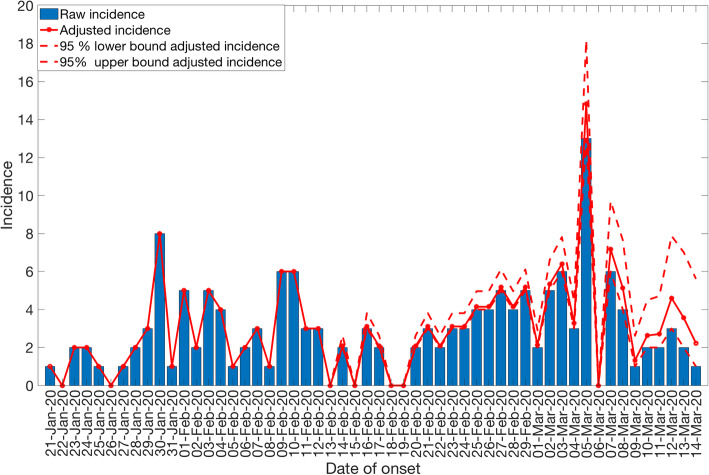
Methods: Here we estimate the effective reproduction number, Rt, of COVID-19 in Singapore from the publicly available daily case series of imported and autochthonous cases by date of symptoms onset, after adjusting the local cases for reporting delays as of March 17, 2020. We also derive the reproduction number from the distribution of cluster sizes using a branching process analysis that accounts for truncation of case counts.
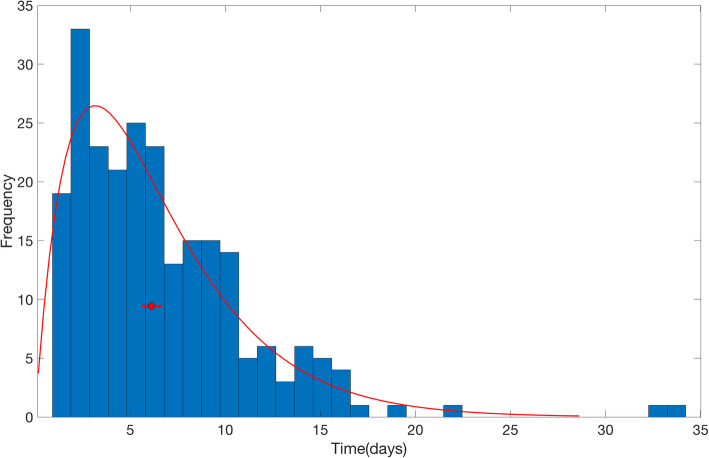
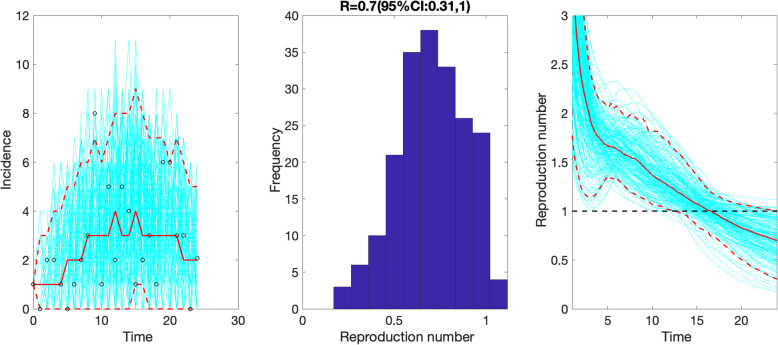
Results: The local incidence curve displays sub-exponential growth dynamics, with the reproduction number following a declining trend and reaching an estimate at 0.7 (95% CI 0.3, 1.0) during the first transmission wave by February 14, 2020, while the overall R based on the cluster size distribution as of March 17, 2020, was estimated at 0.6 (95% CI 0.4, 1.02). The overall mean reporting delay was estimated at 6.4 days (95% CI 5.8, 6.9), but it was shorter among imported cases compared to local cases (mean 4.3 vs. 7.6 days, Wilcoxon test, p < 0.001).
Conclusion: The trajectory of the reproduction number in Singapore underscores the significant effects of successful containment efforts in Singapore, but it also suggests the need to sustain social distancing and active case finding efforts to stomp out all active chains of transmission.
Keywords: COVID-19; Cluster distribution; Reporting delay; Reproduction number; SARS-CoV-2; Singapore; Transmission heterogeneity; Transmission potential.
Conflict of interest statement
G.C. is a Board Member for the journal. The other authors declare that they have no competing interests.
Figures

Update of
-
Real-time monitoring the transmission potential of COVID-19 in Singapore, March 2020.medRxiv [Preprint]. 2020 Apr 17:2020.02.21.20026435. doi: 10.1101/2020.02.21.20026435. medRxiv. 2020. Update in: BMC Med. 2020 Jun 3;18(1):166. doi: 10.1186/s12916-020-01615-9. PMID: 32511436 Free PMC article. Updated. Preprint.
Comment in
-
Heterogenous COVID-19 transmission dynamics within Singapore: a clearer picture of future national responses.BMC Med. 2020 Jun 2;18(1):164. doi: 10.1186/s12916-020-01625-7. BMC Med. 2020. PMID: 32493311 Free PMC article. No abstract available.
References
-
- World Health Organization. Coronavirus disease 2019 (COVID-19) Situation Report – 27. World Health Organization; 2020. Available from: https://www.who.int/docs/default-source/coronaviruse/situation-reports/2....
-
- Worldometer. COVID-19 coronavirus / cases 2020. Available from: https://www.worldometers.info/coronavirus/coronavirus-cases/.
-
- Tian H, Li Y, Liu Y, Kraemer M, Chen B, Cai J, et al. Early evaluation of Wuhan City travel restrictions in response to the 2019 novel coronavirus outbreak. medRxiv. 2020:2020.01.30.20019844.
-
- World Health Organization. Novel Coronavirus (2019-nCoV), Situation report - 1. 2020. Available from: https://www.who.int/docs/default-source/coronaviruse/situation-reports/2.... Accessed 25 Feb 2020.
Publication types
MeSH terms
Grants and funding
LinkOut - more resources
Full Text Sources
Research Materials
Miscellaneous
