

Reproducibility of EEG functional connectivity in Alzheimer's disease
- PMID: 32493476
- PMCID: PMC7271479
- DOI: 10.1186/s13195-020-00632-3
Reproducibility of EEG functional connectivity in Alzheimer's disease
Abstract
Background: Although numerous electroencephalogram (EEG) studies have described differences in functional connectivity in Alzheimer's disease (AD) compared to healthy subjects, there is no general consensus on the methodology of estimating functional connectivity in AD. Inconsistent results are reported due to multiple methodological factors such as diagnostic criteria, small sample sizes and the use of functional connectivity measures sensitive to volume conduction. We aimed to investigate the reproducibility of the disease-associated effects described by commonly used functional connectivity measures with respect to the amyloid, tau and neurodegeneration (A/T/N) criteria.
Methods: Eyes-closed task-free 21-channel EEG was used from patients with probable AD and subjective cognitive decline (SCD), to form two cohorts. Artefact-free epochs were visually selected and several functional connectivity measures (AEC(-c), coherence, imaginary coherence, PLV, PLI, wPLI) were estimated in five frequency bands. Functional connectivity was compared between diagnoses using AN(C)OVA models correcting for sex, age and, additionally, relative power of the frequency band. Another model predicted the Mini-Mental State Exam (MMSE) score of AD patients by functional connectivity estimates. The analysis was repeated in a subpopulation fulfilling the A/T/N criteria, after correction for influencing factors. The analyses were repeated in the second cohort.
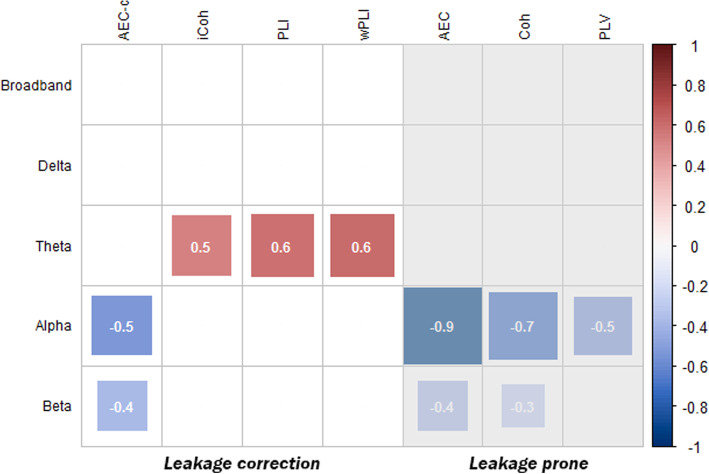
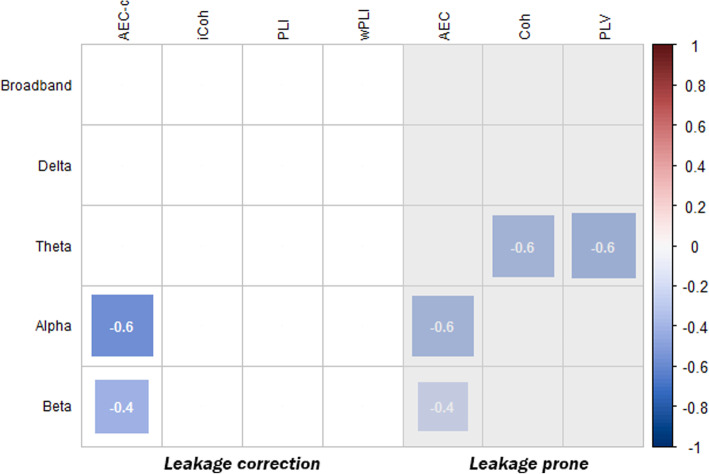
Results: Two large cohorts were formed (SCD/AD; n = 197/214 and n = 202/196). Reproducible effects were found for the AEC-c in the alpha and beta frequency bands (p = 6.20 × 10⁻⁷, Cohen's d = - 0.53; p = 5.78 × 10⁻⁴, d = - 0.37) and PLI and wPLI in the theta band (p = 3.81 × 10⁻⁸, d = 0.59; p = 1.62 × 10⁻⁸, d = 0.60, respectively). Only effects of the AEC-c remained significant after statistical correction for the relative power of the selected bandwidth. In addition, alpha band AEC-c correlated with disease severity represented by MMSE score.
Conclusion: The choice of functional connectivity measure and frequency band can have a large impact on the outcome of EEG studies in AD. Our results indicate that in the alpha and beta frequency bands, the effects measured by the AEC-c are reproducible and the most valid in terms of influencing factors, correlation with disease severity and preferable properties such as correction for volume conduction. Phase-based measures with correction for volume conduction, such as the PLI, showed reproducible effects in the theta frequency band.
Keywords: Alzheimer’s disease; EEG; Functional connectivity; Reproducibility.
Conflict of interest statement
The authors declare that they have no competing interests.
Figures


References
-
- Prince MJ. World Alzheimer report 2015: the global impact of dementia: an analysis of prevalence, incidence, cost and trends: Alzheimer’s Disease International. 2015.
-
- Jeong J. EEG dynamics in patients with Alzheimer’s disease. Clin Neurophysiol. 2004;115(7):1490–1505. - PubMed
-
- Dauwels J, Vialatte F, Cichocki A. Diagnosis of Alzheimer’s disease from EEG signals: where are we standing? Curr Alzheimer Res. 2010;7(6):487–505. - PubMed
MeSH terms
LinkOut - more resources
Full Text Sources
Other Literature Sources
Medical
Miscellaneous
