. 2020 Jul 9;7(4):ENEURO.0406-19.2020.
doi: 10.1523/ENEURO.0406-19.2020. Print 2020 Jul/Aug.

Rigbox: An Open-Source Toolbox for Probing Neurons and Behavior

Affiliations

Rigbox: An Open-Source Toolbox for Probing Neurons and Behavior

Jai Bhagat et al. eNeuro. .

Abstract

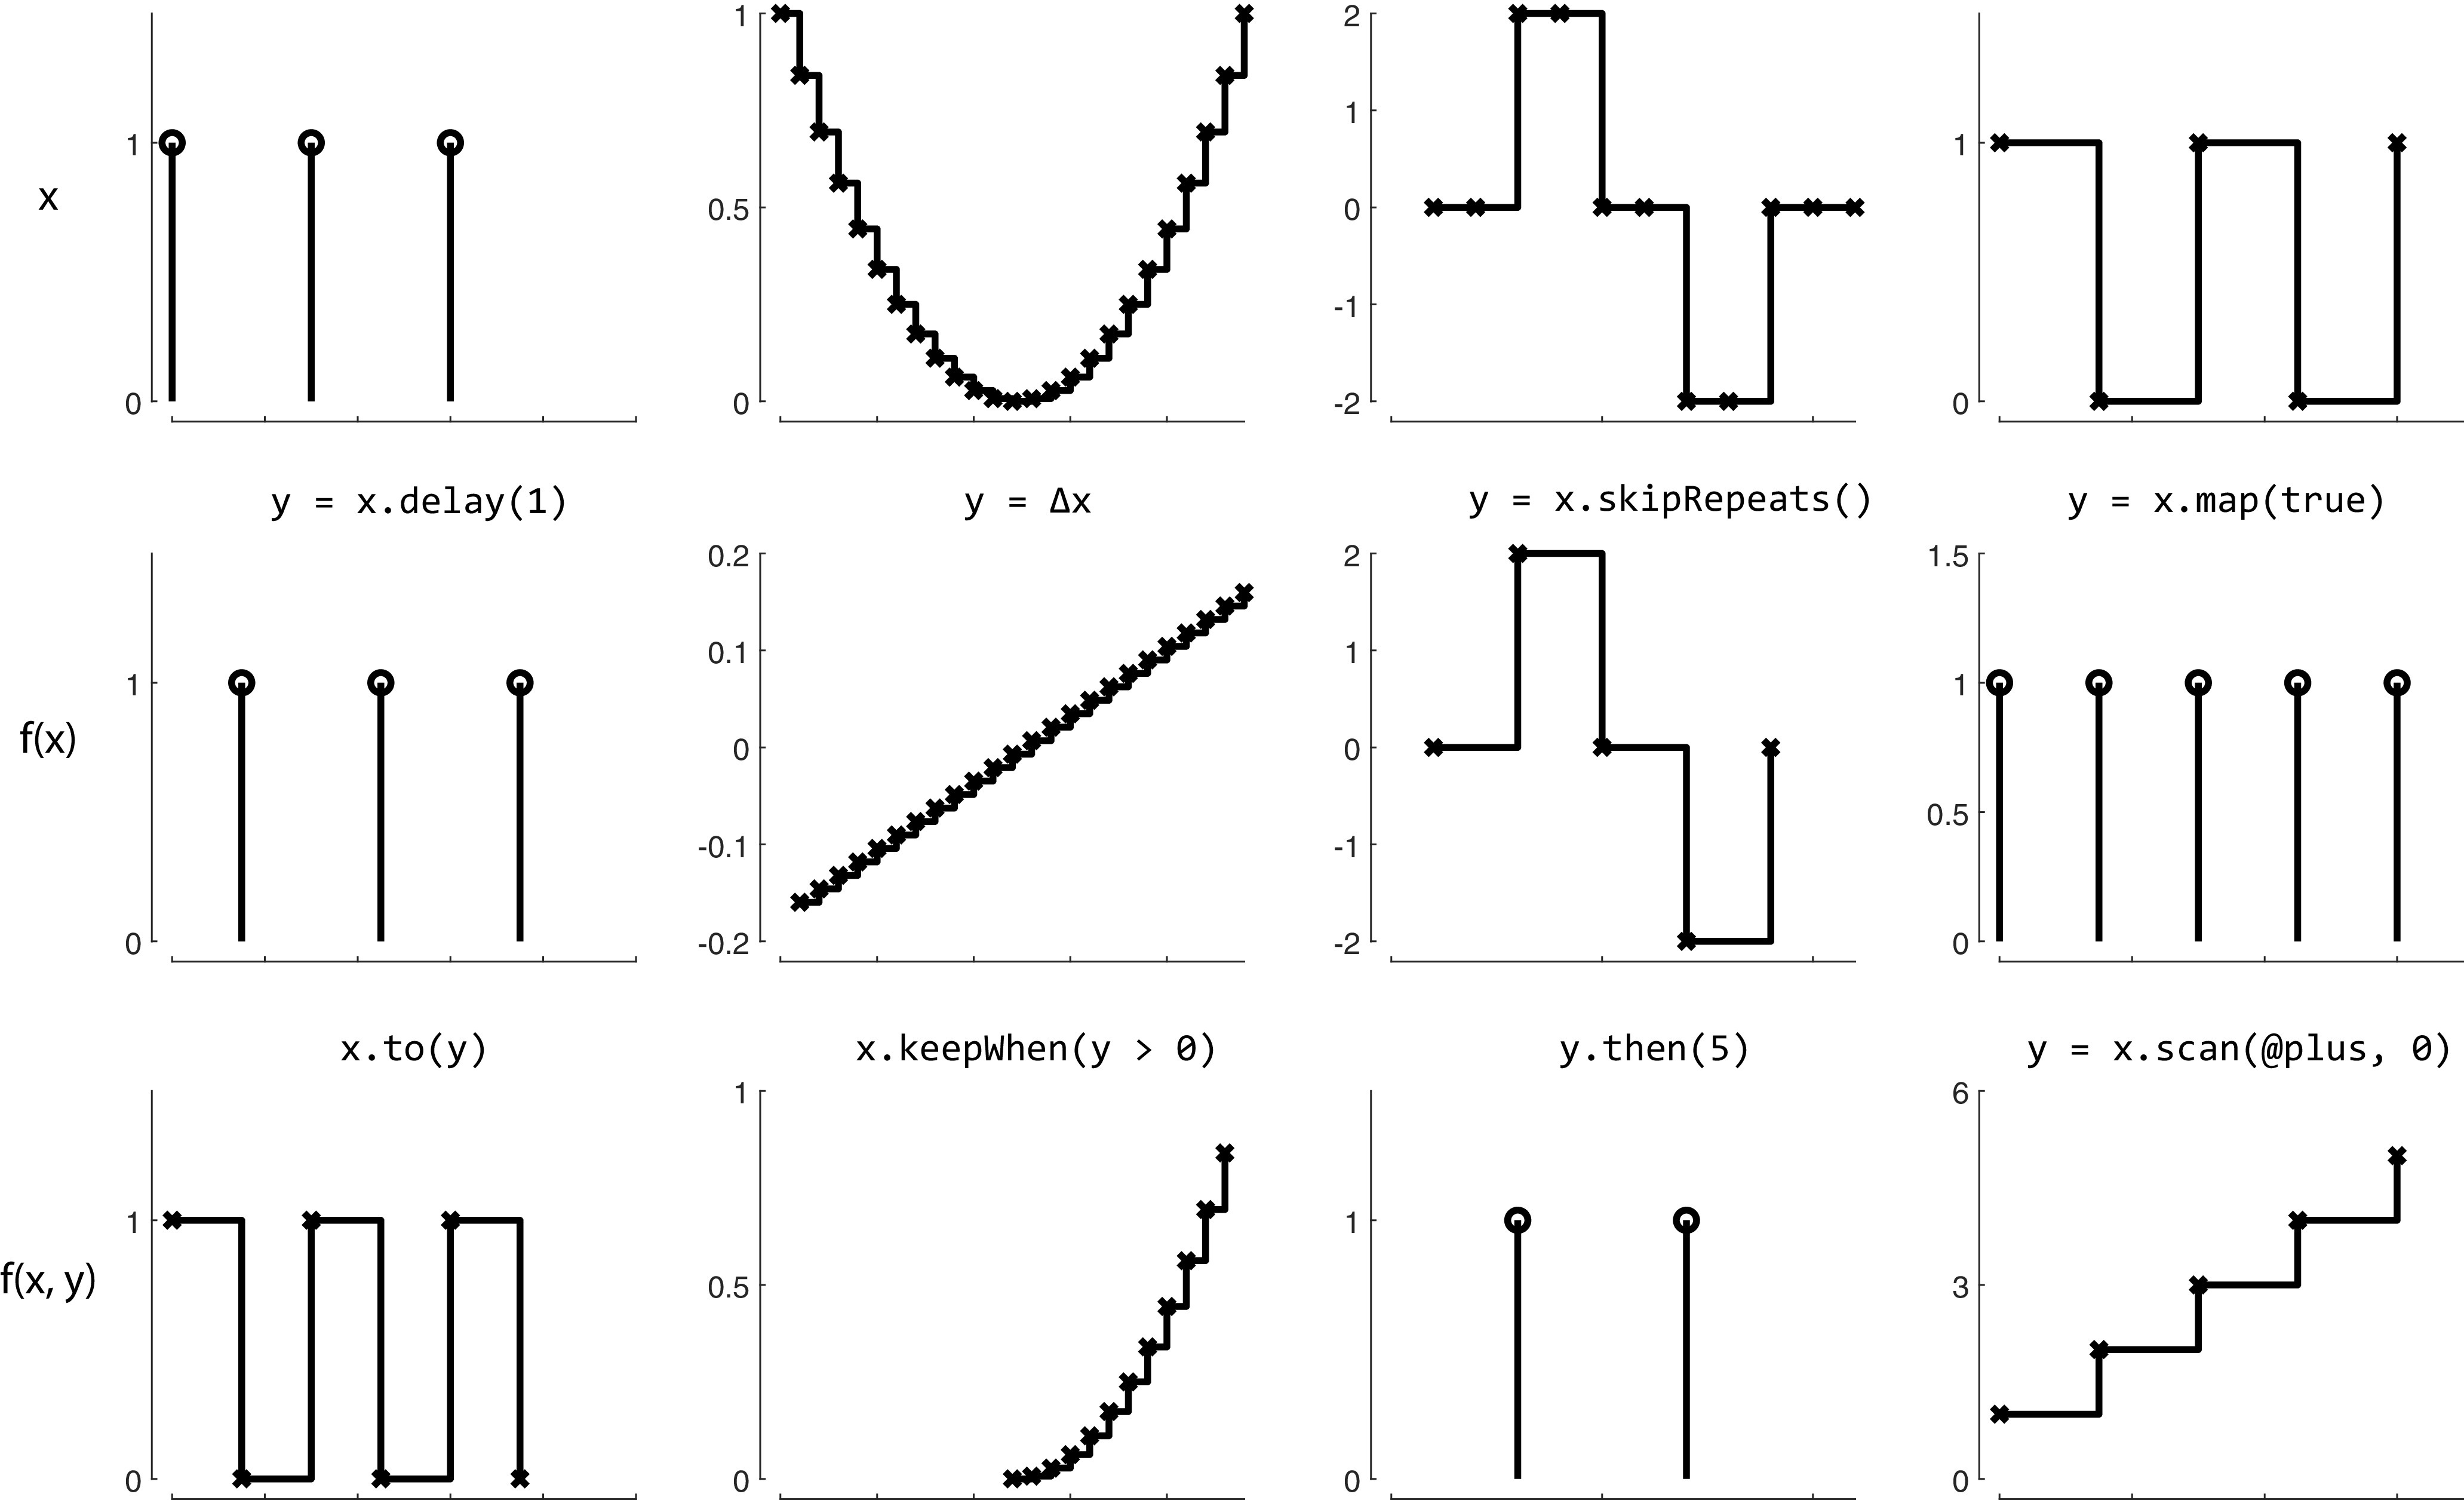
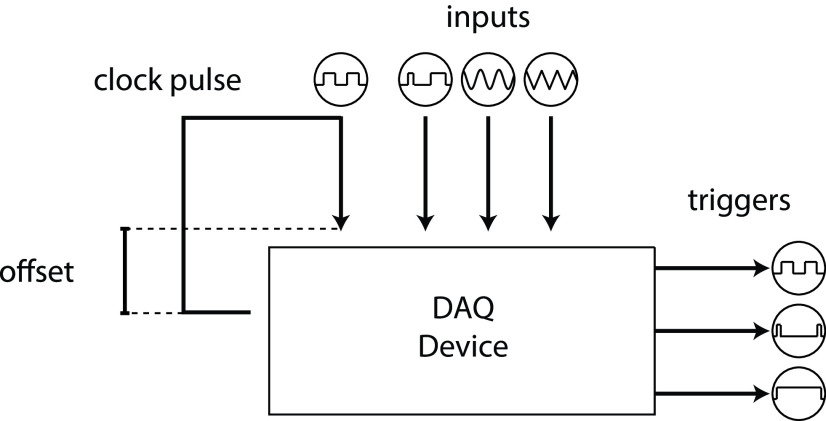
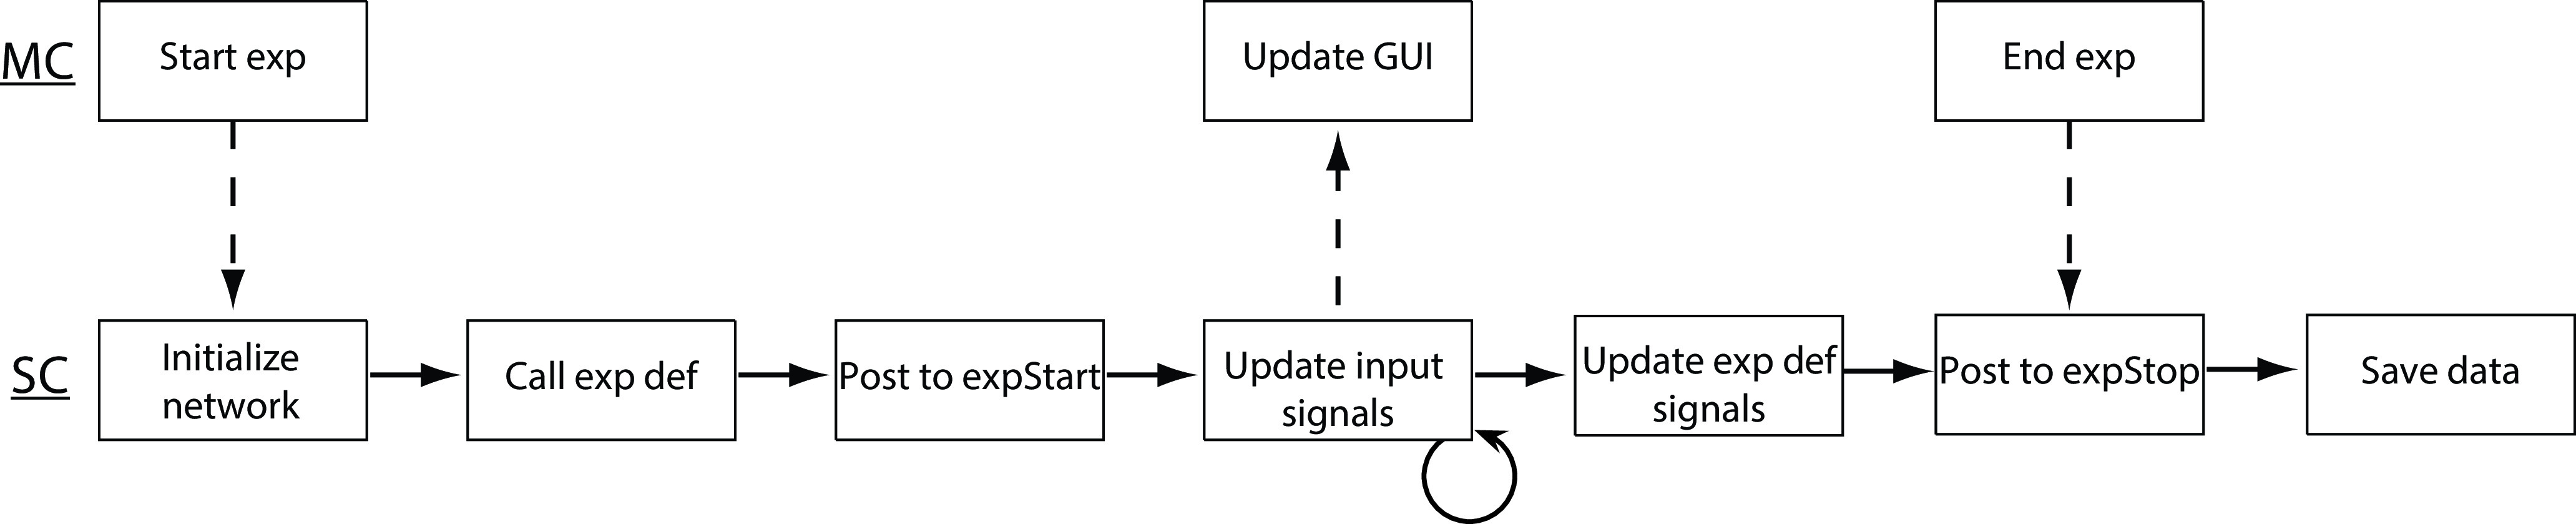
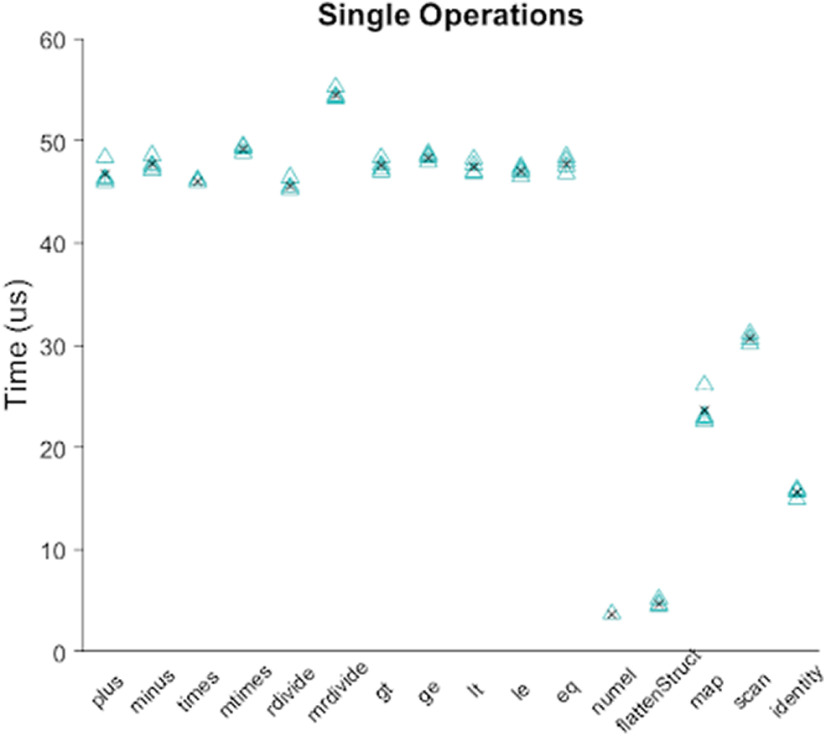
Setting up an experiment in behavioral neuroscience is a complex process that is often managed with ad hoc solutions. To streamline this process, we developed Rigbox, a high-performance, open-source software toolbox that facilitates a modular approach to designing experiments (https://github.com/cortex-lab/Rigbox). Rigbox simplifies hardware input-output, time aligns datastreams from multiple sources, communicates with remote databases, and implements visual and auditory stimuli presentation. Its main submodule, Signals, allows intuitive programming of behavioral tasks. Here we illustrate its function with the following two interactive examples: a human psychophysics experiment, and the game of Pong. We give an overview of running experiments in Rigbox, provide benchmarks, and conclude with a discussion on the extensibility of the software and comparisons with similar toolboxes. Rigbox runs in MATLAB, with Java components to handle network communication, and a C library to boost performance.

Keywords: behavioral; control; experimental; software; toolbox.


Figures

Figure 1.
Figure 1.
A representation of the time-dependent phase of a visual stimulus in Signals using a clock signal, t. t represents time in seconds since experiment start (its value therefore constantly increases). An unfilled circle represents a constant value: it becomes a node in the network when combined with another signal in an operation (in this instance, via multiplication, represented by the MATLAB function, times). The bottom right shows how the phase of the grating changes over time: the white arrow indicates the phase shift direction.
Figure 2.
Figure 2.
The creation of new signals via example signals methods. Each panel, in which the x-axis represents time and the y-axis represents value, contains a signal. Each column depicts a set of related transformations. The top row contains four arbitrary signals. The second row depicts a signal that results from applying an operation on the signal in the panel above. The third row depicts a signal that results from applying an operation on the signals in the two panels above. Conceptually, each signal can be thought of as both a continuous stream of discrete values, and as a discrete representation whose value changes over time.
Figure 3.
Figure 3.
Output shown when running “ringach98.m” a, A sample grating that the subject is required to respond to via a “ctrl” key press. b, A heatmap showing the grating orientations for the 10 frames immediately preceding the key press, summed over all of the key presses for the duration of the experiment. After a few minutes, the distribution of orientations that were presented at each key press resembles a 2D Mexican Hat wavelet, centered on the orientation the subject was reporting at the subject’s average reaction time. In this example, the subject was reporting a vertical grating orientation (90°) with an average reaction time of ∼600 ms.
Figure 4.
Figure 4.
A simplified Signals network diagram of the Ringach experiment. Each circle represents a node in the network that carries out an operation on its direct input. The left-most nodes are inputs to the network, and the values from the right-most layer are used to update the stimulus and the histogram plot. An unfilled circle represents a constant value.
Figure 5.
Figure 5.
A Signals representation of an experiment. There are three types of input signals in the network, representing a clock, experiment epochs (e.g., new trials and experiment start and end conditions), and hardware input devices (e.g., an optical mouse, keyboard, rotary encoder, lever). In an exp def, the user defines transformations that create new signals (data not shown) from these input signals, which ultimately drive outputs (e.g., a screen, speaker, and external hardware such as a reward valve). The exp def is called once to create these experimenter-defined signals, which are updated during experiment runtime as the input signals they depend on are updated.
Figure 6.
Figure 6.
A screenshot of Pong run in Signals. The top shows the paddles and ball during gameplay. The bottom shows the GUI used to launch the game. The paddle colors (represented by an RGB vector) and target score are examples of global signal parameters that can be set once before starting the game. The ball color is an example of a conditional signal parameter that changes randomly after every trial (in this case, after a score) between the arrays indicated in each row (which in this case specify the colors white, red, and blue).
Figure 7.
Figure 7.
A representation of a Timeline object. The topmost signal is the main timing signal, “chrono,” which is used to unify all time stamps across computers during an experiment. The “inputs” represent different hardware and software input signals read by a NI-DAQ, and the “triggers” represent different hardware output signals, triggered by a NI-DAQ.
Figure 8.
Figure 8.
A simplified chronology of events that occur when starting an experiment via the MC GUI. Pushing the “Start” button on the MC GUI sends a message to SC to initialize a Signals network, then call the user’s Signals exp def to create new signals within the network, then post to the ‘expStart’ signal to start the experiment. After starting the experiment, the network input signals are continuously updated via callbacks (e.g., via a MATLAB timer callback, or by reading from hardware input devices), which update the rest of the signals in the network (i.e., those signals defined in the user’s exp def). These updates can then be displayed back to the user on the MC GUI. This continues until the experiment is either ended from the MC GUI, or a condition is met within the user’s exp def that updates the ‘expStop’ signal. After the experiment is ended, experiment data are saved.
Figure 9.
Figure 9.
The new experiments tab within the MC GUI. This tab allows a user to select a subject, experiment type, and rig on which to run an experiment. Additionally, rig-specific options can be set via the “Options” button, and signal parameters for the behavioral task can be set via the editable parameter fields.
Figure 10.
Figure 10.
Experiment panels with live updates for two experiments. The top text fields in each panel display experiment information such as elapsed time, trial number, and the current running total of delivered reward. Below the text fields is a psychometric plot showing task performance for specific types of trials, and below this is a plot showing the real-time trace of a hardware input device (the panel on the left shows a two-alternative unforced choice task for which the green bar indicates the direction of the action the subject must make to receive a reward). There is also a text field for logging comments that can be immediately posted to an Alyx database. These experiment panels are highly customizable.
Figure 11.
Figure 11.
Benchmarking results for operations (specified by the x-axis) on a single signal. The black “x” shows the mean value per group.
Figure 12.
Figure 12.
Benchmarking results for updating every signal in a network, for networks of various number of signals (nodes) spread over various number of layers (depth). The black “x” shows the mean value per group.
Figure 13.
Figure 13.
Delay times for specific updates when running a 2AFC (two-alternative forced choice) visual contrast discrimination task. The number next to each violin plot indicates the number of samples in the group. “Rotary Encoder delay” is the time between polling consecutive position values from a rotary encoder. “Stim Window Delay” is the time between triggering a display to be rendered, and its complete render on a screen. “Reward Delay” is the time between triggering and opening a reward valve. The 99th percentile outliers were not included in the plot for “Rotary Encoder delay”: there were 98 instances in which the delay took between 200 and 600 ms, due to the execution time of the NI-DAQmx MATLAB package when sending analog output (reward delivery) via the USB-6211 DAQ.

References

    1. Abbott LF, Angelaki DE, Carandini M, Churchland AK, Dan Y, Dayan P, Deneve S, Fiete I, Ganguli S, Harris KD, Häusser M, Hofer S, Latham PE, Mainen ZF, Mrsic-Flogel T, Paninski L, Pillow JW, Pouget A, Svoboda K, Witten IB, et al. (2017) An international laboratory for systems and computational neuroscience. Neuron 96:1213–1218. 10.1016/j.neuron.2017.12.013 - DOI - PMC - PubMed
    1. Armin L, Okun M, Moss MM, Gurnani H, Farrell K, Wells MJ, Reddy CB, Kepecs A, Harris KD, Carandini M (2020) Dopaminergic and Prefrontal Basis of Learning from Sensory Confidence and Reward Value. Neuron 105:700–711.e6. - PMC - PubMed
    1. Aronov D, Tank DW (2014) Engagement of neural circuits underlying 2D spatial navigation in a rodent virtual reality system. Neuron 84:442–456. 10.1016/j.neuron.2014.08.042 - DOI - PMC - PubMed
    1. Bonacchi N, Chapuis G, Churchland AK, Harris KD, Hunter M, Rossant C (2020) Data architecture for a large-scale neuroscience collaboration. BioRxiv. Advance online publication. Retrieved June 4, 2020. doi:10.1101/82787310.1101/827873. - DOI
    1. Burgess CP, Lak A, Steinmetz NA, Zatka-Haas P, Bai Reddy C, Jacobs EAK, Linden JF, Paton JJ, Ranson A, Schröder S, Soares S, Wells MJ, Wool LE, Harris KD, Carandini M (2017) High-yield methods for accurate two-alternative visual psychophysics in head-fixed mice. Cell Rep 20:2513–2524. 10.1016/j.celrep.2017.08.047 - DOI - PMC - PubMed

LinkOut - more resources