. 2020 Jul 14;13(7):dmm044586.
doi: 10.1242/dmm.044586.

A mouse SWATH-mass spectrometry reference spectral library enables deconvolution of species-specific proteomic alterations in human tumour xenografts

Affiliations

A mouse SWATH-mass spectrometry reference spectral library enables deconvolution of species-specific proteomic alterations in human tumour xenografts

Lukas Krasny et al. Dis Model Mech. .

Abstract

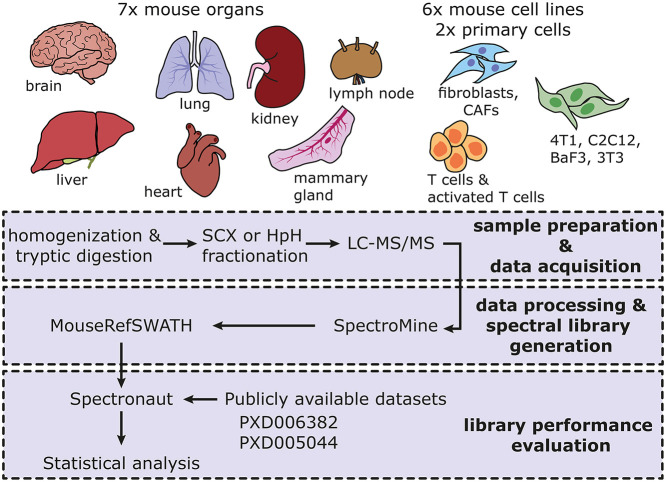
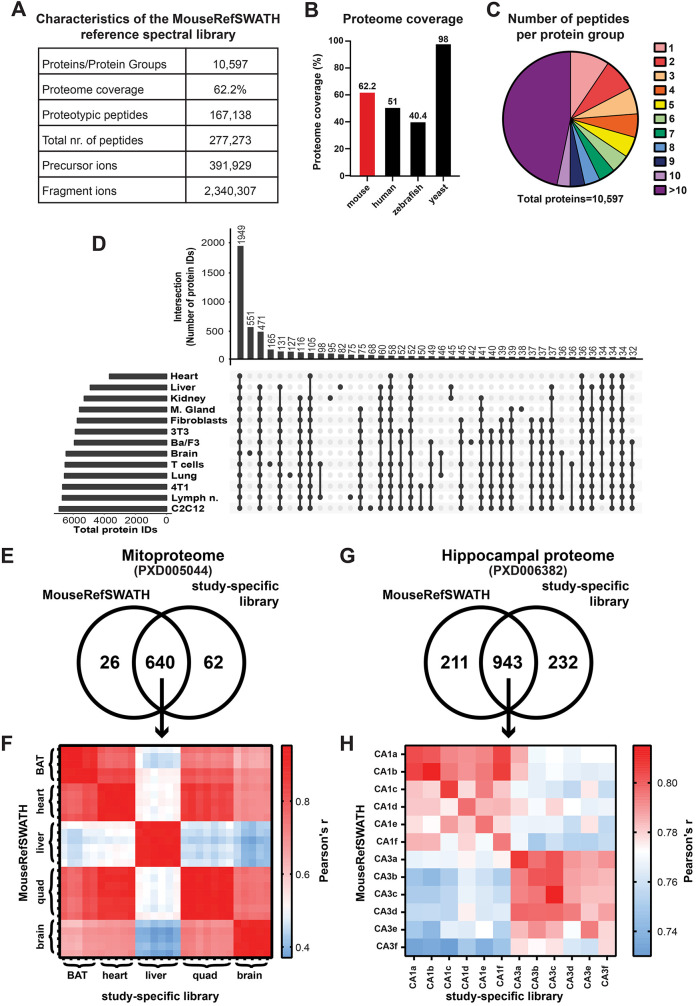
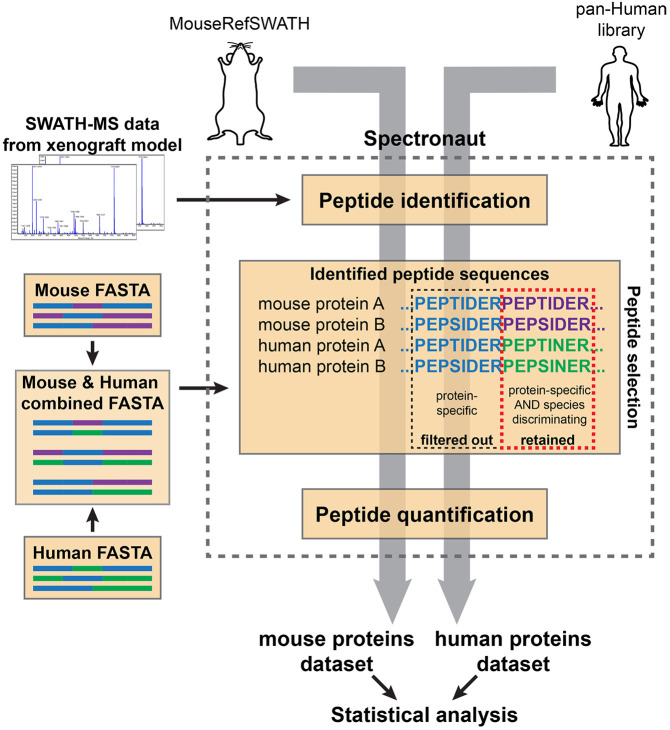
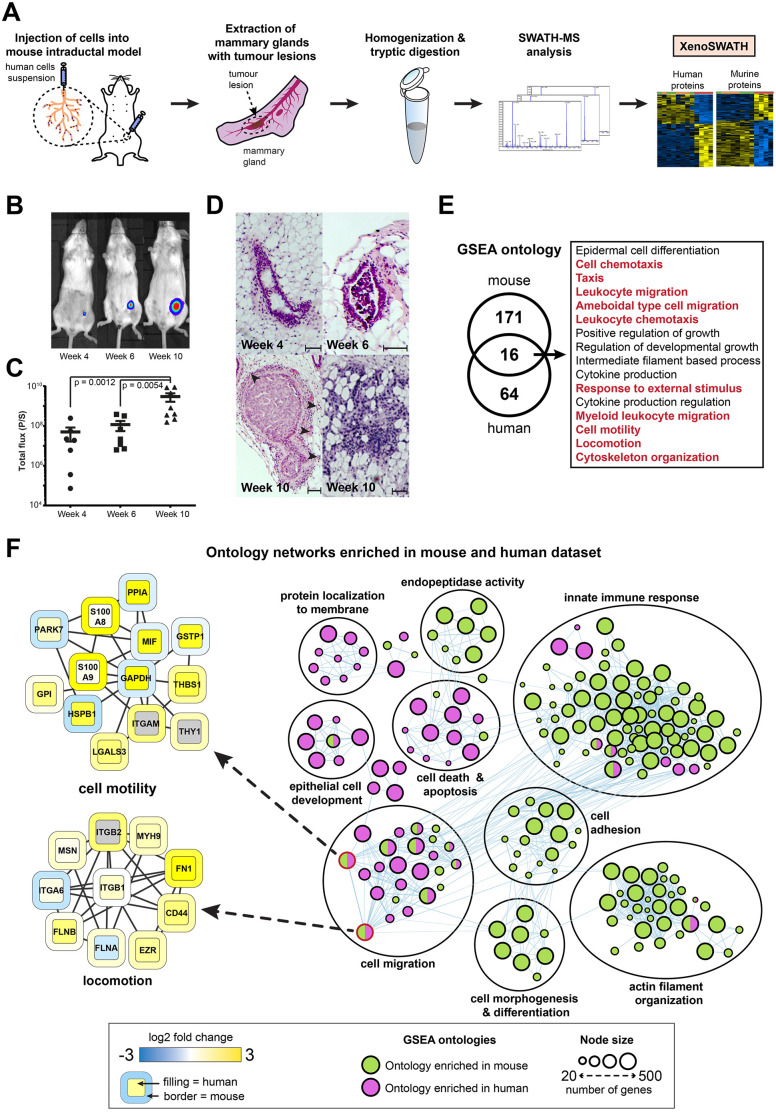
SWATH-mass spectrometry (MS) enables accurate and reproducible proteomic profiling in multiple model organisms including the mouse. Here, we present a comprehensive mouse reference spectral library (MouseRefSWATH) that permits quantification of up to 10,597 proteins (62.2% of the mouse proteome) by SWATH-MS. We exploit MouseRefSWATH to develop an analytical pipeline for species-specific deconvolution of proteomic alterations in human tumour xenografts (XenoSWATH). This method overcomes the challenge of high sequence similarity between mouse and human proteins, facilitating the study of host microenvironment-tumour interactions from 'bulk tumour' measurements. We apply the XenoSWATH pipeline to characterize an intraductal xenograft model of breast ductal carcinoma in situ and uncover complex regulation consistent with stromal reprogramming, where the modulation of cell migration pathways is not restricted to tumour cells but also operates in the mouse stroma upon progression to invasive disease. MouseRefSWATH and XenoSWATH open new opportunities for in-depth and reproducible proteomic assessment to address wide-ranging biological questions involving this important model organism.

Keywords: Breast cancer; DCIS; Mass spectrometry; Mouse; Proteomics; SWATH-MS; Xenografts.


Conflict of interest statement

Competing interestsThe authors declare no competing or financial interests.

Figures

Fig. 1.
Fig. 1.
Overview of the sample types and schematic workflow used to build the MouseRefSWATH reference spectral library. Fifteen unique sample types comprising seven mouse organs, two primary cell types and six mouse cell lines were analysed to maximize proteome coverage. The workflow consists of a first step of sample preparation and data acquisition of each sample by data-dependent acquisition (DDA)-based liquid chromatography–tandem mass spectrometry (LC-MS/MS). In the second step, the resulting proteomic data were subjected to processing and spectral library generation using the combined Search Archives approach in the SpectroMine software. The subsequent evaluation of the performance of the MouseRefSWATH library was undertaken with the Spectronaut software utilizing two publicly available datasets. CAF, cancer-associated fibroblast; HpH, high pH; SCX, strong cation exchange.
Fig. 2.
Fig. 2.
Characteristics and performance of the MouseRefSWATH reference spectral library. (A) Detailed characteristics of the generated MouseRefSWATH library. (B) Percentage proteome coverage of MouseRefSWATH library in comparison with published spectral libraries for other eukaryotic organisms, including human (Rosenberger et al., 2014), zebrafish (Blattman et al., 2019) and yeast (Picotti et al., 2013). (C) Peptide coverage of the individual proteins in the MouseRefSWATH library. 90.6% of the proteins are represented by more than one unique peptide. (D) Contribution plot of the tissue- or cell-specific proteins to the overall composition of the MouseRefSWATH library. The bar chart at the top depicts the total number of proteins identified in the overlap of datasets contributed by different organs/cell types as indicated in the dot plot below. The bar chart on the left indicates the total number of proteins identified in the individual datasets from each organ or cell type. (E) Venn diagram depicting overlap of mitochondrial proteins detected by the MouseRefSWATH library and study-specific library based on analysis of the PXD005044 dataset (Williams et al., 2018). (F) Similarity matrix showing Pearson's correlation coefficient of the 640 overlapping mitochondrial proteins, which were quantified by either the MouseRefSWATH library or the study-specific library. Five to eight animals were used for each tissue site. BAT, brown adipocyte tissue; quad, quadriceps. (G) Venn diagram depicting overlap of hippocampal proteins detected by the MouseRefSWATH library and study-specific library based on analysis of the PXD006382 dataset (von Ziegler et al., 2018). (H) Similarity matrix showing Pearson's correlation coefficient of the 943 overlapping hippocampal proteins, which were quantified by either the MouseRefSWATH library or the study-specific library. Two hippocampal areas (CA1 and CA3) from six animals (a-f) were used.
Fig. 3.
Fig. 3.
XenoSWATH workflow of the species-specific deconvolution analysis pipeline. The ‘bulk tumour xenograft’ acquired SWATH-MS data are first subjected to two separate searches by either the MouseRefSWATH or the pan-Human library in the Spectronaut software to identify protein-specific (proteotypic) peptides. A combined FASTA file of human and mouse in silico digested peptides is then generated to enable subsequent peptide quantification of species-discriminating proteotypic peptides. For peptide quantification, Spectronaut will compare the sequences of the identified peptides from either the MouseRefSWATH or pan-Human library searches with the peptides sequences in the combined FASTA file. Because protein-specific (proteotypic) peptides that are not species discriminating (blue) occur more than once in the combined FASTA file, Spectronaut filters these peptides out. Only peptides that are both protein specific and species discriminating (purple, mouse; green, human) in the combined FASTA file are retained and subjected to quantification. The output of this pipeline is two quantified datasets, one specific for mouse proteins and the other for human proteins.
Fig. 4.
Fig. 4.
Quantitative proteomic profiling of ductal carcinoma in situ (DCIS) progression to invasive breast cancer in the mouse intraductal (MIND) xenograft model. (A) Experimental workflow of SWATH-MS analysis of tumour xenografts. MCF10DCIS.com-Luc cells were injected orthotopically into mouse mammary gland ducts through the nipple. Whole mammary glands with tumours were removed at 4, 6 and 10 weeks (w) post-injection and subjected to sample preparation prior to SWATH-MS data acquisition and analysis by the XenoSWATH pipeline. (B) Representative bioluminescence images as measured by IVIS at 4w, 6w and 10w post-injection. (C) Total bioluminescence flux reflecting tumour size in MIND model at 4w, 6w and 10w post-injection (n=7 for 4w and 6w samples, n=8 for 10w samples). P-value represents statistical significance of the difference between the sample groups calculated by two-tailed Mann–Whitney test. Each dot represents one biological replicate; error bars indicate mean±s.e.m. P/S, photons/s. (D) H&E images showing initial DCIS lesion formation in the MIND model at 4w, which progresses to form an invasive tumour at 10w post-injection. Tumour microinvasion in lesion 10w post-injection is indicated by arrowheads. Scale bars: 100 μm. (E) Venn diagram showing the overlap of enriched ontologies for proteins that are significantly upregulated in the 10w specimens (n=4) versus the 4w (n=4) and 6w (n=4) specimens as identified by gene set enrichment analysis (GSEA) with FDR-adjusted P-value <0.1. Ontologies associated with cell motility, migration and cytoskeleton organization are highlighted in red. (F) Network depicting ontologies enriched in human (purple) and mouse (green) datasets (10w versus 4w and 6w) and their overlap as identified by GSEA. Detailed protein networks for two selected ontologies (cell motility and locomotion) are shown. In these networks, the protein node border colour represents the mouse dataset while the protein node fill colour represents the human dataset. Only proteins with expression Log2 fold change >0.58 in either the mouse or human dataset are displayed. Proteins that are not detected are represented by grey.

References

    1. Balogh K. N., Templeton D. J. and Cross J. V. (2018). Macrophage Migration Inhibitory Factor protects cancer cells from immunogenic cell death and impairs anti-tumor immune responses. PLoS ONE 13, e0197702 10.1371/journal.pone.0197702 - DOI - PMC - PubMed
    1. Barkovits K., Pacharra S., Pfeiffer K., Steinbach S., Eisenacher M., Marcus K. and Uszkoreit J. (2020). Reproducibility, specificity and accuracy of relative quantification using spectral library-based data-independent acquisition. Mol. Cell. Proteomics 19, 181-197. 10.1074/mcp.RA119.001714 - DOI - PMC - PubMed
    1. Behbod F., Kittrell F. S., Lamarca H., Edwards D., Kerbawy S., Heestand J. C., Young E., Mukhopadhyay P., Yeh H. W., Allred D. C. et al. (2009). An intraductal human-in-mouse transplantation model mimics the subtypes of ductal carcinoma in situ. Breast Cancer Res. 11, R66 10.1186/bcr2358 - DOI - PMC - PubMed
    1. Benjamini Y. and Hochberg Y. (1995). Controlling the false discovery rate - a practical and powerful approach to multiple testing. J.R. Stat. Soc. B 57, 289-300. 10.1111/j.2517-6161.1995.tb02031.x - DOI
    1. Blattmann P., Stutz V., Lizzo G., Richard J., Gut P. and Aebersold R. (2019). Generation of a zebrafish SWATH-MS spectral library to quantify 10,000 proteins. Scientific Data 6, 190011 10.1038/sdata.2019.11 - DOI - PMC - PubMed

Publication types

MeSH terms