. 2020 Jun 3;12(546):eaaz0463.
doi: 10.1126/scitranslmed.aaz0463.

Immune landscapes predict chemotherapy resistance and immunotherapy response in acute myeloid leukemia

Affiliations

Immune landscapes predict chemotherapy resistance and immunotherapy response in acute myeloid leukemia

Jayakumar Vadakekolathu et al. Sci Transl Med. .

Abstract

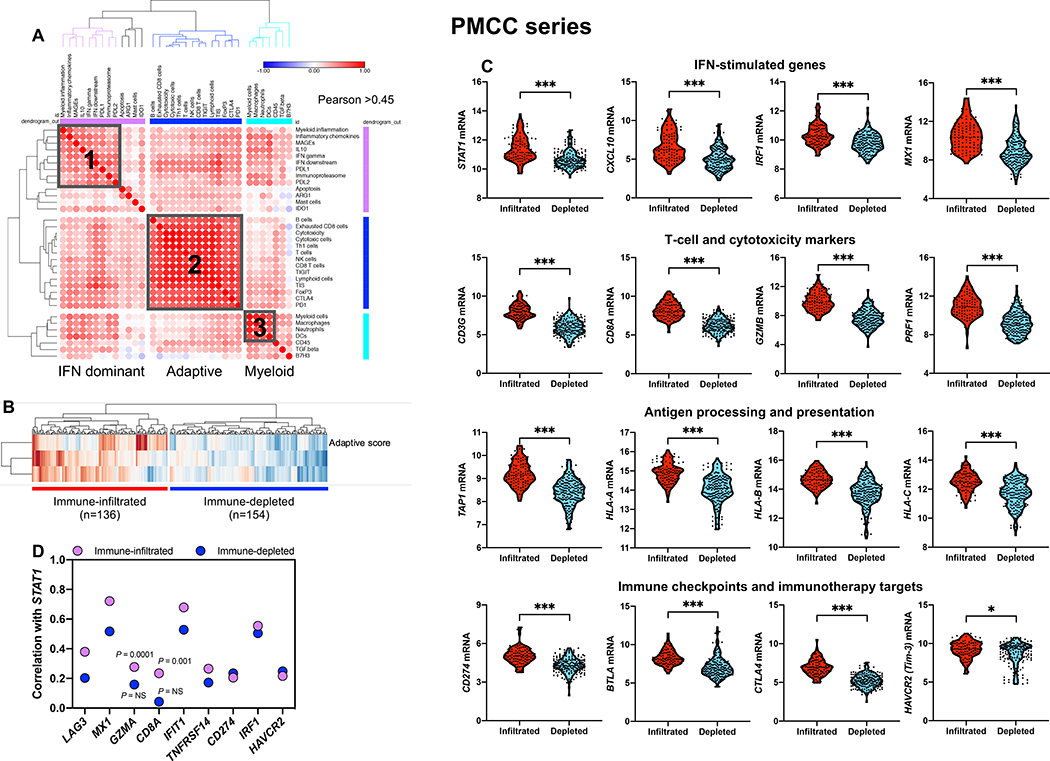
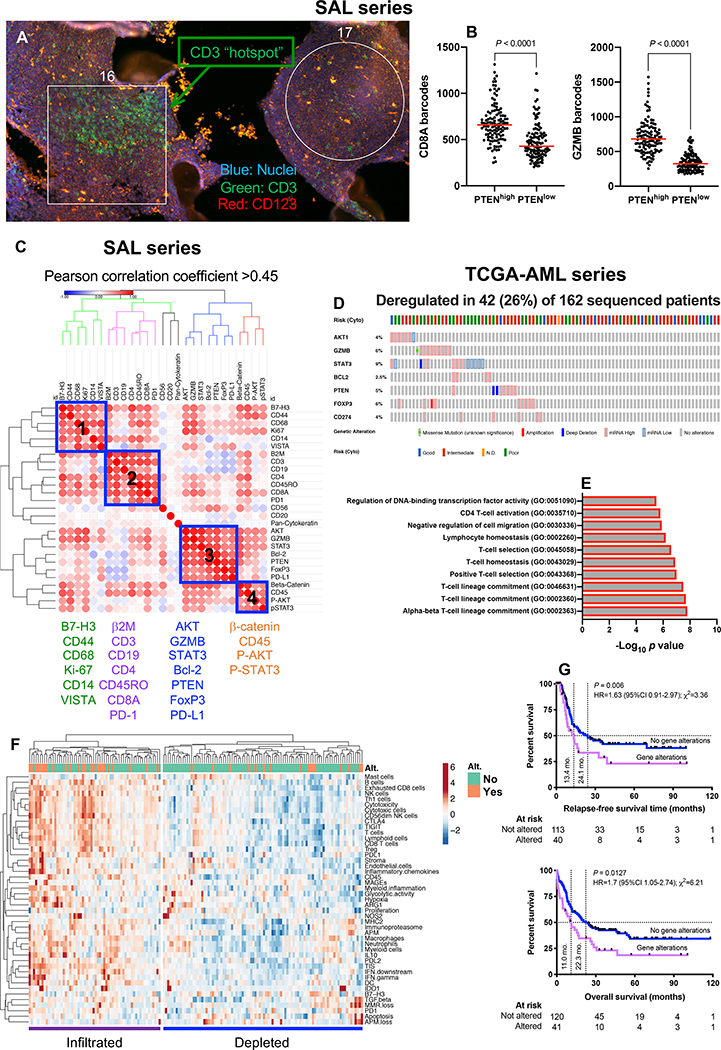
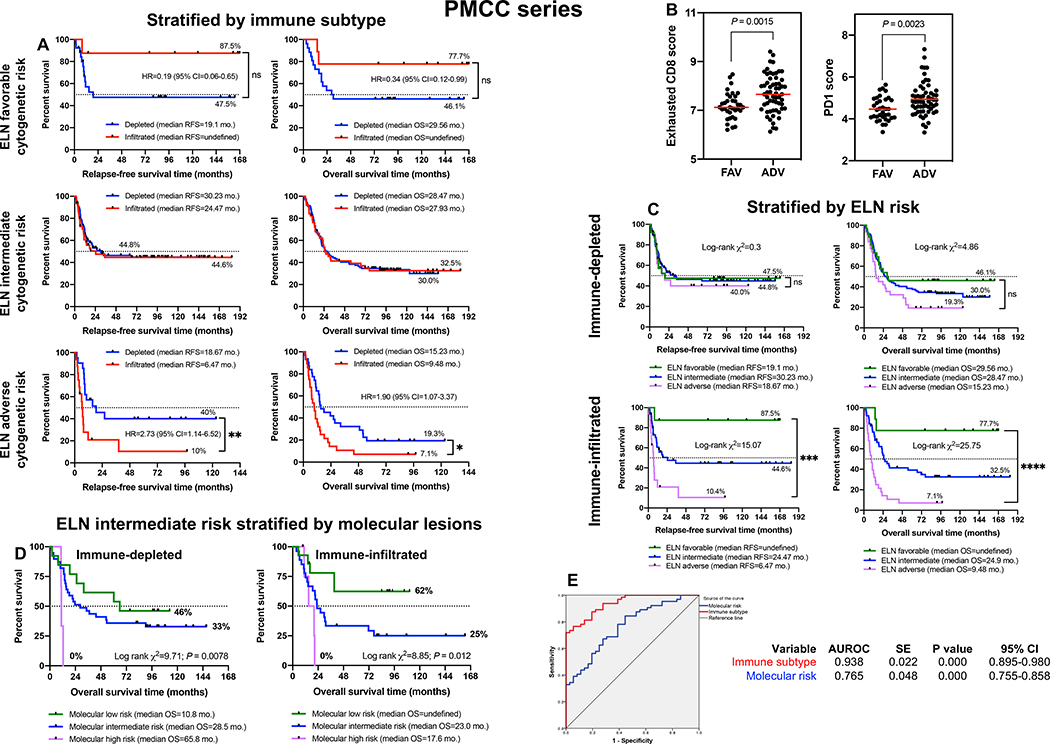
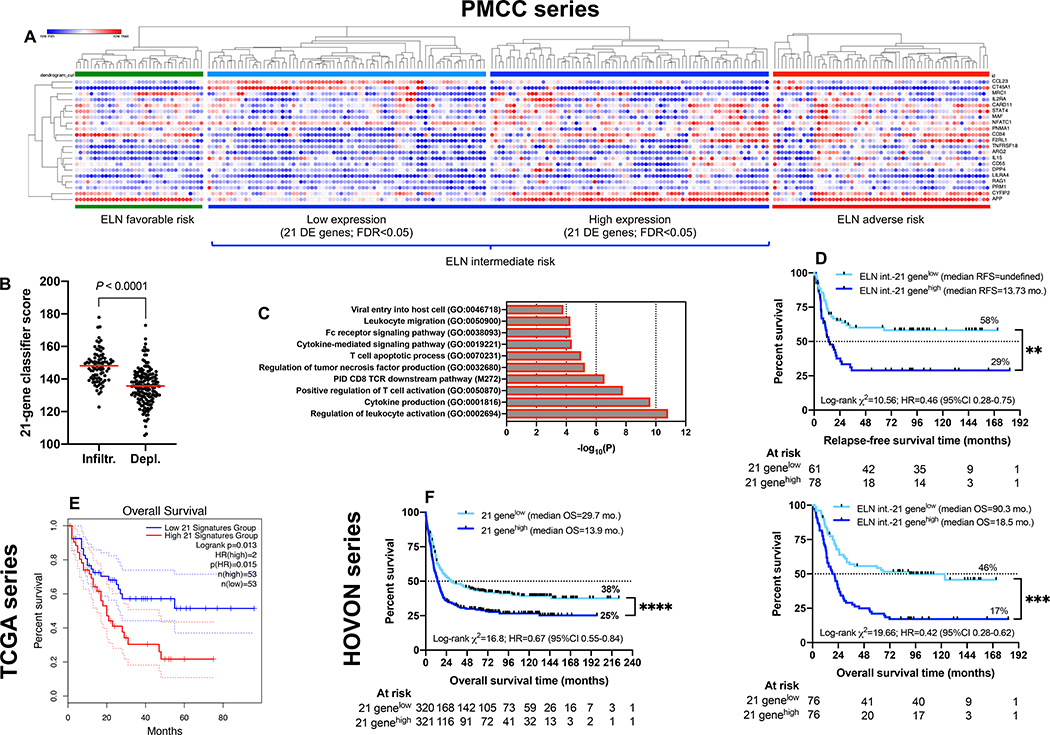
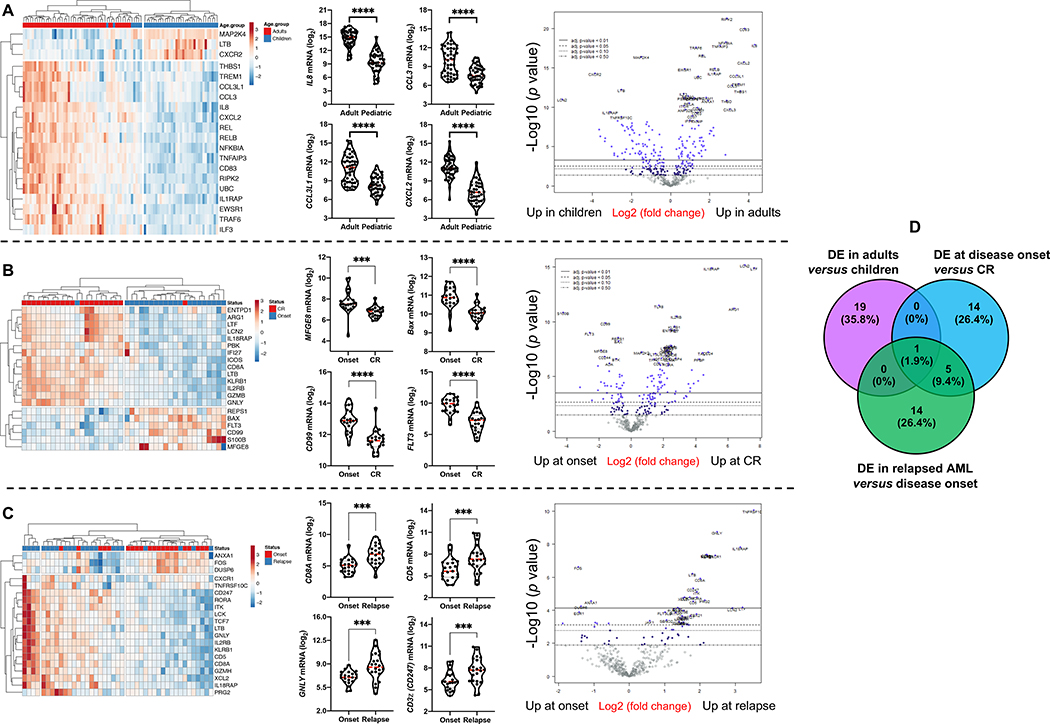
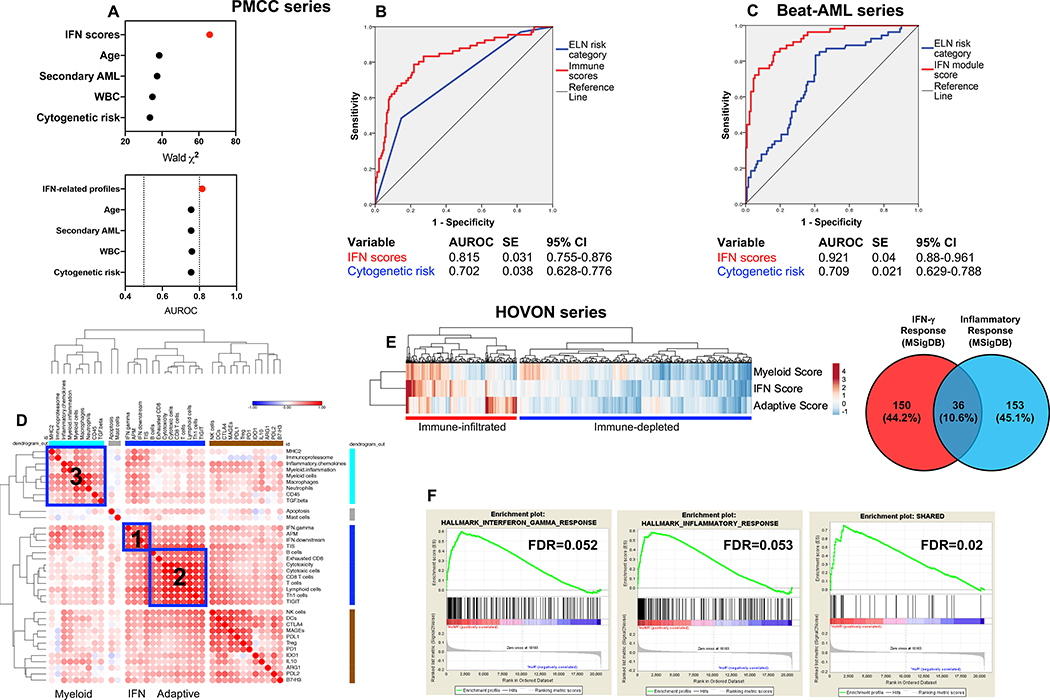
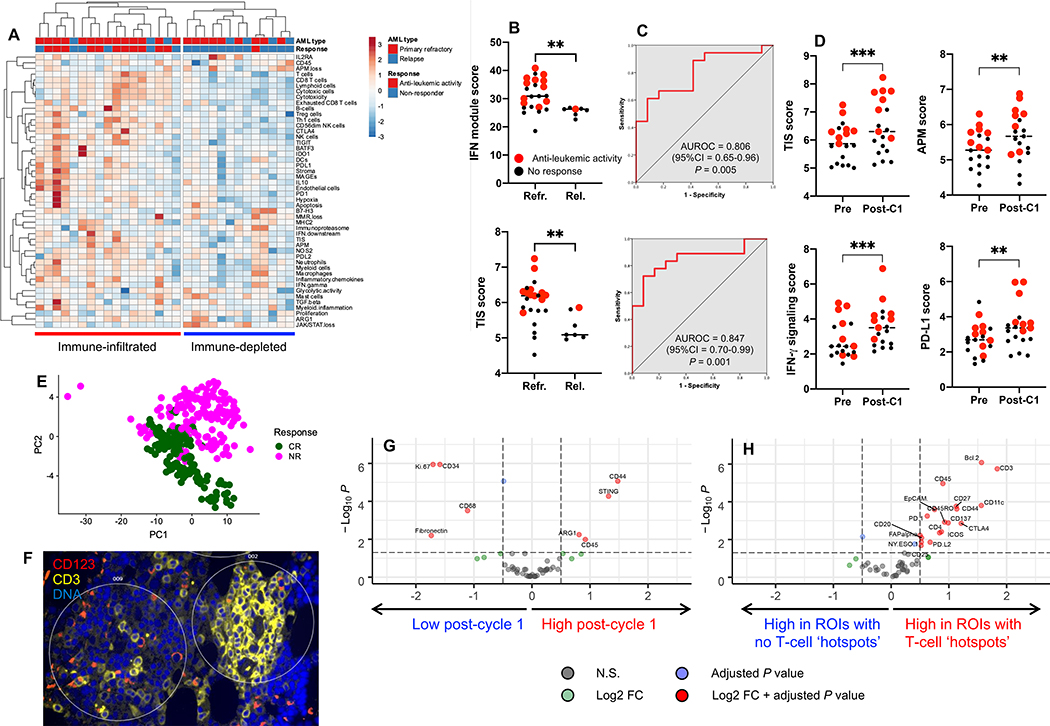
Acute myeloid leukemia (AML) is a molecularly and clinically heterogeneous hematological malignancy. Although immunotherapy may be an attractive modality to exploit in patients with AML, the ability to predict the groups of patients and the types of cancer that will respond to immune targeting remains limited. This study dissected the complexity of the immune architecture of AML at high resolution and assessed its influence on therapeutic response. Using 442 primary bone marrow samples from three independent cohorts of children and adults with AML, we defined immune-infiltrated and immune-depleted disease classes and revealed critical differences in immune gene expression across age groups and molecular disease subtypes. Interferon (IFN)-γ-related mRNA profiles were predictive for both chemotherapy resistance and response of primary refractory/relapsed AML to flotetuzumab immunotherapy. Our compendium of microenvironmental gene and protein profiles provides insights into the immuno-biology of AML and could inform the delivery of personalized immunotherapies to IFN-γ-dominant AML subtypes.


Conflict of interest statement

Competing interests

John Muth, Jan Davidson-Moncada: Employees, MacroGenics Inc., Rockville, MD, USA; Sarah E. Church, Sarah E. Warren, Yan Liang, Thomas H. Smith, Michael D. Bailey, James Gowen-MacDonald: Employees, NanoString Technologies Inc., Seattle, WA, USA; The other authors have no competing interests to disclose.

Figures

Fig. 1:
Fig. 1:. Immune gene sets stratify bone marrow samples from patients with newly diagnosed AML.
A) Unsupervised hierarchical clustering (Euclidean distance, complete linkage) of the correlation matrix of immune and biological activity signatures identifies co-expression patterns (grey boxes) of immune gene sets (correlation value color-coded per the legend, where blue denotes a Pearson correlation coefficient of −1.0 and red indicates a Pearson correlation coefficient of 1.0) in the bone marrow (BM) microenvironment of patients with AML (PMCC cohort; n=290), namely, IFN-dominant, adaptive and myeloid gene modules. Immune cell type (23) and signature scores (22) were calculated from mRNA expression as pre-defined linear combinations (weighted averages) of biologically relevant gene sets. Morpheus, an online tool developed at the Broad Institute (MA, USA) was used for data analysis and visualization. B) IFN-dominant, adaptive and myeloid scores in aggregate stratify patients with newly diagnosed AML into two distinct clusters, which are referred in this study as immune-infiltrated and immune-depleted (25). ClustVis, an online tool for clustering of multivariate data, was used for data analysis and visualization (71). C) Violin plots summarizing the expression of IFN-stimulated genes (ISGs), T-cell and cytotoxicity markers, negative immune checkpoints, genes implicated in antigen processing and presentation, and immunotherapy targets in AML cases with an immune-infiltrated and immune-depleted tumor microenvironment (TME). Data were compared using the Mann-Whitney U test for unpaired data (two-sided). *P < 0.05; ***P < 0.0001. D) Spearman correlation coefficients between STAT1, ISGs [IRF1, MX1, IFIT1, TNFRSF14, PD-L1 (CD274)], surrogate markers for cytotoxic T cells (CD8A, GZMA) and negative immune checkpoints [LAG3, HAVCR2 (Tim-3)] under conditions of high and low immune infiltration.
Fig. 2:
Fig. 2:. Multiplexed protein detection with GeoMx DSP identifies prognostic signatures in immune-infiltrated AML.
A) CD3 hotspots (green fluorescence) in representative regions of interest (ROIs) from a bone marrow (BM) trephine biopsy obtained at time of AML diagnosis (SAL series). B) Association between PTEN and CD8/GZMB expression in geometric ROIs (n=240) from 10 BM FFPE sections (median split of PTEN barcode counts). Comparisons of CD8 and GZMB expression between PTENhigh and PTENlow ROIs were performed using the Mann-Whitney U test for unpaired data (two-sided). C) Correlation matrix of protein expression in BM biopsies from 10 patients with newly diagnosed AML (SAL series). Protein expression data was subjected to unsupervised hierarchical clustering. Heatmaps were built using Morpheus with blue boxes denoting four distinct protein co-expression patterns (Pearson correlation coefficient >0.45) or signatures (SIG). D) Abnormalities in SIG3 genes (mRNA upregulation, gene amplification, deep deletion and mis-sense mutations, relative to the gene’s expression distribution in all profiled AML samples) in TCGA cases. Data were retrieved, analyzed and visualized using cBioPortal. Abnormalities in only one gene utilized in the query (by default, non-synonymous mutations, fusions, amplifications and deep deletions) were sufficient to define that particular patient sample as “altered”. E) GO enrichment analysis. For the gene list submitted to metascape.org, pathway and process enrichment analyses were carried out using all genes in the genome as the enrichment background. Terms with a P value < 0.01, a minimum count of 3, and an enrichment factor >1.5 (defined as the ratio between the observed counts and the counts expected by chance) were collected and grouped into clusters based on their membership similarities. F) Heatmap of immune cell type-specific scores and biological activity scores in TCGA-AML cases with and without abnormalities (Alt.) of SIG3 genes. ClustVis was used for data analysis and visualization (71). G) Kaplan-Meier estimates of relapse-free survival (RFS) and overall survival (OS) in TCGA-AML patients with (red line) and without (blue line) abnormalities of SIG3 genes. HR = hazard ratio. Survival curves were compared using a log-rank (Mantel-Cox) test.
Fig. 3:
Fig. 3:. Clinical correlates of immune profiles in patients with newly diagnosed AML.
A) Stratification of patient survival (PMCC cohort; n=290) within each ELN cytogenetic risk category by immune subtype (immune-infiltrated and immune-depleted). Kaplan-Meier estimates of RFS and OS are shown. Survival curves were compared using a log-rank (Mantel-Cox) test. *P < 0.05; **P < 0.01. HR=hazard ratio; CI=confidence interval. B) Expression of PD1 and markers of CD8+ T-cell exhaustion across cytogenetically defined patient categories. Data were compared using the Kruskal-Wallis test for unpaired determinations. FAV=favorable ELN risk; INT=intermediate ELN risk; ADV=adverse ELN risk. C) Cytogenetically defined categories stratify survival in patients with immune-infiltrated AML. Kaplan-Meier estimates of RFS and OS are shown. Survival curves were compared using a log-rank (Mantel-Cox) test. ***P < 0.001. D) Molecularly defined categories stratify survival in ELN intermediate AML cases (n=100) with immune-infiltrated and immune-depleted mRNA profiles. Patients were subclassified into molecular low risk (NPM1 mutations without FLT3-ITD), molecular intermediate risk (NPM1 wild-type without FLT3-ITD or with low FLT3-ITD allelic ratio) and molecular high risk (NPM1 wild-type with FLT3-ITD), as previously reported (31). Kaplan-Meier estimates of OS are shown. Survival curves were compared using a log-rank (Mantel-Cox) test. ***P < 0.001. E) AUROC curve measuring the predictive ability of molecular risk (blue curve) and immune subtype (red curve) for OS. SE=standard error; CI=confidence interval. AUROC=1.0 would denote perfect prediction and AUROC=0.5 would denote no predictive ability.
Fig. 4:
Fig. 4:. A 21-gene classifier stratifies survival in ELN-intermediate risk AML (n=100).
A) Expression of the 21 differentially expressed (DE) genes across the PMCC discovery cohort (unsupervised hierarchical clustering; Euclidean distance; complete linkage). FDR=false discovery rate. Morpheus was used for data analysis and visualization. B) Expression of the 21 DE genes in patients with immune-infiltrated and immune-depleted AML. Data were compared using the Mann-Whitney U test for unpaired determinations. Red bars indicate median values. C) DE genes between favorable and adverse-risk AML were mapped to gene ontology (GO) biological processes and pathways using Metascape.org. D) Kaplan-Meier estimate of RFS and OS in patients with ELN intermediate-risk AML stratified by the 21-gene classifier. Survival curves were compared using a log-rank (Mantel-Cox) test. HR=hazard ratio; CI=confidence interval. **P < 0.01; ***P < 0.001. E) Kaplan-Meier estimate of OS in TCGA AML cases (first independent validation cohort) stratified by the 21-gene classifier (median split of gene expression values). Data were accessed, analyzed and visualized through the Gene Expression Profiling Interactive Analysis (GEPIA) portal (http://gepia2.cancer-pku.cn/#survival) (72). Survival curves were compared using a log-rank (Mantel-Cox) test. F) Kaplan-Meier estimate of OS in HOVON AML cases (second independent validation cohort) stratified by the 21-gene classifier (median split of gene expression values). Survival curves were compared using a log-rank (Mantel-Cox) test. ****P < 0.0001.
Fig. 5:
Fig. 5:. Differentially expressed immune genes across age groups and disease stages.
A) Top 20 differentially expressed (DE) immune genes between childhood (n=34) and adult AML cases (n=46). ClustVis was used for data analysis and visualization. Violin plots summarize the expression of relevant chemokine genes. Data were compared using the Mann-Whitney U test for paired determinations. Volcano plots of DE genes were generated using the nSolver software package. ****P < 0.0001. B) Top 20 DE immune genes between matched BM samples from 22 adult patients (SAL cohort) at diagnosis and achievement of complete remission (CR). Data were compared using the Mann-Whitney U test for paired determinations. Volcano plots of DE genes were generated using the nSolver software package. ***P < 0.001; ****P < 0.0001. Data were compared using the Mann-Whitney U test for paired determinations. C) Top 20 DE immune genes between matched BM samples from 22 adult patients (SAL cohort) at diagnosis and disease relapse. Data were compared using the Mann-Whitney U test for paired determinations. Volcano plots of DE genes were generated using the nSolver software package. **P < 0.01; ***P < 0.001. D) Venn diagram showing overlap in DE genes between children and adults with AML, and patients at disease onset, achievement of CR and relapse.
Fig. 6:
Fig. 6:. IFN-related mRNA profiles predict therapeutic resistance.
A) Binary logistic regression predicting therapeutic response from IFN-related scores and conventional prognosticators, i.e., ELN cytogenetic risk category, WBC count at diagnosis, disease type (primary versus secondary AML), and patient age at diagnosis (PMCC discovery cohort). AUROC=area under receiver operating characteristic. The dotted line indicates currently accepted thresholds (>0.80) of AUROC with good predictive ability in AML (49). B) AUROC curves measuring the predictive ability of ELN cytogenetic risk and IFN-related scores for therapeutic response (PMCC discovery cohort; n=290). SE=standard error; CI=confidence interval. AUROC=1.0 would denote perfect prediction and AUROC=0.5 would denote no predictive ability. C) AUROC curves measuring the predictive ability of ELN cytogenetic risk and IFN-related scores for therapeutic response in Beat AML trial specimens (validation cohort). SE=standard error; CI=confidence interval. D) Unsupervised hierarchical clustering (Euclidean distance, complete linkage) of the correlation matrix of immune and biological activity signatures identifies co-expression patterns of immune gene sets (correlation value color-coded per the legend; Pearson correlation coefficient >0.45; blue boxes) in the bone marrow (BM) microenvironment of AML patients in the HOVON series (n=618 cases with therapy response and ELN cytogenetic risk information). E) IFN-dominant, adaptive and myeloid scores in patients in the HOVON series. The Venn diagram shows the overlap between curated hallmark gene sets linked to IFN-γ responses (n=186) and inflammatory responses (n=189). MSigDB=Molecular Signature Database. F) Gene set enrichment analysis (GSEA) plots representing the normalized enrichment score (NES) of hallmark IFN-γ-response genes, inflammatory response genes and a subset of overlapping genes (n=36) between IFN-γ and inflammatory gene sets in AML patients in the HOVON series who failed to respond to induction chemotherapy. Gene sets were downloaded from the MSigDB. Each run was performed with 1,000 permutations. FDR=false discovery rate.
Fig. 7:
Fig. 7:. Immune subtypes associate with response to flotetuzumab immunotherapy.
A) Unsupervised hierarchical clustering (Euclidean distance, complete linkage) of immune and biological activity signatures in the BM microenvironment of patients with relapsed/refractory AML (n=30) receiving flotetuzumab immunotherapy in the CP-MGD006–01 clinical trial (NCT#02152956). Anti-leukemic response was defined as detailed in Materials and Methods. B) IFN-module and tumor inflammation signature (TIS) scores in baseline BM samples from patients with primary refractory and relapsed AML. Red dots denote patients with evidence of anti-leukemic activity of flotetuzumab. Horizontal lines indicate median values. Comparisons were performed using the Mann-Whitney U test for unpaired data (two-sided). **P < 0.01. C) Area under receiver operating characteristic (AUROC) curves measuring the predictive ability of the IFN-module score and TIS scores for therapeutic response to flotetuzumab. CI=confidence interval. D) Immune activation in the TME during flotetuzumab treatment (matched BM samples from 19 patients). Red dots denote patients with evidence of flotetuzumab anti-leukemic activity. Horizontal lines indicate median values. Comparisons were performed with the Mann-Whitney U test for paired data (two-sided). Pre=baseline. C1=cycle 1. **P < 0.01. ***P < 0.001. E) Principal component analysis (PCA) of GeoMx DSP housekeeping-normalized barcode counts for 52 proteins from 11 pre-treatment and 8 matched post-cycle 1 (C1) BM samples with 5–35 regions of interest (ROIs) profiling the entire FFPE biopsy (Fig. S12). Points are colored by no response (NR; pink) or complete response (CR; green). F) Identification of CD3 hotspots in ROIs from a BM biopsy of a representative patient who achieved CR after flotetuzumab immunotherapy. CD3+ T cells are shown in yellow. G) Differential expression of immuno-oncology (IO)-related proteins between baseline and post-C1 FFPE BM biopsies from two patients achieving CR after flotetuzumab immunotherapy. Analysis was performed using a linear mixed effect model. Vertical dotted lines represent ±0.5 log2 fold change (FC) and the horizontal dotted line indicates a P value of 0.05. NS=not significant. H) Differential expression of IO-related proteins between ROIs with or without CD3 hotspots in two patient samples after 1 cycle of flotetuzumab who achieved CR. Analysis was performed using a linear mixed effect model. Vertical dotted lines represent ±0.5 log2 fold-change and the horizontal dotted line indicates a P value of 0.05.

References

    1. Dohner H, Weisdorf DJ, Bloomfield CD, Acute myeloid leukemia. N Engl J Med 373, 1136–1152 (2015). - PubMed
    1. Papaemmanuil E, Gerstung M, Bullinger L, Gaidzik VI, Paschka P, Roberts ND, Potter NE, Heuser M, Thol F, Bolli N, Gundem G, Van Loo P, Martincorena I, Ganly P, Mudie L, McLaren S, O’Meara S, Raine K, Jones DR, Teague JW, Butler AP, Greaves MF, Ganser A, Dohner K, Schlenk RF, Dohner H, Campbell PJ, Genomic classification and prognosis in acute myeloid leukemia. N Engl J Med 374, 2209–2221 (2016). - PMC - PubMed
    1. Khwaja A, Bjorkholm M, Gale RE, Levine RL, Jordan CT, Ehninger G, Bloomfield CD, Estey E, Burnett A, Cornelissen JJ, Scheinberg DA, Bouscary D, Linch DC, Acute myeloid leukaemia. Nat Rev Dis Primers 2, 16010 (2016). - PubMed
    1. Coombs CC, Tallman MS, Levine RL, Molecular therapy for acute myeloid leukaemia. Nat Rev Clin Oncol 13, 305–318 (2016). - PMC - PubMed
    1. Binnewies M, Roberts EW, Kersten K, Chan V, Fearon DF, Merad M, Coussens LM, Gabrilovich DI, Ostrand-Rosenberg S, Hedrick CC, Vonderheide RH, Pittet MJ, Jain RK, Zou W, Howcroft TK, Woodhouse EC, Weinberg RA, Krummel MF, Understanding the tumor immune microenvironment (TIME) for effective therapy. Nat Med 24, 541–550 (2018). - PMC - PubMed

Publication types

Substances