. 2020 Jul 15;205(2):335-345.
doi: 10.4049/jimmunol.1900853. Epub 2020 Jun 3.

Activation of the Tec Kinase ITK Controls Graded IRF4 Expression in Response to Variations in TCR Signal Strength

Affiliations

Activation of the Tec Kinase ITK Controls Graded IRF4 Expression in Response to Variations in TCR Signal Strength

James M Conley et al. J Immunol. .

Abstract

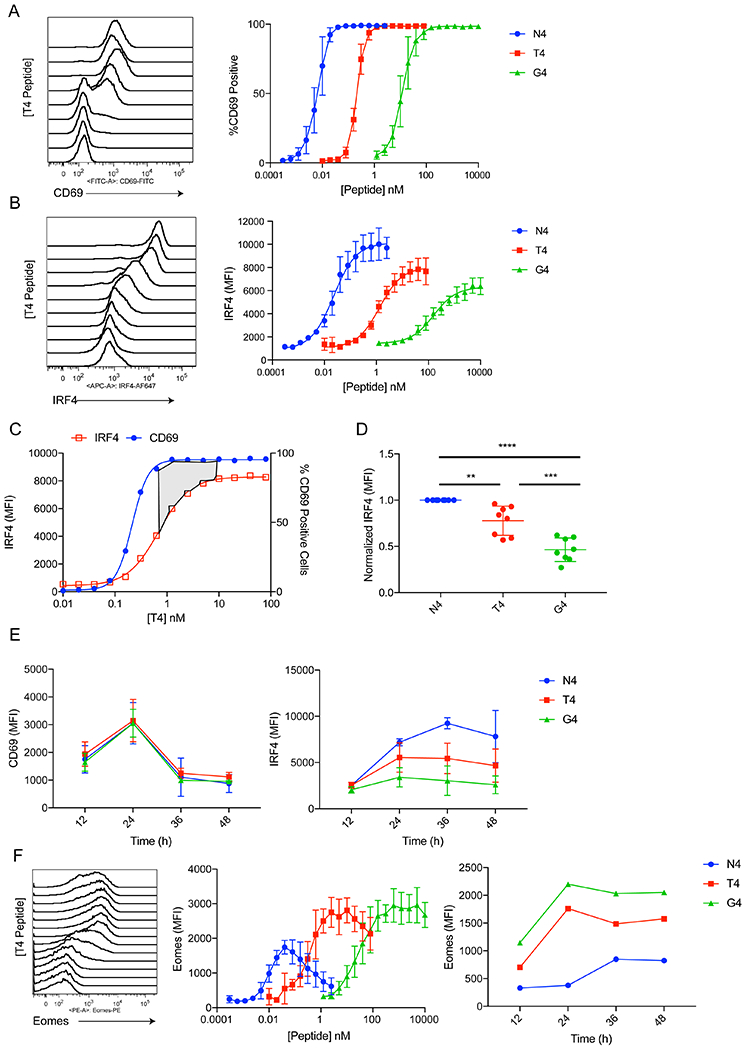
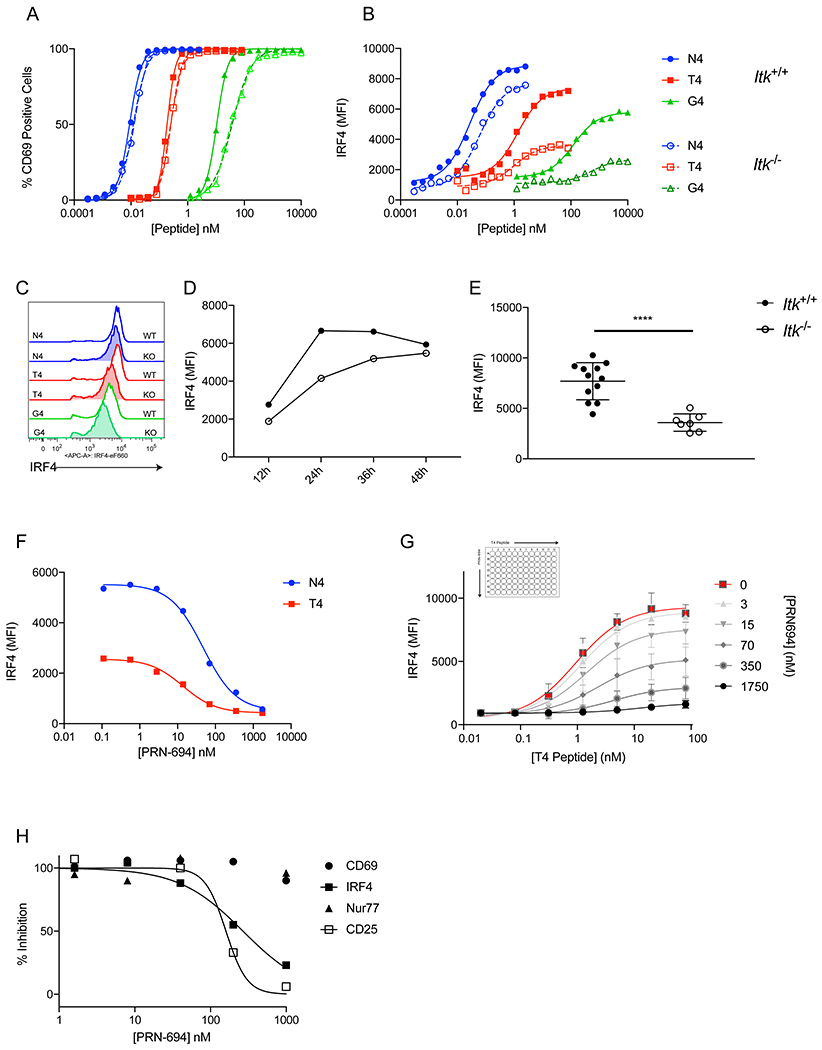
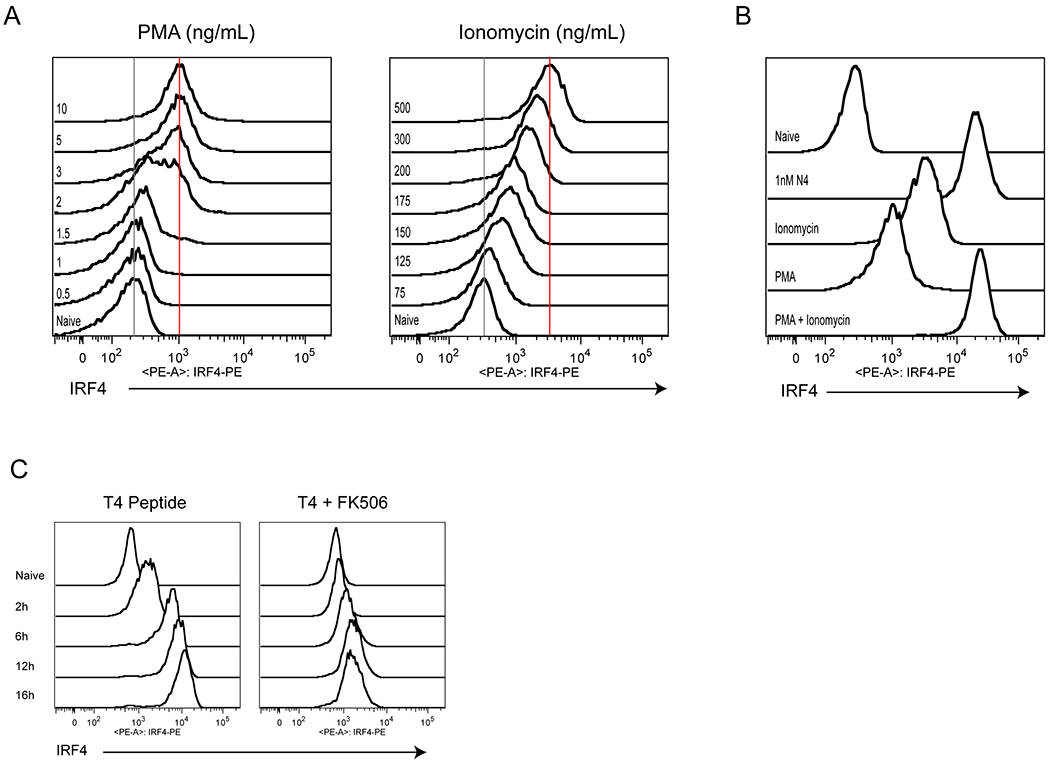
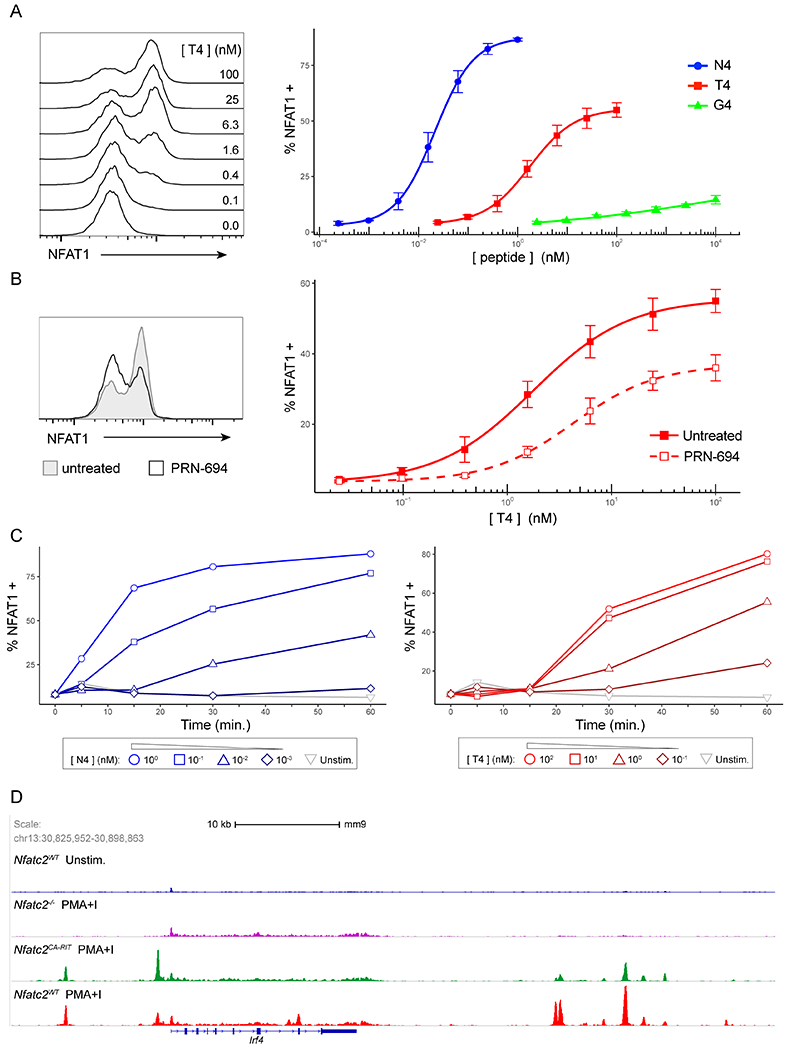
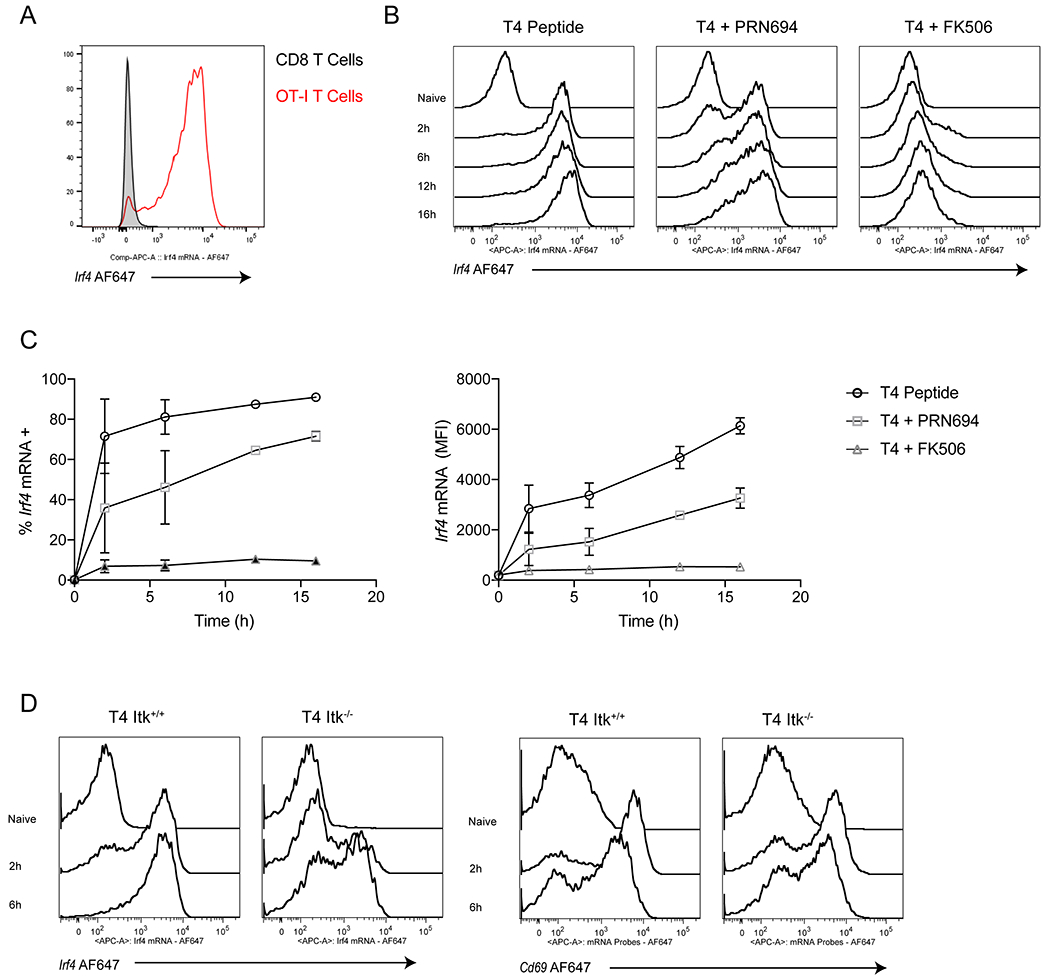
TCR signal strength is critical for CD8+ T cell clonal expansion after Ag stimulation. Levels of the transcription factor IRF4 control the magnitude of this process through the induction of genes involved in proliferation and glycolytic metabolism. The signaling mechanism connecting graded TCR signaling to the generation of varying amounts of IRF4 is not well understood. In this study, we show that Ag potency regulates the kinetics but not the magnitude of NFAT1 activation in single mouse CD8+ T cells. Consequently, T cells that transduce weaker TCR signals exhibit a marked delay in Irf4 mRNA induction, resulting in decreased overall IRF4 expression in individual cells and increased heterogeneity within the clonal population. We further show that the activity of the tyrosine kinase ITK acts as a signaling catalyst that accelerates the rate of the cellular response to TCR stimulation, controlling the time to onset of Irf4 gene transcription. These findings provide insight into the function of ITK in TCR signal transduction that ultimately regulates IRF4 expression levels in response to variations in TCR signal strength.


Figures

Figure 1.
Figure 1.. CD69 and IRF4 respond differently to graded TCR signaling in activated CD8+ T cells.
(A) Representative histogram plots of CD69 staining on OT-I cells stimulated with different doses of T4 peptide for 24h. Cells were gated on live CD8+ TCRβ+. Plots of %CD69+ values are shown for all three peptides at right. (B) Representative histogram plots of IRF4 intracellular staining in OT-I cells stimulated with different doses of T4 peptide for 24h. Cells were gated on live CD8+ TCRβ+. Plots of IRF4 MFI values are shown for all three peptides at right. (C) IRF4 MFI and %CD69+ values for the T4 peptide dose response were plotted on the same graph. The area shaded in gray emphasizes the concentration of antigen that yields maximum CD69 expression but is still on the upslope for IRF4 expression. (D) IRF4 MFI values were normalized to N4 stimulation over multiple experiments. These data show results of stimulations with 1nM N4, 100nM T4, and 1μM G4, which are the relative concentrations eliciting maximum IRF4 expression for each peptide. ** p≤0.01, *** p≤0.001, **** p≤0.0001 (one-way ANOVA followed by Dunnett’s test for N4 comparisons. Unpaired student t test for T4 and G4 comparison) (E) OT-I T cells were stimulated for 12-48h with 1nM N4, 100nM T4, or 1μM G4. MFI values for CD69 (left) and IRF4 (right) are plotted over time. (F) OT-I cells were treated with varying doses of N4, T4, or G4 peptides for 24h. Representative histograms of Eomes intracellular staining are shown for the T4 peptide (left). Eomes MFI is plotted for each peptide dose (middle). Cells were treated with 1nM N4, 100nM T4, or 1μM G4 from 12-48h and MFI for each peptide is plotted over time. Data are representative of three to five experiments.
Figure 2.
Figure 2.. ITK inhibition reduces maximum IRF4 expression in CD8+ T cells in a graded manner.
(A-B) OT-I WT (Itk+/+) or OT-I Itk−/− (Itk−/−) T cells were stimulated each peptide for 24h at multiple doses. %CD69+ (A) and IRF4 MFI (B) are plotted for each peptide concentration. (C) Representative histograms of IRF4 intracellular staining for 1nM N4, 100nM T4, and 1μM G4 peptide stimulations of Itk+/+ or Itk−/− cells. (D) Itk+/+ or Itk−/− OT-I cells were stimulated with 100nM T4 peptide at timepoints from 12-48h, and IRF4 MFI is plotted. (E) IRF4 MFI values of Itk+/+ or Itk−/− cells stimulated with 100nM T4 for 24h. **** p≤0.0001 (unpaired student t test) (F) OT-I T cells were stimulated with 1nM N4 and 100nM T4 peptide while simultaneously treated with varying doses of the ITK/RLK inhibitor PRN694 for 24h. Cells were stained for intracellular IRF4 and MFI of IRF4 staining under each condition is displayed. (G) OT-I T cells were stimulated with a range of doses of T4 peptide in a matrix using varying doses of PRN694. After 24h the cells were stained for IRF4, and the IRF4 MFI for each condition is displayed. Each curve represents a dose response of T4 peptide at a single concentration of PRN694. (H) OT-I T cells were stimulated with 100nM T4 peptide with varying doses of PRN694 for 24h. The cells were stained for IRF4, CD69, and CD25. For Nur77, the Nur77-GFP reporter was used. The MFI values were normalized to a positive and negative control to obtain % Inhibition. Data are representative of three to five experiments.
Figure 3.
Figure 3.. Calcium and calcineurin signaling drives graded IRF4 expression in CD8+ T cells.
(A) OT-I T cells were treated with varying doses of PMA or Ionomycin for 24h, and cells were stained for intracellular IRF4. Representative histograms of IRF4 staining are shown. (B) Representative histograms of IRF4 staining for OT-I cells left unstimulated (Naïve), or stimulated with 500ng/mL Ionomycin, 10ng/mL PMA, a combination of both, or 1nM N4 for 24h. (C) Representative histograms of IRF4 staining for OT-I cells treated with 100nM T4 for timepoints from 2-16h in the absence (left) or presence (right) of 100nM FK506. Data are representative of three experiments.
Figure 4.
Figure 4.. TCR signal strength and ITK activity drives digital NFAT activation in CD8+ T cells.
(A) Representative histograms of NFAT1 fluorescence in OT-I nuclei isolated after T cells were stimulated with B6 splenocytes pulsed with indicated doses of T4 peptide for 30m (left). Line plots of %NFAT1+ nuclei after 30m of stimulation with B6 splenocytes pulsed with indicated doses of either N4, T4 and G4 peptides (right). OT-I nuclei were identified as CellTrace Violet+ events. (B) Representative histograms of NFAT1 fluorescence in OT-I nuclei after cells were stimulated for 30m with B6 splenocytes pulsed with 25 nM T4 peptide with or without 50nM PRN694 treatment (left). Line plots of %NFAT1+ (nuclear NFAT) values are shown for the T4 peptide dose response with and without 50nM PRN694 treatment (right). Nuclei were gated on CellTrace Violet+ events. (C) Line plots of %NFAT1+ OT-I nuclei over a 60m timecourse after cells were stimulated B6 splenocytes pulsed with varying doses of either N4 (left) or T4 (right) peptides as indicated. (D) NFAT1 ChIP-Seq data (GSE64409) on activated CD8 T cells from Martinez et al (21) were visualized using IGV software and a snapshot was taken of the Irf4 locus. The data represents 4 samples: (1) WT T cells, transduced with Mock construct, unstimulated (2) Nfatc2−/− T cells, transduced with Mock construct, stimulated with PMA/Ionomycin for 1h (3) Nfatc2−/− T cells, transduced with CA-RIT-NFAT (constitutively active NFAT unable to bind AP-1), stimulated with PMA/Ionomycin for 1h (4) WT T cells, transduced with Mock construct, stimulated with PMA/Ionomycin for 1h. Data are representative of three or five experiments.
Figure 5.
Figure 5.. Reducing TCR strength, through ITK inhibition, delays Irf4 mRNA upregulation.
(A) OT-I T cells were labeled with CellTraceViolet and combined 5:1 with unlabeled peptide-pulsed APCs from B6 splenocytes. Representative histograms plots of Irf4 mRNA expression after 16h of 100nM T4 peptide stimulation. Cells are gates on live CD8+ TCRβ+ cells (+CellTraceViolet from OT-I mice and –CellTraceViolet from B6 mice.) (B-C) OT-I T cells were treated with 100nM T4 peptide for timepoints from 2-16h either alone or in the presence of 100nM PRN694 or 100nM FK506. (A) Representative histogram plots of Irf4 mRNA expression. (B) Data are plotted as %Irf4 mRNA positive (left) or as Irf4 mRNA MFI (right) over time. Cells are gates on live CD8+ TCRβ+ CellTraceViolet+ cells (C) Itk+/+ or Itk−/− cells OT-I T cells were treated with 100nM T4 peptide for 2 or 6h. Representative histograms for Irf4 and Cd69 mRNA expression are shown. Cells are gates on live CD8+ TCRβ+ CellTraceViolet+ cells Data are representative of three experiments.

References

    1. Zhang N, and Bevan MJ. 2011. CD8+ T Cells: Foot Soldiers of the Immune System. Immunity 35: 161–168. - PMC - PubMed
    1. Klein L, Kyewski B, Allen PM, and Hogquist KA. 2014. Positive and negative selection of the T cell repertoire: what thymocytes see (and don’t see). Nat Rev Immunol 14: 377–391. - PMC - PubMed
    1. Zehn D, Lee SY, and Bevan MJ. 2009. Complete but curtailed T-cell response to very low-affinity antigen. Nature 457: 211–214. - PMC - PubMed
    1. Andreotti AH, Joseph RE, Conley JM, Iwasa J, and Berg LJ. 2018. Multidomain Control Over TEC Kinase Activation State Tunes the T Cell Response. Annu. Rev. Immunol 36: 549–578. - PubMed
    1. Nayar R, Enos M, Prince A, Shin H, Hemmers S, Jiang J-K, Klein U, Thomas CJ, and Berg LJ. 2012. TCR signaling via Tec kinase ITK and interferon regulatory factor 4 (IRF4) regulates CD8+ T-cell differentiation. Proc Natl Acad Sci U.S.A 109: E2794–802. - PMC - PubMed

Publication types

Substances