. 2020 Jun 3;11(1):2799.
doi: 10.1038/s41467-020-16629-3.

Polyamine regulation of ion channel assembly and implications for nicotinic acetylcholine receptor pharmacology

Affiliations

Polyamine regulation of ion channel assembly and implications for nicotinic acetylcholine receptor pharmacology

Madhurima Dhara et al. Nat Commun. .

Abstract

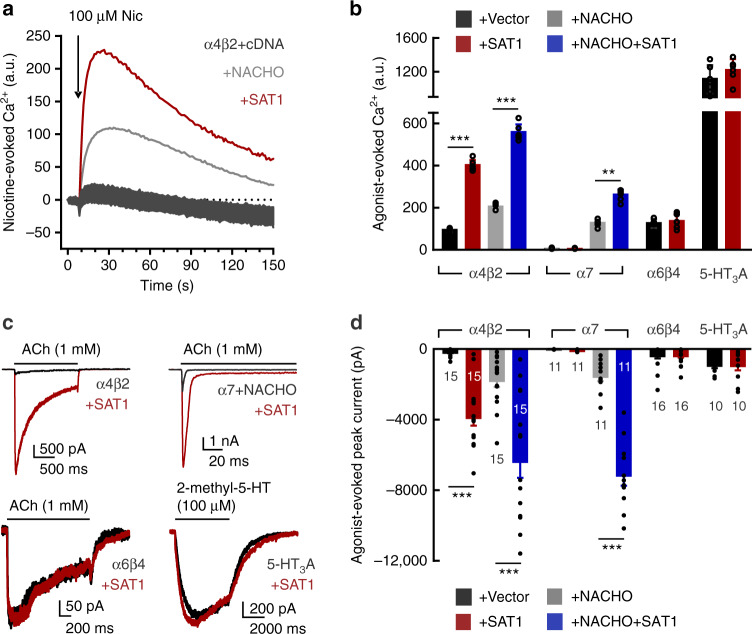
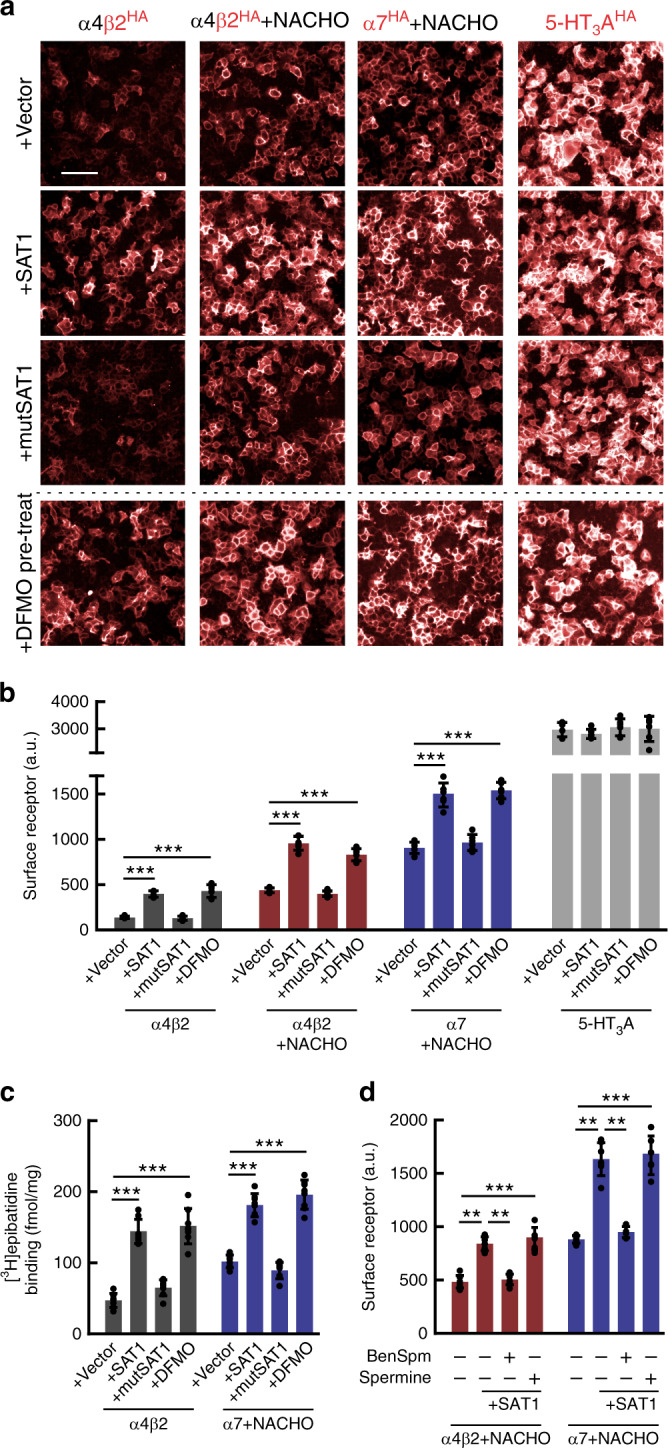
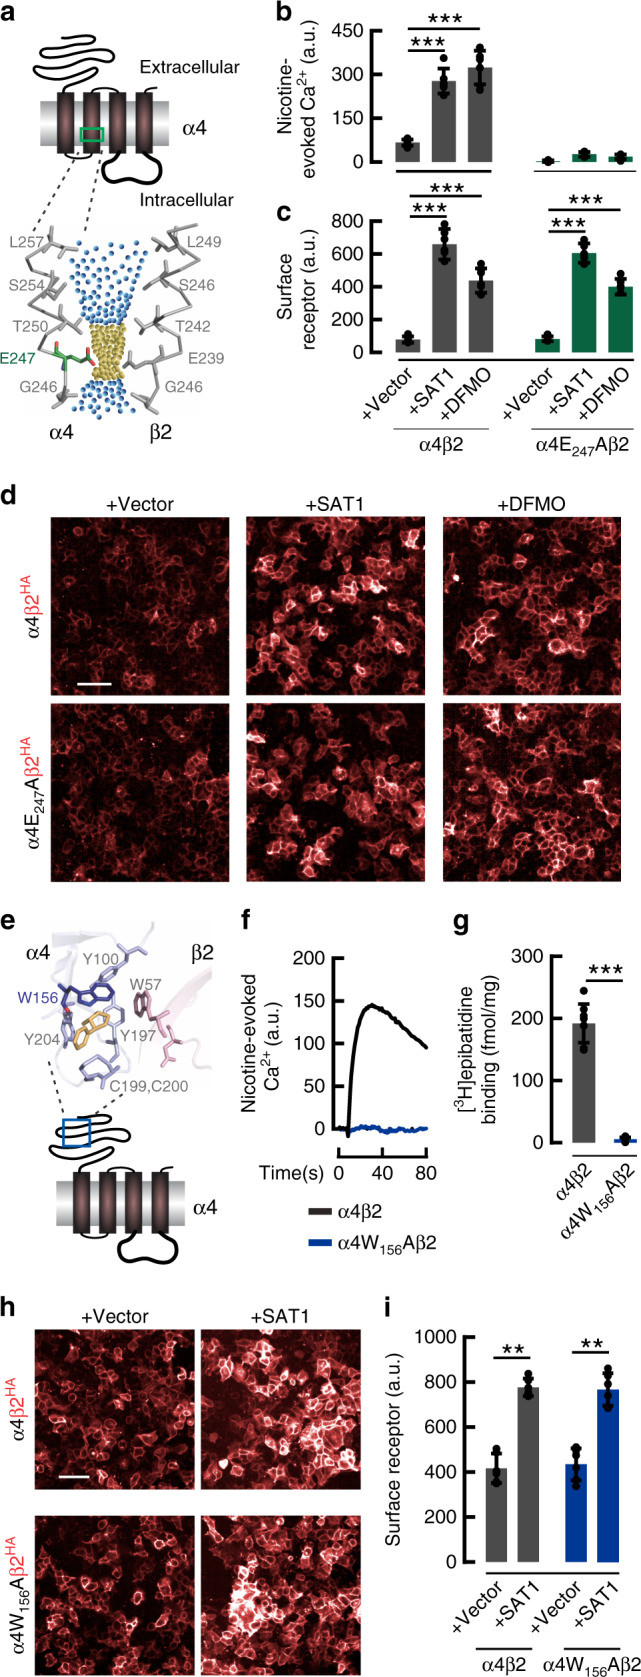
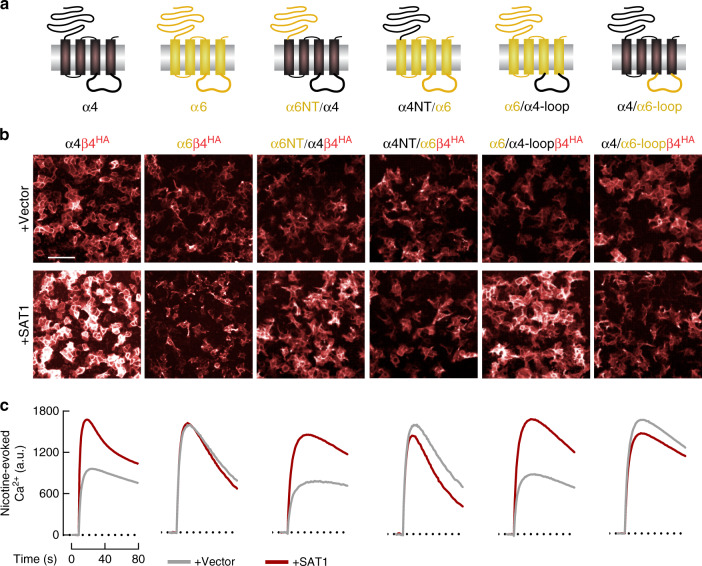
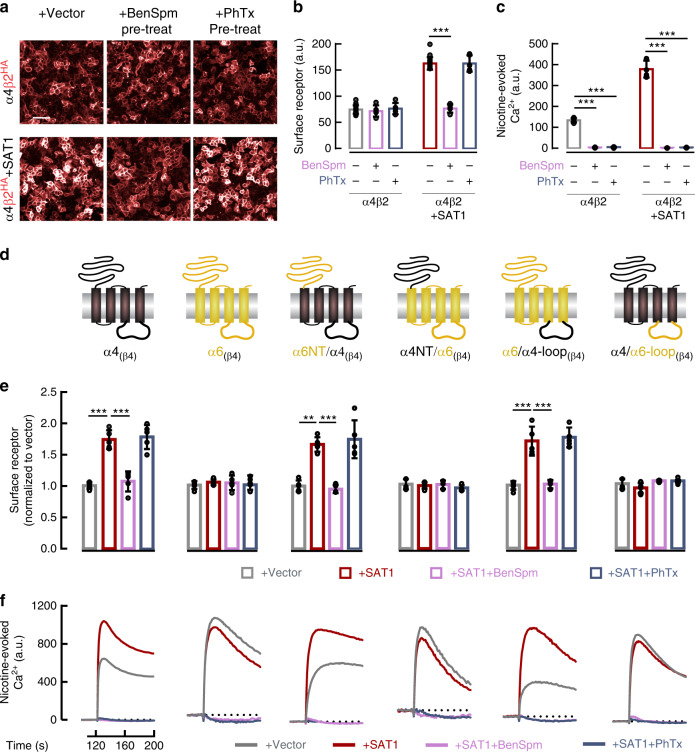
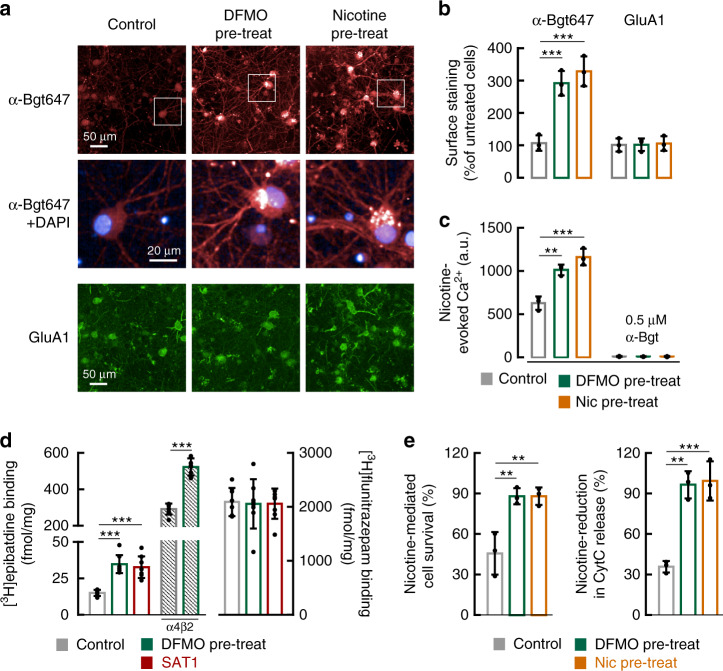
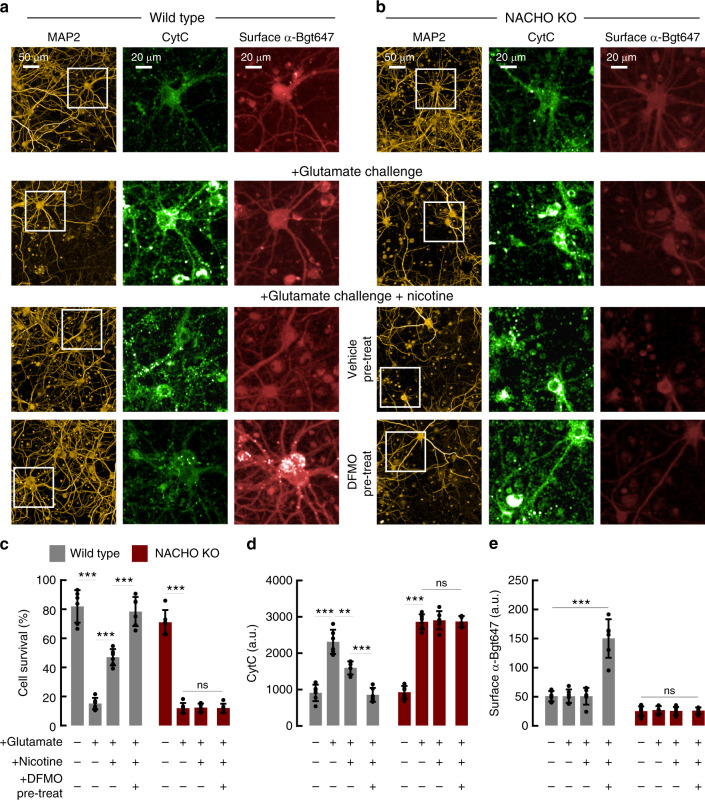
Small molecule polyamines are abundant in all life forms and participate in diverse aspects of cell growth and differentiation. Spermidine/spermine acetyltransferase (SAT1) is the rate-limiting enzyme in polyamine catabolism and a primary genetic risk factor for suicidality. Here, using genome-wide screening, we find that SAT1 selectively controls nicotinic acetylcholine receptor (nAChR) biogenesis. SAT1 specifically augments assembly of nAChRs containing α7 or α4β2, but not α6 subunits. Polyamines are classically studied as regulators of ion channel gating that engage the nAChR channel pore. In contrast, we find polyamine effects on assembly involve the nAChR cytosolic loop. Neurological studies link brain polyamines with neurodegenerative conditions. Our pharmacological and transgenic animal studies find that reducing polyamines enhances cortical neuron nAChR expression and augments nicotine-mediated neuroprotection. Taken together, we describe a most unexpected role for polyamines in regulating ion channel assembly, which provides a new avenue for nAChR neuropharmacology.


Conflict of interest statement

All contributing authors are full-time employees in Johnson and Johnson.

Figures

Fig. 1
Fig. 1. High throughput cDNA screening for enhancers of α4β2 function identifies SAT1.
a HEK293T cells in 384-well plates were co-transfected with α4-expressing and β2-expressing plasmids along with an individual cDNA (black traces) from a human ORF collection (Broad Institute). Cells were stimulated with 100 μM nicotine (Nic). The highest response occurred in the well containing SAT1 (red trace) and was twice the α4β2 + NACHO response (gray trace), which served as positive control. b Quantification (mean ± SD) of maximum Ca2+ signal upon agonist stimulation from HEK293T cells transfected as indicated (n = 6). Co-transfection of SAT1 significantly enhances Ca2+ signal in α4β2 (p < 1e−4), α4β2+NACHO (p < 1e−4) and α7+NACHO (p = 0.002) cells. For all α6β4 conditions, cells were co-transfected with plasmids encoding accessories BARP and SULT2B1. c Representative whole-cell current responses elicited from HEK cells co-transfected with GFP and cDNAs as indicated. d Summary graphs of agonist-evoked peak currents (mean ± SEM) from HEK293T cells transfected with indicated cDNA combinations. Similar to maximum Ca2+ signal, co-transfection of SAT1 boosts evoked currents mediated by α4β2 (p < 1e−4), α4β2+NACHO (p < 1e−4), α7+NACHO (p < 1e−4) but not α6β4 (p = 0.98) or 5-HT3A (p = 0.73). Numbers indicate number of transfected cells that were analyzed and were pooled from three independent cultures. **p < 0.01, ***p < 0.001, One-way ANOVA between the groups for α4β2 and α7. Mann–Whitney U test versus control for α6β4 and 5-HT3A. Source data for panel b and d are provided as a Source Data file.
Fig. 2
Fig. 2. By catalyzing polyamines, SAT1 promotes surface expression and assembly of nAChRs.
a HEK293T cells were co-transfected with cDNAs encoding HA-tagged receptors and other plasmids as indicated. Some cells were pre-treated for 24 h with 1 mM DFMO. Immunofluorescent labeling of the extracellular HA-tag in unpermeabilized cells enabled visualization (red) of surface receptors. Scale bar = 50 μm. b Summary graph quantifies surface HA-labeling (n = 6). Co-transfection with wildtype SAT1, not its mutant version, promotes surface expression of α4β2 (p < 1e−4), α4β2+NACHO (p < 1e−4) and α7+NACHO (p < 1e−4) but not 5-HT3A (p = 0.84). Pre-treating cells with DFMO show comparable results. c Quantification of [3H]epibatidine binding to HEK293T cell membranes transfected and pre-treated with DFMO where indicated (n = 8). Similar to surface HA-labeling, SAT1 co-transfection and DFMO preincubation increase radioligand binding to α4β2 (p < 1e−4) and to α7+NACHO (p < 1e−4). d Quantification of surface α4β2-HA or α7-HA in HEK293T cells transfected with SAT1 and pretreated with BenSpm (n = 7) or spermine (n = 6) as indicted. Only BenSpm occludes SAT1 mediated increase of surface α4β2 (p = 1e−3) or α7 (p = 1e−3). Data in bd are presented as mean ± SD. **p < 0.01, ***p < 0.001, One-way ANOVA between the groups. Source data for panel bd are provided as a Source Data file.
Fig. 3
Fig. 3. Polyamine regulation of α4β2 assembly is mechanistically distinct from channel gating or agonist binding.
a Cartoon depicting α4 nAChR subunit. Enlarged view (bottom) highlights Glu247 in α4 TM2 critical for polyamine regulation of gating and Ca2+-permeability. Yellow spheres represent pore diameter >2.8 Å, blue spheres >5.6 Å. (PDB: 5KXI) b Quantification shows wild-type α4β2-mediated peak nicotine-evoked Ca2+ is enhanced in cells co-transfected with SAT1 (p < 1e−4) and pre-treated with DFMO (p < 1e−4). α4E247Aβ2 transfected cells have reduced nicotine-evoked Ca2+ (p = 0.01), which is not changed with SAT1 or DFMO (n = 6). c Summary graph (n = 6) and d. representative images of fluorescent anti-HA labeling of non-permeabilized HEK293T cells transfected as indicated and pretreated with DFMO where noted (Scale bar = 50 μm). Quantifications are displayed as mean ± SD. ***p < 0.001, One-way ANOVA between the groups. e Cartoon depicting α4 nAChR subunit. Enlarged view (top) highlights Trp156 in α4 that forms a cation-π interaction with nicotine (yellow). f Nicotine-evoked Ca2+ from wild-type α4β2 (black trace) or mutant α4W156Aβ2 (blue trace) (PDB: 5KXI). g Binding of [3H]epibatidine (10 nM) to HEK293T cell membranes is significantly reduced (p < 1e−5) in mutant α4W156Aβ2 co-transfected group compared with wild-type α4β2 (n = 8). h Fluorescent anti-HA labeling of non-permeabilized HEK293T cells transfected as indicated. Scale bar = 50 μm. i Quantification of surface labeling from h (n = 6). SAT1 enhances surface labeling of both α4β2 (p = 0.002) and α4W156Aβ2 (p = 0.002) receptors. NACHO cDNA was included for all receptor transfections in fi. Quantifications are means ± SD. **p < 0.01, ***p < 0.001, Mann–Whitney U test versus control was used for data shown in panel g, i. Source data for panels b, c, g and i are provided as a Source Data file.
Fig. 4
Fig. 4. The nAChR TM3-TM4 cytosolic loop determines regulation by SAT1.
a Schematics of chimeric α4-α6 constructs. b Fluorescent anti-HA labeling of non-permeabilized HEK293T cells co-transfected with cDNAs encoding α6, α4, α4-α6 chimeric constructs and extracellular HA-tagged β4 with or without SAT1 as indicated. All cDNA combinations contained BARP and SULT2B1. Scale bar = 50 μm c. Agonist-evoked Ca2+ traces from HEK293T transfected as indicated. The α4 cytosolic loop domain is necessary and sufficient for SAT1-mediated regulation for all chimeras. Note that data in b and c are quantified in Supplementary Figs. 4b, c.
Fig. 5
Fig. 5. Polyamine analogs regulate nAChR gating and assembly by distinct mechanisms.
a Fluorescent anti-HA labeling of non-permeabilized HEK293T cells transfected with cDNAs encoding extracellular HA-tagged β2 and α4 with or without SAT1. Scale bar = 50 μm. b Quantification of surface staining for α4β2 receptors with or without SAT1 and BenSpm or PhTx343 pre-treatment (n = 6). BenSpm occluded the SAT1-enhanced receptor surface expression (p < 1e−4) but PhTx343 had no effect (p = 0.86). c Nicotine-evoked Ca2+ signal was fully blocked by both BenSpm or PhTx343 (p < 1e−4) (n = 6). d Schematics of chimeric constructs of α4-α6. e Normalized anti-HA surface expression from cells transfected and treated with BenSpm or PhTx343 as indicated (n = 5). Only BenSpm occluded SAT1-mediated enhancement of surface receptor expression of α4β4 (p < 1e−4), α6NT/α4β4 (p < 1e−4) and α6/α4-loopβ4 (p < 1e−4). Both SAT1 and BenSpm effects on receptor surface expression required the α4 cytosolic loop. f Both BenSpm and PhTx343 fully inhibited nicotine-evoked Ca2+ in all receptor combinations. All cDNA combinations included BARP and SULT2B1. Quantifications are displayed as mean ± SD. ***p < 0.001, One-way ANOVA between the groups was used for panels b, c and e. Comprehensive dose-response studies are in Supplementary Fig. 5. Source data for panel b, c and e are provided as a Source Data file.
Fig. 6
Fig. 6. DFMO enhances both neuronal nAChRs and nicotine-mediated neuroprotection.
a Fluorescent labeling of non-permeabilized rat cortical neurons (DIV 20) shows upregulation of endogenous α-Bgt674 labeling in neurons pre-treated for six days with DFMO (5 mM) or nicotine (Nic; 100 μM) as indicated. Surface-labeling for α7 used α-Bgt647 (red) and insets (white squares) depict magnifications that include DAPI (blue). Double-labeling with α-GluA1 (green) served as control. b Quantification of surface α-Bgt647 shows increased staining with both DFMO and Nic (p < 1e−4), but no change was observed in surface GluA1 staining (p = 0.9). c Summary graph showing nicotine (100 μM) + PNU-12059615- (10 µM) evoked Ca2+ from rat cortical neurons (DIV 13) increases when pre-treated for six days with DFMO (p = 0.002) or nicotine (p = 0.0004). Responses were blocked by α-Bgt (0.5 μM). Data shown in B and C were averaged from 3 independent experiments each containing 6 independent samples. d Quantification of [3H]epibatidine (10 nM) and [3H]flunitrazepam (50 nM) binding to membranes from neurons pre-treated with DFMO or transduced with SAT1 show selective increase in [3H]epibatidine binding (p < 1e−4). One-way ANOVA compared to control. Neurons transduced with lentivirus expressing α4 and β2 showed much higher levels of [3H]epibatidine binding (hatched bars) (p < 1e−4, compared to un-transduced control), and these were further enhanced (p < 1e−4) with DFMO treatment (n = 8). e Acute application of nicotine (gray bars) partially reduced glutamate-mediated cell death (left panel) and mobilization of CytC (right panel). Pre-treating neurons for six days with DFMO (green, 5 mM) enhanced nicotine-mediated cell survival (p = 0.006) and decreased CytC mobilization (p = 0.001). Nicotine (orange, 100 μM) pre-treatment similarly enhanced nicotine-mediated neuroprotection. Data averaged from 3 independent experiments each containing 6 independent samples. Quantifications are displayed as mean ± SD. **p < 0.01, ***p < 0.001, One-way ANOVA between the groups for panels be. Source data for panels be are provided as a Source Data file.
Fig. 7
Fig. 7. DFMO promotes nicotine-mediated neuroprotection in a NACHO-dependent fashion.
a, b Images of cortical neurons (DIV 20) from wild-type (a) or NACHO KO (b) mice. As indicated, neurons were pretreated with DFMO (5 mM, 4th row) or and challenged with 30 μM glutamate (Glu, 2nd–4th row) in the absence (2nd row) or presence (3rd–4th row) of 100 μM nicotine. The cells were stained for MAP2 (left panel) and cytochrome-C (CytC middle panel) and surface α-Bgt647 (right panel). White squares indicate regions that are magnified. ce Graphs quantify neuronal survival (c), CytC (d) and surface α-Bgt647 (e) (n = 6). Acute nicotine increases cell survival (p < 1e−4) and reduces CytC mobilization (p = 0.0002) during glutamate toxicity in wild-type neurons, but not in NACHO KO neurons (p = 0.9). DFMO pre-treatment further promotes nicotine-mediated cell survival (p < 1e−4) and reduces CytC mobilization (p = 0.0002) in wildtype neurons. DFMO significantly enhances surface α-Bgt647 labeling of wild-type (p < 1e−4) but not of NACHO KO neurons (p = 0.9). **p < 0.01, ***p < 0.001, n.s = not significant, one-way ANOVA between the groups. Data displayed as mean ± SD. Source data for panel ce are provided as a Source Data file.

References

    1. Role LW, Berg DK. Nicotinic receptors in the development and modulation of CNS synapses. Neuron. 1996;16:1077–1085. - PubMed
    1. Gotti C, Clementi F. Neuronal nicotinic receptors: from structure to pathology. Prog. Neurobiol. 2004;74:363–396. - PubMed
    1. Lindstrom J. Nicotinic acetylcholine receptors in health and disease. Mol. Neurobiol. 1997;15:193–222. - PubMed
    1. Hogg RC, Raggenbass M, Bertrand D. Nicotinic acetylcholine receptors: from structure to brain function. Rev. Physiol., Biochem. Pharmacol. 2003;147:1–46. - PubMed
    1. Le Novere N, Corringer PJ, Changeux JP. The diversity of subunit composition in nAChRs: evolutionary origins, physiologic and pharmacologic consequences. J. Neurobiol. 2002;53:447–456. - PubMed

MeSH terms