. 2020 Aug;123(4):644-656.
doi: 10.1038/s41416-020-0912-9. Epub 2020 Jun 4.

Impact of hypoxia on chemoresistance of mesothelioma mediated by the proton-coupled folate transporter, and preclinical activity of new anti-LDH-A compounds

Affiliations

Impact of hypoxia on chemoresistance of mesothelioma mediated by the proton-coupled folate transporter, and preclinical activity of new anti-LDH-A compounds

Giovanna Li Petri et al. Br J Cancer. 2020 Aug.

Abstract

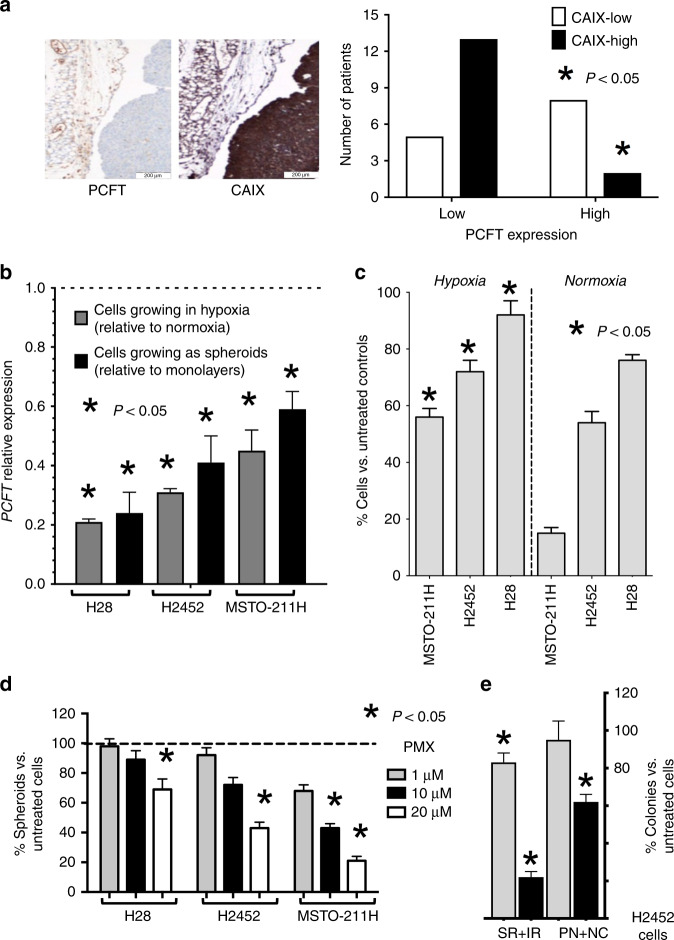
Background: Expression of proton-coupled folate transporter (PCFT) is associated with survival of mesothelioma patients treated with pemetrexed, and is reduced by hypoxia, prompting studies to elucidate their correlation.

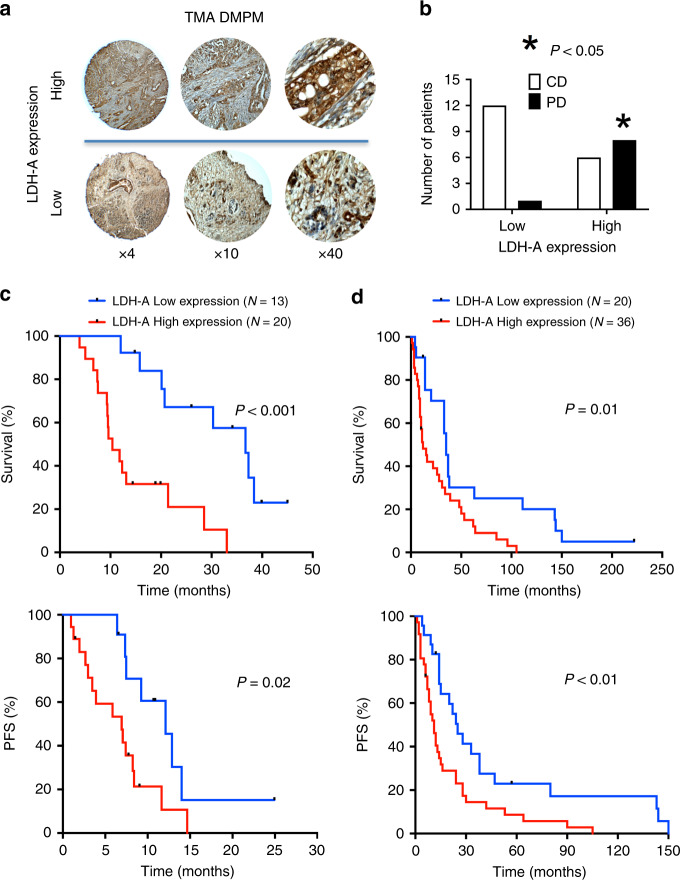
Methods: Modulation of glycolytic gene expression was evaluated by PCR arrays in tumour cells and primary cultures growing under hypoxia, in spheroids and after PCFT silencing. Inhibitors of lactate dehydrogenase (LDH-A) were tested in vitro and in vivo. LDH-A expression was determined in tissue microarrays of radically resected malignant pleural mesothelioma (MPM, N = 33) and diffuse peritoneal mesothelioma (DMPM, N = 56) patients.

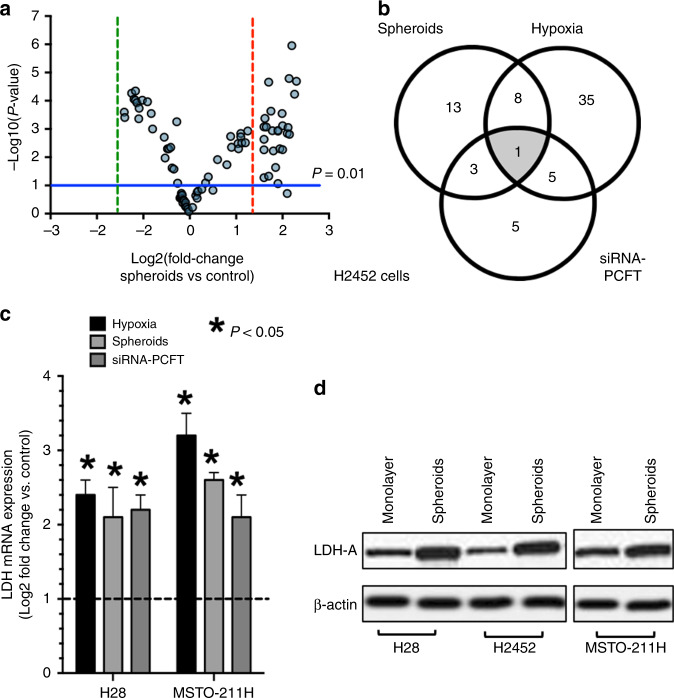
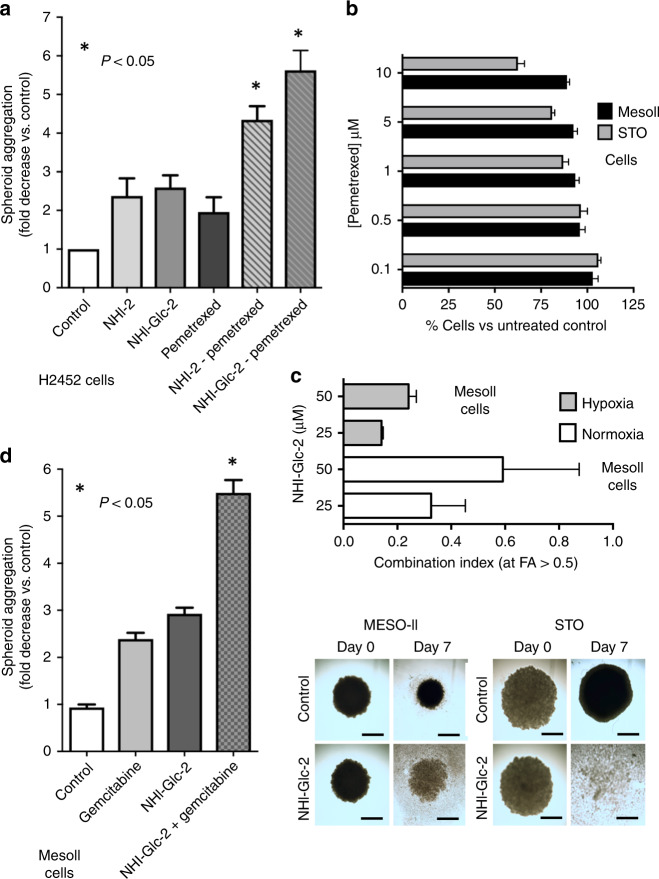
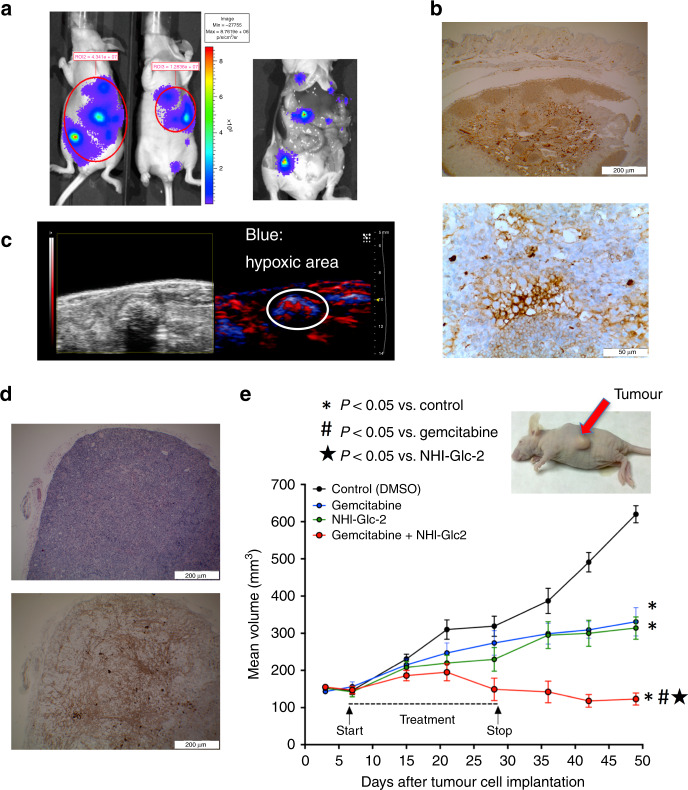
Results: Overexpression of hypoxia marker CAIX was associated with low PCFT expression and decreased MPM cell growth inhibition by pemetrexed. Through integration of PCR arrays in hypoxic cells and spheroids and following PCFT silencing, we identified the upregulation of LDH-A, which correlated with shorter survival of MPM and DMPM patients. Novel LDH-A inhibitors enhanced spheroid disintegration and displayed synergistic effects with pemetrexed in MPM and gemcitabine in DMPM cells. Studies with bioluminescent hypoxic orthotopic and subcutaneous DMPM athymic-mice models revealed the marked antitumour activity of the LDH-A inhibitor NHI-Glc-2, alone or combined with gemcitabine.

Conclusions: This study provides novel insights into hypoxia/PCFT-dependent chemoresistance, unravelling the potential prognostic value of LDH-A, and demonstrating the preclinical activity of LDH-A inhibitors.


Conflict of interest statement

The authors declare no competing interests.

Figures

Fig. 1
Fig. 1. Hypoxia affects PCFT expression and pemetrexed activity.
a Left panel: representative immunohistochemical pictures of two consecutive sections of an MPM tissue stained with anti-PCFT and anti-CAIX antibodies (left and right pictures, respectively, original magnification ×20). Right panel: analysis of the inverse/negative correlation of PCFT and CAIX staining in MPM patients (N = 28). b Quantitative RT-PCR analysis of PCFT mRNA expression in human MPM cell lines growing under hypoxic conditions or as spheroids. For each mesothelioma cell line, the results are presented relative to the expression levels of PCFT in cells growing in normoxia as two-dimensional monolayer cell cultures, assigned a value of 1 (dashed line). Columns, mean values obtained from three independent experiments; bars, SEM. *Significantly different (P < 0.05) compared with the untreated cells under normoxic conditions. c Cell growth inhibition performed with cells exposed to 1 µM pemetrexed (PMX) for 72 h under hypoxic vs. normoxic conditions, as compared with drug-free control cells. Columns, mean values obtained from three independent experiments; bars, SEM. *Significantly different (P < 0.05) compared with the same treatments under normoxic conditions. d Relative number of spheroids originating from H2452 cells treated with PMX compared with spheroids originating from drug-free cells, assigned a value of 100%. Columns, mean values obtained from three independent experiments; bars, SEM. *Significantly different (P < 0.05) compared with spheroids growing from untreated cells. e Relative number of colonies originated from the perinecrotic region and necrotic core (PN + NC) compared with the surface and intermediate regions (SR + IR) of H2452 spheroids treated with 1 or 10 µM PMX for 72 h, compared with spheroids originating from untreated cells, assigned as a value of 100%. Columns, mean values obtained from three independent experiments; bars, SEM. *Significantly different (P < 0.05) compared with untreated cells.
Fig. 2
Fig. 2. Correlation of hypoxia and PCFT silencing with LDH-A expression.
a Volcano plot depicting the results of PCR arrays in H2452 spheroids compared with H2452 cells growing as monolayers. The horizontal blue line identifies the cut-off for genes that displayed a significantly different expression (P values were calculated with the two-sided Student's t test); vertical red and green lines mark the cut-offs for the genes with threefold up- or downregulation, respectively. b Venn diagram of the overlap analysis of genes significantly upregulated in hypoxic cells, as well as in cells growing as spheroids, and after specific downregulation of PCFT expression in H2452 cells. c Modulation of LDH-A expression in hypoxia, spheroids and after PCFT silencing. MPM cell lines showed a significant modulation of LDH-A mRNA expression when growing under hypoxic conditions, as spheroids or after PCFT silencing. Columns, mean values obtained from three independent experiments; bars, SEM. *Significantly different (P < 0.05) from the respective control cells, i.e., cells growing in normoxia for the cells growing in hypoxia, cells growing as monolayers for the cells growing as spheroids and cells exposed to siRNA-negative control for the cells exposed to siRNA PCFT silencing, respectively, exemplified by the dashed line, with expression values of 1. d Representative immunoblots illustrating the modulation of LDH-A protein expression in MPM cells growing as spheroids compared with cells growing as monolayers.
Fig. 3
Fig. 3. Cytotoxic effect of anti-LDH-A compounds alone and in combination with pemetrexed or gemcitabine on MPM and DMPM monolayers and spheroids.
a Evaluation of the inhibition of the aggregation of the spheroids treated with pemetrexed (PMX), alone or in combination with 1 µM NHI-2, or NHI-Glc-2, compared with untreated spheroids originating from H2452 cells. The spheroids had similar volumes (below 500 µm3) at the start of drug exposure, and the untreated spheroids were still growing during the following 72 h. Columns, mean values obtained from three independent experiments; bars, SEM. *Significantly different (P < 0.05) from cells treated with PMX alone. b Cell viability bar graph of MesoII and STO cell lines treated with PMX. Columns, mean values obtained from three independent experiments; bars, SEM. c Combination index values, calculated at FA > 0.5, with Calcusyn software, as described in the “Methods” section. Columns, mean values obtained from three independent experiments; bars, SEM. d Evaluation of the inhibition of the aggregation of the spheroids treated with gemcitabine, alone or in combination with 10 µM NHI-Glc-2, compared with untreated spheroids originating from MesoII cells. Columns, mean values obtained from three independent experiments; bars, SEM. *Significantly different (P < 0.05) from cells treated with gemcitabine alone. Right panel: representative images of DMPM spheroids. The spheroids had similar volumes (below 500 µm3) and density at the start of drug exposure. However, after 7 days, the volume of untreated spheroids was reduced, while the density was significantly increased. In comparison with untreated spheroids (control), the treatment for 7 days with 25 µM of NHI-Glc-2 dramatically reduced the volume of STO spheroids, while the MesoII spheroids showed about a threefold decrease in their aggregation (considering both the volume and density, as explained in the “Methods” and Supplemental Methods and Supplementary Fig. S6). Scale bar, 100 µm. Columns, mean values obtained from three independent experiments; bars, SEM. *Significantly different (P < 0.05) from cells untreated.
Fig. 4
Fig. 4. In vivo activity of the new anti-LDH-A compound NHI-Glc-2 on orthotopic and subcutaneous DMPM models.
a Left panel: representative BLI images obtained with the CCD camera of orthotopic models of primary DMPM cells transduced with F-luc. Right panel: representative images showing the multiple tumour masses in the whole abdominal cavity as nodules, thus reproducing the diffusion pattern of the clinical disease in a mouse sacrificed after 2 weeks from inoculation of MesoII cells. b Representative immunohistochemical pictures (upper panel ×4, lower panel ×40 magnification) showing LDH-A overexpression in DMPM tissues obtained after orthotopic implantation of MesoII cells in mice. c Representative images of photoacoustic live imaging providing both a non-invasive anatomical image of tumours (up to 40-μm resolution) and the measurement of deep-tissue pO2. The latter showed reduced oxygenation (in blue), suggesting that tumour nodules were characterised by hypoxic regions. d Representative H&E (upper panel), and immunohistochemical (lower panel) pictures (×4 magnification) demonstrating LDH-A overexpression that characterised subcutaneous tumours obtained by inoculation of MesoII cells in mice. e Volumes of subcutaneous tumours of mice, as shown in the representative picture, treated with gemcitabine (100 mg/kg, i.p., 2 days a week), NHI-Glc-2 (solubilised in PEG400, 50 mg/kg, 5 days a week) or their combination compared with untreated mice. Points, mean values obtained from six mice; bars, SEM. *Significantly different (P < 0.05) from the untreated animal. # and ⋆ significantly different from animals treated with gemcitabine or NHI-Glc-2 monotherapy, respectively.
Fig. 5
Fig. 5. High expression of LDH-A correlates with significantly shorter overall survival (OS) and progression-free survival (PFS) in both MPM and DMPM patients.
a Representative pictures of immunohistochemical analyses of tissue microarray (TMA) cores in the cohorts of DMPM patients, illustrating cases with high (upper panels) and low (lower panels) LDH-A expression (at ×4, ×10 and ×40 original magnification). b LDH expression levels correlated to Disease Control (DC) and Progressive Disease (PD) in MPM patients treated with pemetrexed-based chemotherapy. c Kaplan–Meier curves of OS (upper panel) and PFS (lower panel) in MPM patients according to LDH-A high vs. low expression levels, as described above. P values were determined with the Log-rank test. d Kaplan–Meier curves of OS (upper panel) and PFS (lower panel) in DMPM patients according to LDH-A high vs. low expression levels, as described above. P values were determined with the Log-rank test.

Similar articles

Cited by

References

    1. Carbone, M., Adusumilli, P. S., Alexander, H. R., Baas, P., Bardelli, F., Bononi, A. et al. Mesothelioma: scientific clues for prevention, diagnosis, and therapy. CA Cancer J Clin. 10.3322/caac.21572 (2019). - PMC - PubMed
    1. Vogelzang NJ, Rusthoven JJ, Symanowski J, Denham C, Kaukel E, Ruffie P, et al. Phase III study of pemetrexed in combination with cisplatin versus cisplatin alone in patients with malignant pleural mesothelioma. J. Clin. Oncol. 2003;21:2636–2644. - PubMed
    1. Ceresoli GL, Zucali PA, Favaretto AG, Grossi F, Bidoli P, Del Conte G, et al. Phase II study of pemetrexed plus carboplatin in malignant pleural mesothelioma. J. Clin. Oncol. 2006;24:1443–1448. - PubMed
    1. Sugarbaker PH. Update on the management of malignant peritoneal mesothelioma. Transl. Lung Cancer Res. 2018;7:599–608. - PMC - PubMed
    1. Righi L, Papotti MG, Ceppi P, Billè A, Bacillo E, Molinaro L, et al. Thymidylate synthase but not excision repair cross-complementation group 1 tumor expression predicts outcome in patients with malignant pleural mesothelioma treated with pemetrexed-based chemotherapy. J. Clin. Oncol. 2010;28:1534–1539. - PubMed

Publication types

MeSH terms