. 2020 Jun 3;10(1):9059.
doi: 10.1038/s41598-020-66103-9.

Modeling suggests fossil fuel emissions have been driving increased land carbon uptake since the turn of the 20th Century

Affiliations

Modeling suggests fossil fuel emissions have been driving increased land carbon uptake since the turn of the 20th Century

Christopher R Schwalm et al. Sci Rep. .

Erratum in

Abstract

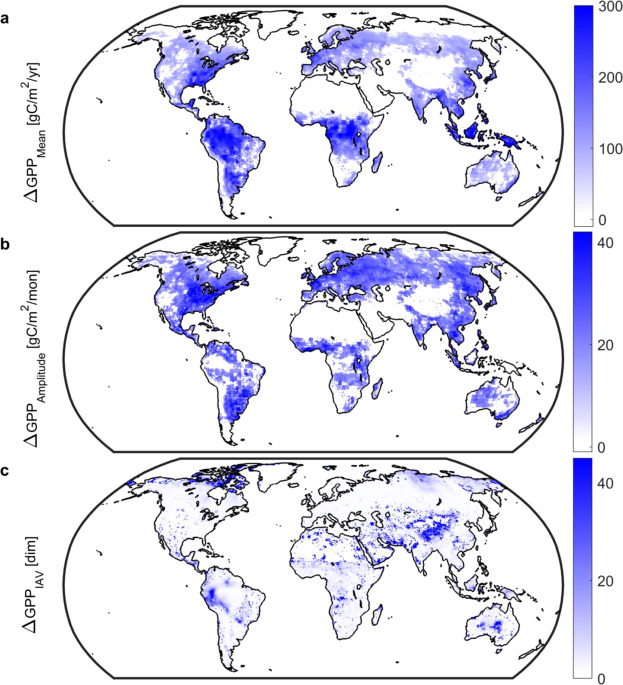
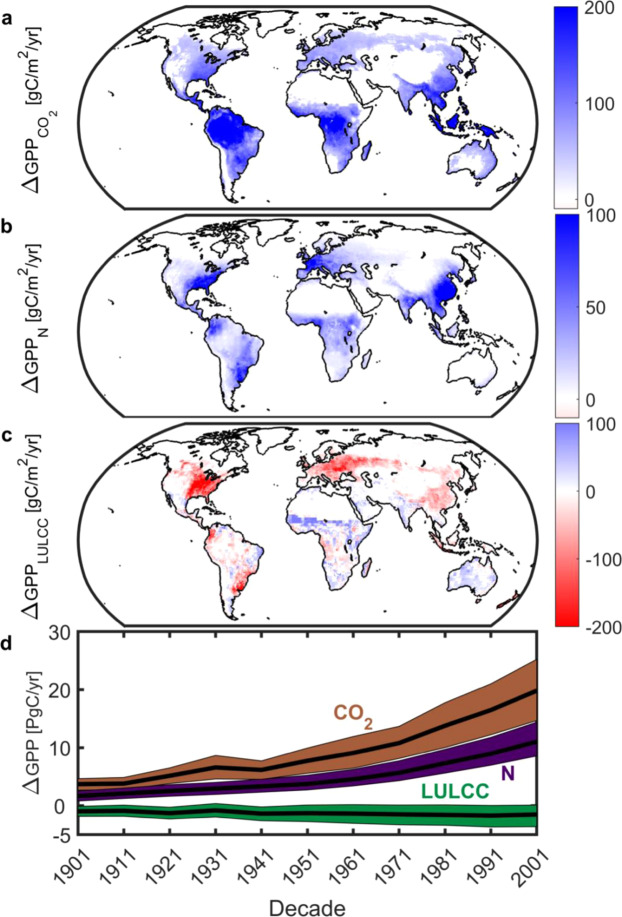
Terrestrial vegetation removes CO2 from the atmosphere; an important climate regulation service that slows global warming. This 119 Pg C per annum transfer of CO2 into plants-gross primary productivity (GPP)-is the largest land carbon flux globally. While understanding past and anticipated future GPP changes is necessary to support carbon management, the factors driving long-term changes in GPP are largely unknown. Here we show that 1901 to 2010 changes in GPP have been dominated by anthropogenic activity. Our dual constraint attribution approach provides three insights into the spatiotemporal patterns of GPP change. First, anthropogenic controls on GPP change have increased from 57% (1901 decade) to 94% (2001 decade) of the vegetated land surface. Second, CO2 fertilization and nitro gen deposition are the most important drivers of change, 19.8 and 11.1 Pg C per annum (2001 decade) respectively, especially in the tropics and industrialized areas since the 1970's. Third, changes in climate have functioned as fertilization to enhance GPP (1.4 Pg C per annum in the 2001 decade). These findings suggest that, from a land carbon balance perspective, the Anthropocene began over 100 years ago and that global change drivers have allowed GPP uptake to keep pace with anthropogenic emissions.


Conflict of interest statement

The authors declare no competing interests.

Figures

Figure 1
Figure 1
Long-term (1901–2010) changes in gross primary productivity (GPP). Changes in (a), mean annual GPP.; (b), monthly GPP amplitude.; and (c), interannual variability. Mean and amplitude values calculated as the difference between 1981–2010 and 1901–1930 periods; positive values indicate an increase over time. Interannual variability, an index of volatility in land ecosystem carbon metabolism, is the ratio of standard deviations using deseasonalized GPP, e.g., a value of 2 indicates that 1981–2010 variability in gross uptake is twice that of the 1901–1930 period. All maps based on CMIP5 and MsTMIP. White grid cells are water, barren, or exhibited no significant change. Note difference in color scales. Figure created in Matlab version R2019a (http://www.mathworks.com/products/matlab/).
Figure 2
Figure 2
Spatial pattern of changes in gross primary productivity (GPP) due to anthropogenic forcings. (a), Map of 1901 decade. (b), Map of 2001 decade. Areal extent of GPP change due to anthropogenic forcings: 57% and 94% for 1901 and 2001 decades respectively. Values calculated as the ratio of absolute values of anthropogenic to natural forcing-induced changes in GPP using CMIP5 models only (see Methods). A ratio greater than unity (brown) indicates that anthropogenic forcings (primarily well-mixed greenhouse gases) dominate; whereas green indicates natural forcings (solar irradiance and volcanic aerosols) dominate. Figure created in Matlab version R2019a (http://www.mathworks.com/products/matlab/).
Figure 3
Figure 3
Anthropogenic controls of changes in gross primary productivity (GPP). Spatial long-term mean (1901–2010) changes in GPP due to (a), CO2 fertilization (CMIP5 and MsTMIP); (b), nitrogen deposition (MsTMIP only); and (c), LULCC (CMIP5 and MsTMIP). White grid cells are water, barren, or exhibited no significant change. Note difference in color scales. (d), Decadal changes in GPP due to CO2 fertilization (brown), nitrogen deposition (purple) and land use and land cover change (LULCC; green). Color envelope: 90% confidence interval around mean (black line). Figure created in Matlab version R2019a (http://www.mathworks.com/products/matlab/).
Figure 4
Figure 4
Climatic controls of changes in gross primary productivity (GPP). Spatial long-term mean (1901–2010) changes in GPP due to (a), air temperature; (b), precipitation; and (c), downwelling shortwave radiation. White grid cells are water, barren, or exhibited no significant change. (d), Decadal changes in GPP due to air temperature (cyan), precipitation (green) and downwelling shortwave radiation (gold). Color envelope: 90% confidence interval around mean (black line). All values derived from MsTMIP only. Figure created in Matlab version R2019a (http://www.mathworks.com/products/matlab/).
Figure 5
Figure 5
Controlling factors for changes in gross primary productivity (GPP). Spatial long-term mean (1901–2010) changes in GPP due to (a), individual climatic factors (emulator-based; see Methods) and; (b), climate, land use and land cover change (LULCC), CO2 fertilization, and nitrogen deposition (N) factors (based on simulation differencing). Values in parenthesis give percent of vegetated land surface where the effect predominates. Maps derived using MsTMIP models only (see Methods). White grid cells are water, barren, or exhibited no significant change (28% of the vegetated land surface for individual climatic factors and 6% for overall factors). Figure created in Matlab version R2019a (http://www.mathworks.com/products/matlab/).

References

    1. Le Quéré C, et al. Global Carbon Budget 2017, Earth Syst. Sci. Data. 2018;10:405–448. doi: 10.5194/essd-10-405-2018. - DOI
    1. Jung M, et al. Compensatory water effects link yearly global land CO2 sink changes to temperature. Nature. 2017;541(7638):516–520. doi: 10.1038/nature20780. - DOI - PubMed
    1. Hegerl, G.C. et al. Good Practice Guidance Paper on Detection and Attribution Related to Anthropogenic Climate Change. In: Meeting Report of the Intergovernmental Panel on Climate Change Expert Meeting on Detection and Attribution of Anthropogenic Climate Change [Stocker, T.F., C.B. Field, D. Qin, V. Barros, G.-K. Plattner, M. Tignor, P.M. Midgley, and K.L. Ebi (eds.)]. IPCC Working Group I Technical Support Unit, University of Bern, Bern, Switzerland, (2010).
    1. Bellassen V, et al. Reconstruction and attribution of the carbon sink of European forests between 1950 and 2000. Global Change Biology. 2011;17(11):3274–3292. doi: 10.1111/j.1365-2486.2011.02476.x. - DOI
    1. Fernández-Martínez M, et al. Global trends in carbon sinks and their relationships with CO 2 and temperature. Nature Climate Change. 2018;9:73–79. doi: 10.1038/s41558-018-0367-7. - DOI

Publication types