

Oncometabolites suppress DNA repair by disrupting local chromatin signalling
- PMID: 32494005
- PMCID: PMC7319896
- DOI: 10.1038/s41586-020-2363-0
Oncometabolites suppress DNA repair by disrupting local chromatin signalling
Abstract
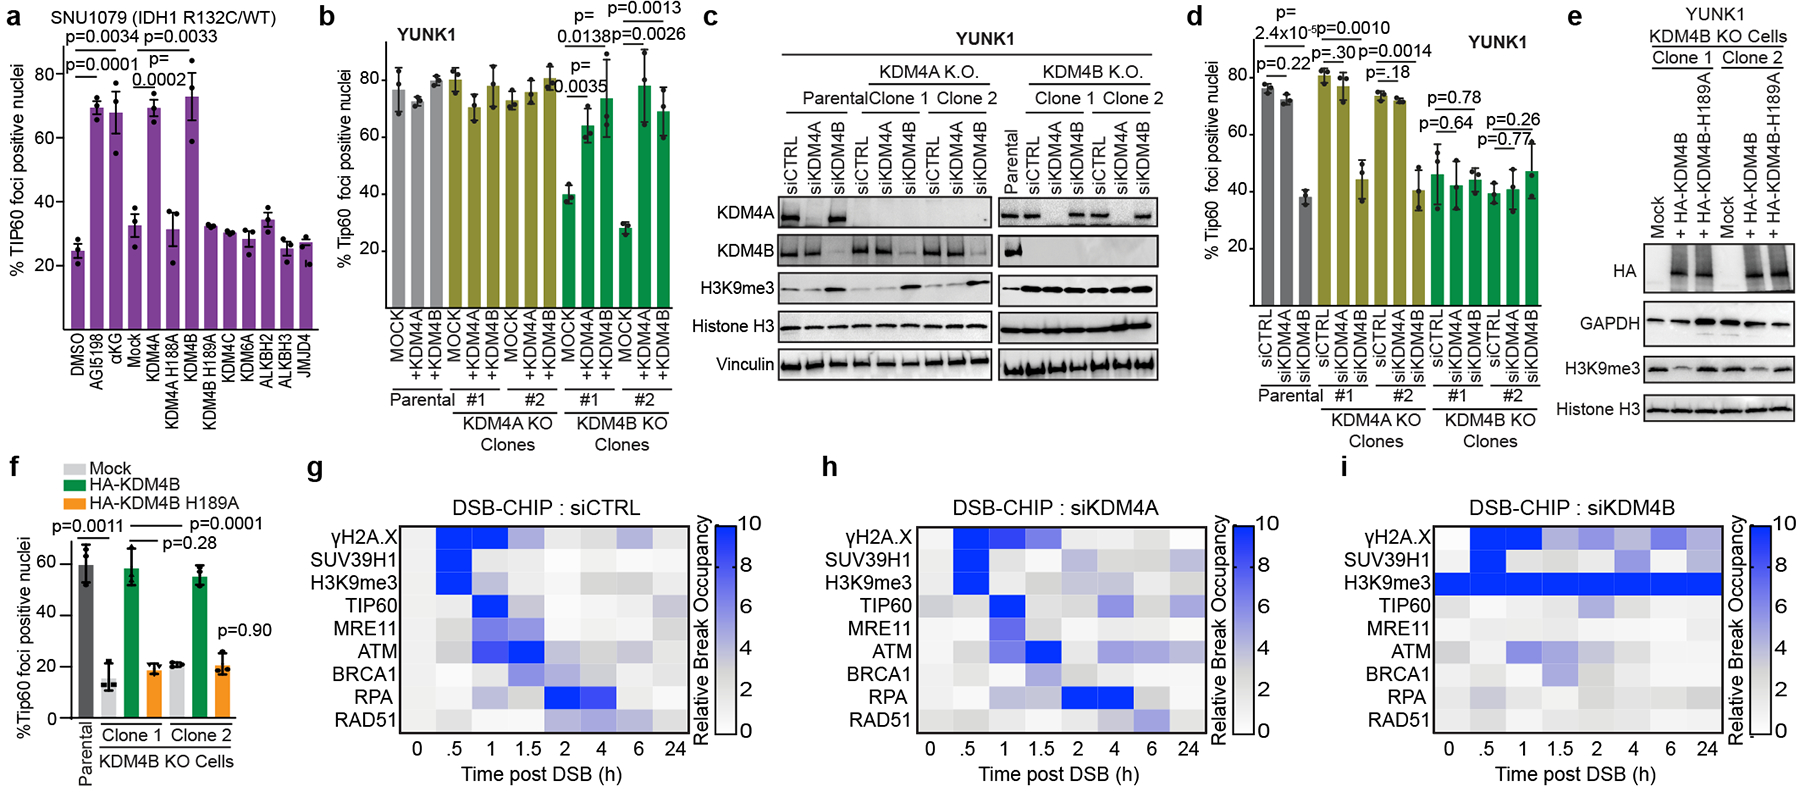
Deregulation of metabolism and disruption of genome integrity are hallmarks of cancer1. Increased levels of the metabolites 2-hydroxyglutarate, succinate and fumarate occur in human malignancies owing to somatic mutations in the isocitrate dehydrogenase-1 or -2 (IDH1 or IDH2) genes, or germline mutations in the fumarate hydratase (FH) and succinate dehydrogenase genes (SDHA, SDHB, SDHC and SDHD), respectively2-4. Recent work has made an unexpected connection between these metabolites and DNA repair by showing that they suppress the pathway of homology-dependent repair (HDR)5,6 and confer an exquisite sensitivity to inhibitors of poly (ADP-ribose) polymerase (PARP) that are being tested in clinical trials. However, the mechanism by which these oncometabolites inhibit HDR remains poorly understood. Here we determine the pathway by which these metabolites disrupt DNA repair. We show that oncometabolite-induced inhibition of the lysine demethylase KDM4B results in aberrant hypermethylation of histone 3 lysine 9 (H3K9) at loci surrounding DNA breaks, masking a local H3K9 trimethylation signal that is essential for the proper execution of HDR. Consequently, recruitment of TIP60 and ATM, two key proximal HDR factors, is substantially impaired at DNA breaks, with reduced end resection and diminished recruitment of downstream repair factors. These findings provide a mechanistic basis for oncometabolite-induced HDR suppression and may guide effective strategies to exploit these defects for therapeutic gain.
Conflict of interest statement
Figures


Comment in
-
Tumour metabolites hinder DNA repair.Nature. 2020 Jun;582(7813):492-494. doi: 10.1038/d41586-020-01569-1. Nature. 2020. PMID: 32572248 Free PMC article. No abstract available.
-
Amplifying the Noise: Oncometabolites Mask an Epigenetic Signal of DNA Damage.Mol Cell. 2020 Aug 6;79(3):368-370. doi: 10.1016/j.molcel.2020.07.014. Mol Cell. 2020. PMID: 32763225
References
Publication types
MeSH terms
Substances
Grants and funding
LinkOut - more resources
Full Text Sources
Other Literature Sources
Medical
Research Materials
Miscellaneous
