. 2020 Aug;584(7821):475-478.
doi: 10.1038/s41586-020-2389-3. Epub 2020 Jun 3.

Structure of the ER membrane complex, a transmembrane-domain insertase

Affiliations

Structure of the ER membrane complex, a transmembrane-domain insertase

Lin Bai et al. Nature. 2020 Aug.

Abstract

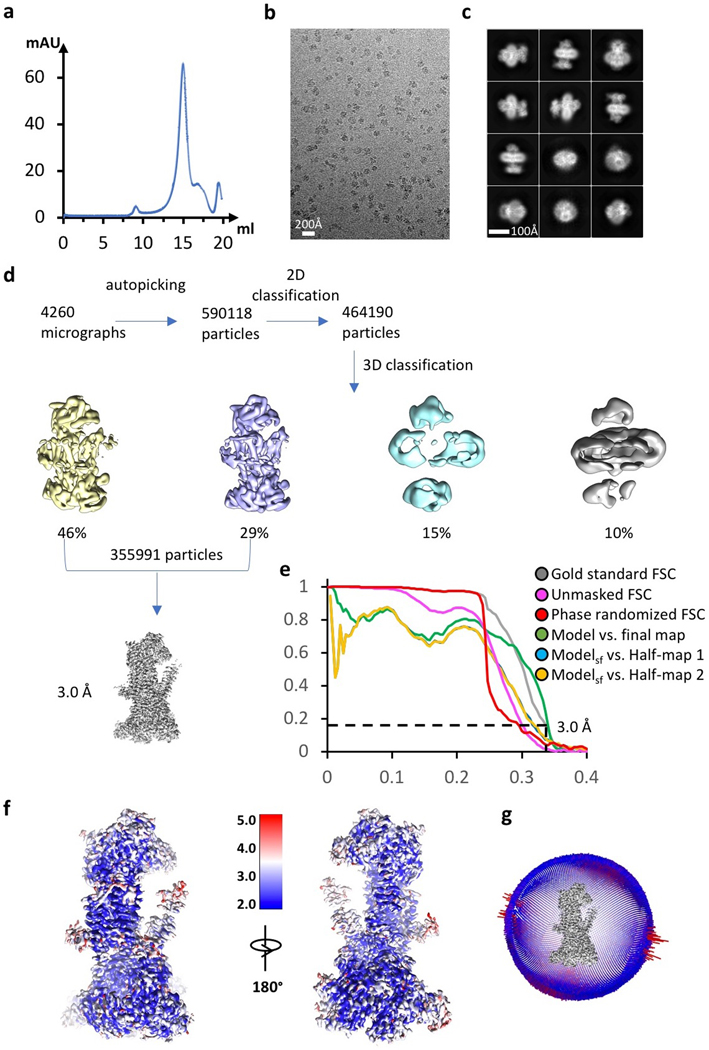
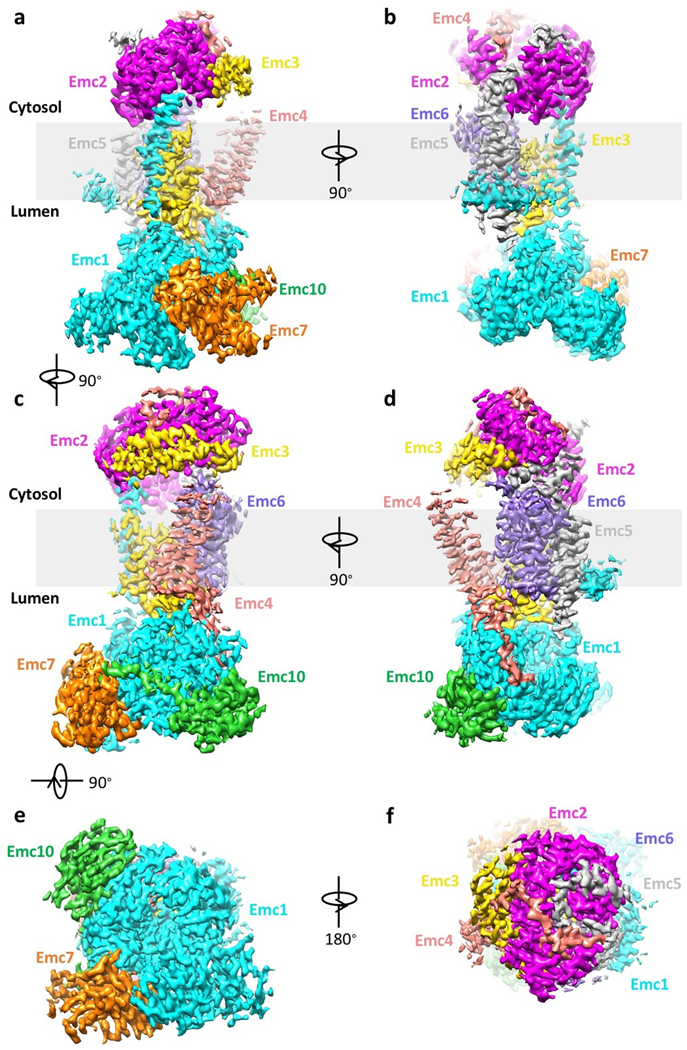
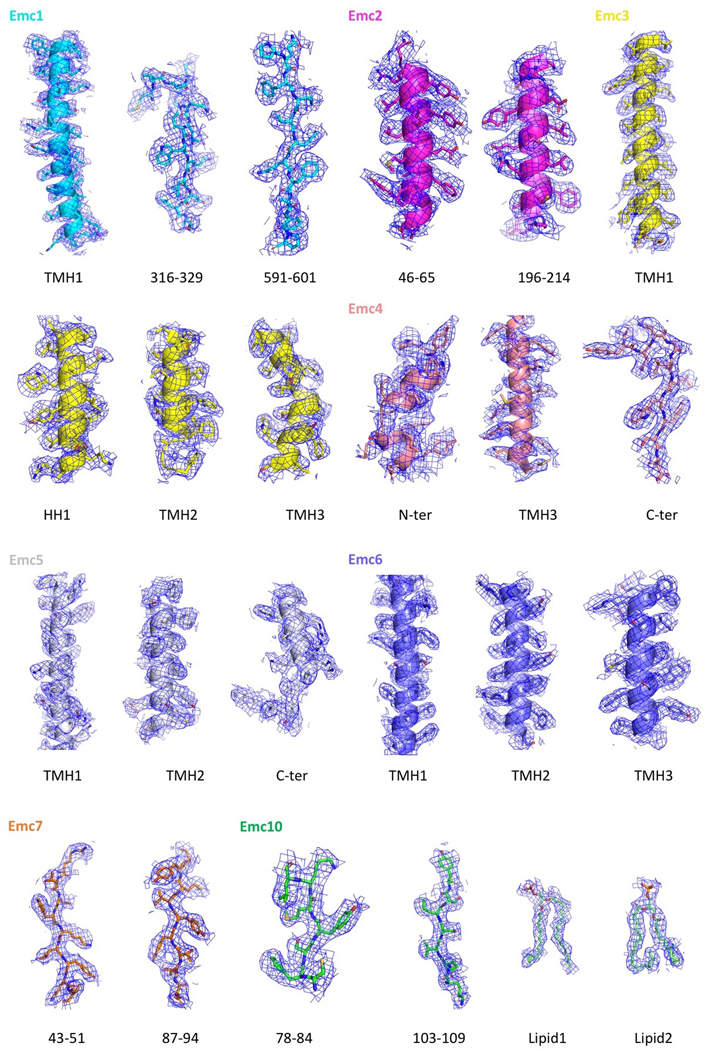
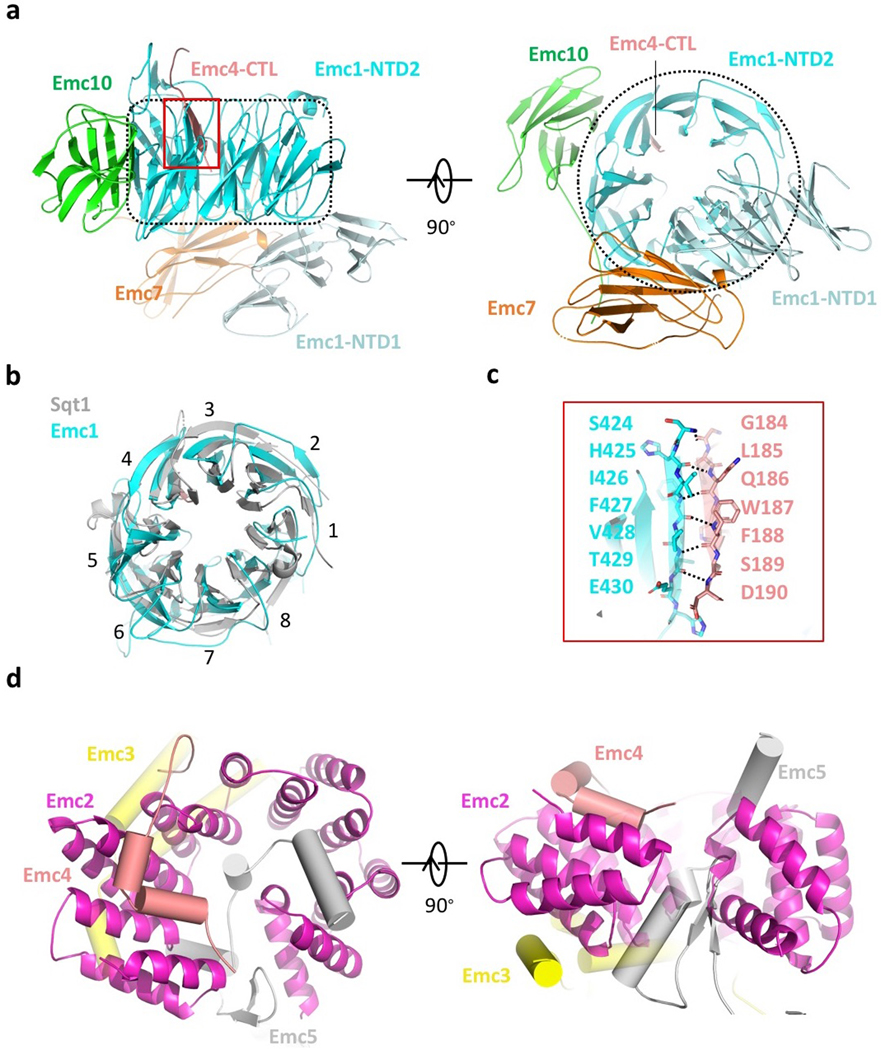
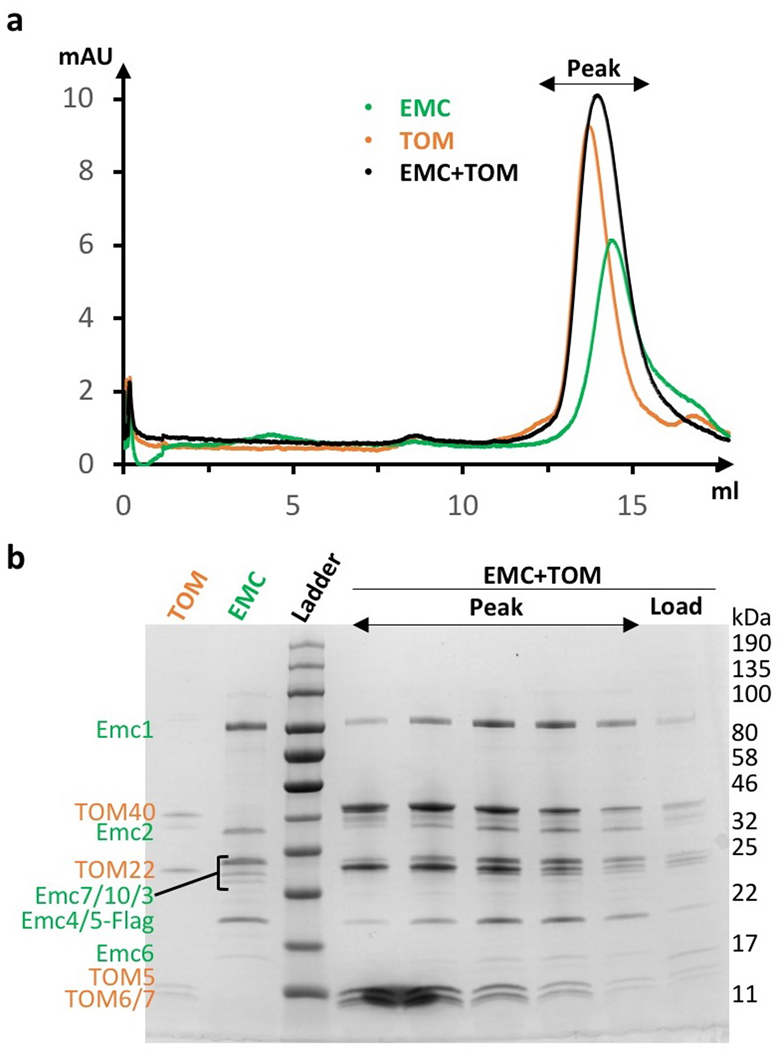
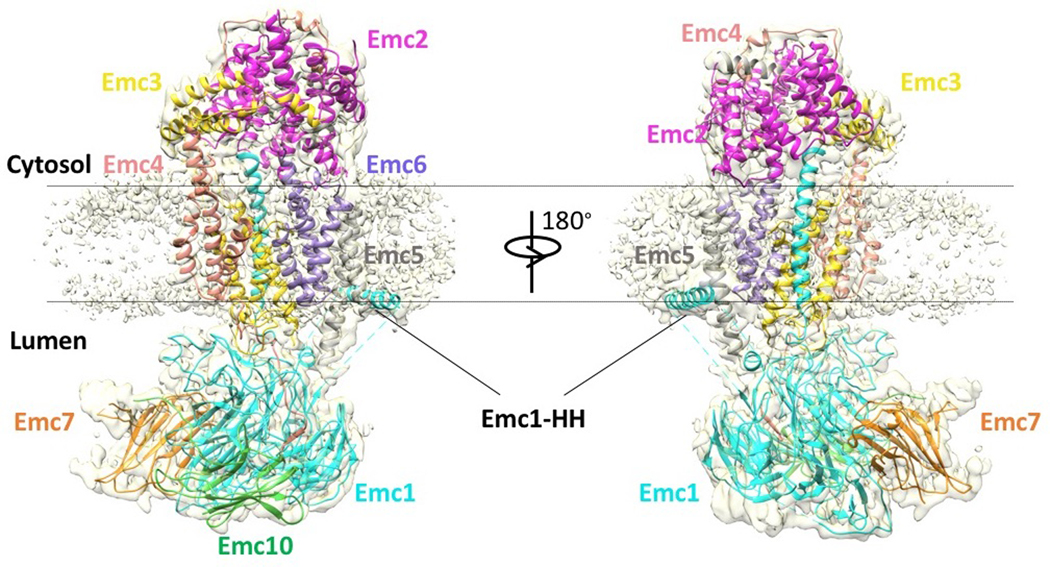
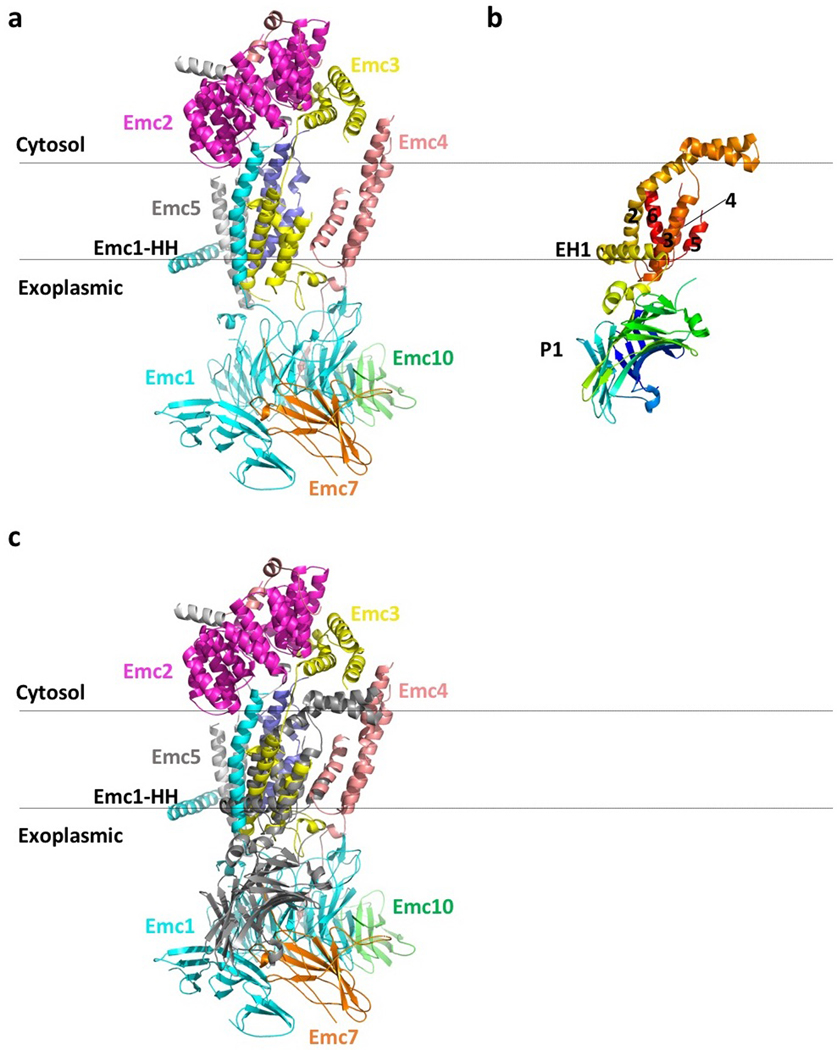
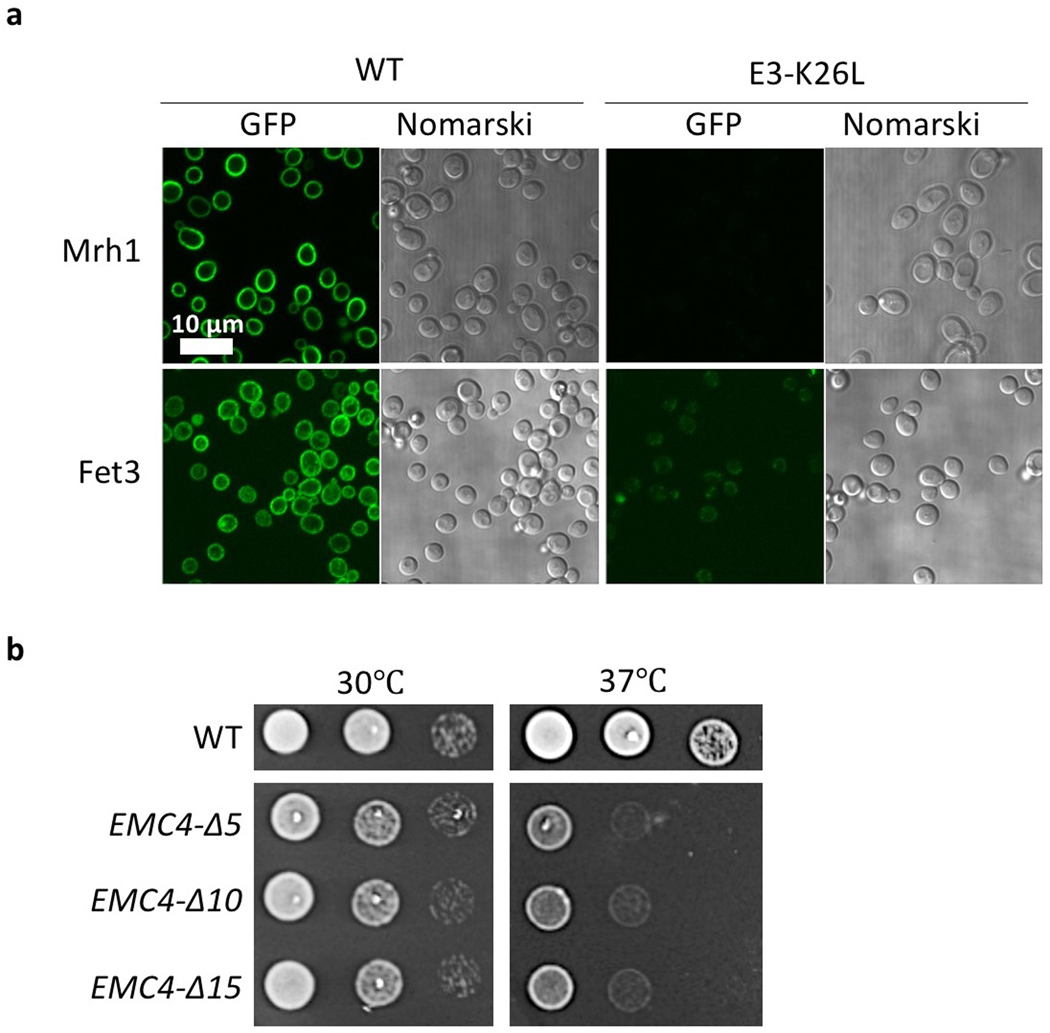
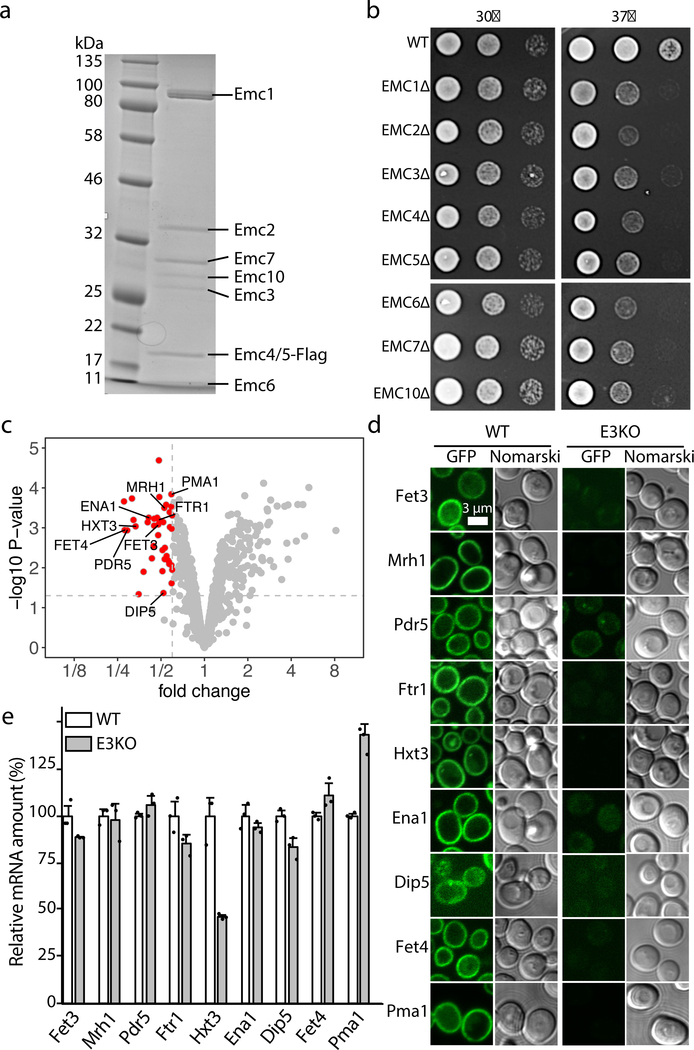
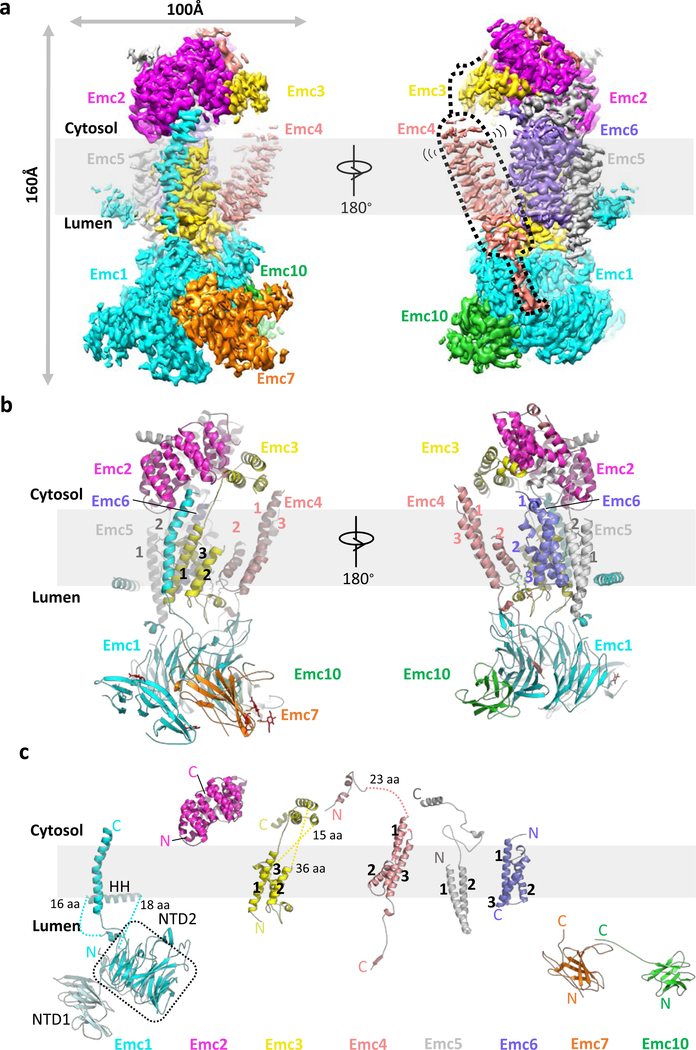
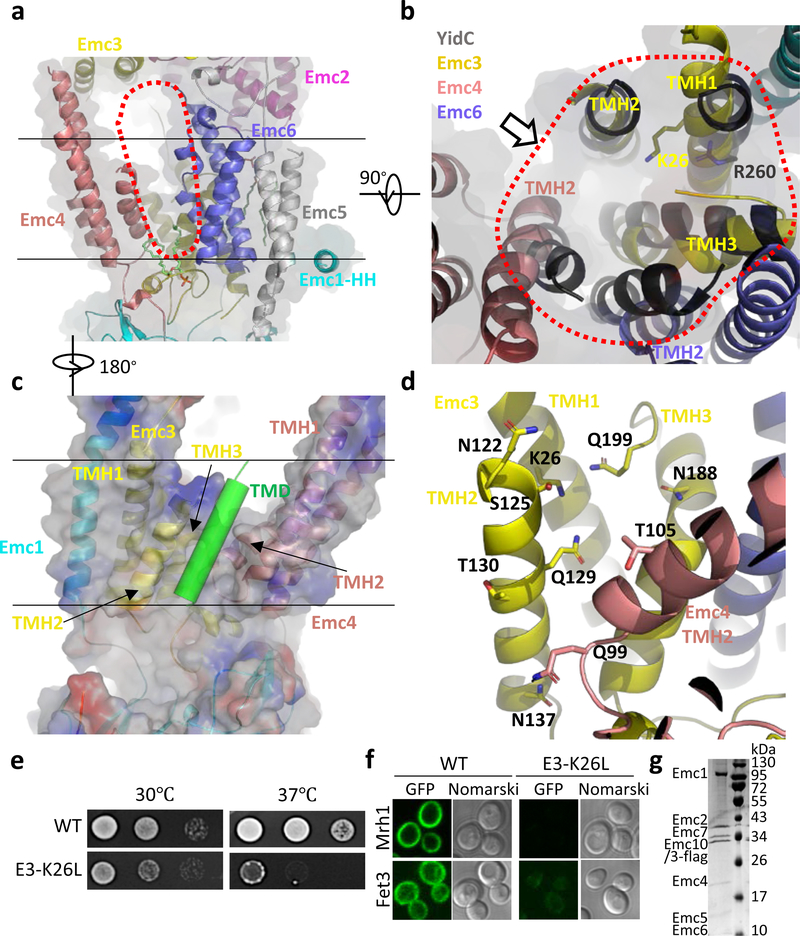
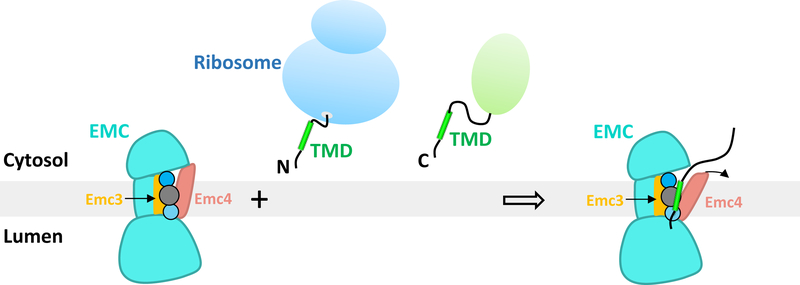
The endoplasmic reticulum (ER) membrane complex (EMC) cooperates with the Sec61 translocon to co-translationally insert a transmembrane helix (TMH) of many multi-pass integral membrane proteins into the ER membrane, and it is also responsible for inserting the TMH of some tail-anchored proteins1-3. How EMC accomplishes this feat has been unclear. Here we report the first, to our knowledge, cryo-electron microscopy structure of the eukaryotic EMC. We found that the Saccharomyces cerevisiae EMC contains eight subunits (Emc1-6, Emc7 and Emc10), has a large lumenal region and a smaller cytosolic region, and has a transmembrane region formed by Emc4, Emc5 and Emc6 plus the transmembrane domains of Emc1 and Emc3. We identified a five-TMH fold centred around Emc3 that resembles the prokaryotic YidC insertase and that delineates a largely hydrophilic client protein pocket. The transmembrane domain of Emc4 tilts away from the main transmembrane region of EMC and is partially mobile. Mutational studies demonstrated that the flexibility of Emc4 and the hydrophilicity of the client pocket are required for EMC function. The EMC structure reveals notable evolutionary conservation with the prokaryotic insertases4,5, suggests that eukaryotic TMH insertion involves a similar mechanism, and provides a framework for detailed understanding of membrane insertion for numerous eukaryotic integral membrane proteins and tail-anchored proteins.


Figures

Extended Data Figure 1.
Extended Data Figure 1.. Data processing and validation of cryo-EM micrographs and 3D reconstruction.
a, Gel filtration profile of the EMC complex. This experiment was repeated >5 times yielding similar results. b-c, Representative electron micrograph and selected reference-free 2D class averages of the EMC. A total of 4260 micrographs were recorded with similar quality. d, Cryo-EM data processing procedure. e, Gold-standard Fourier shell correlations of two independent half maps with or without mask, and with randomized phases, and the validation correlation curves of the atomic model by comparing the model with the final map or with the two half maps. f, Local resolution map of the 3D map. g, Angular distribution of particles used in final reconstruction of the 3D map.
Extended Data Figure 2.
Extended Data Figure 2.. Protein abundance and localization of nine putative EMC clients in WT and EMC3 knockout yeast strains.
The EGFP is appended to the C-termini of the genes. The scale bar is 10 μm. This experiment was repeated three times yielding similar results.
Extended Data Figure 3.
Extended Data Figure 3.. Cryo-EM 3D density map of the EMC.
The surface-rendered map is shown in front view (a), left side view (b), right side view (c), back view (d), bottom (lumenal) view (e), and top (cytosolic) view (f). Maps are colored by individual subunits.
Extended Data Figure 4.
Extended Data Figure 4.. The fitting of the atomic model and the 3D map in selected regions.
3D density map and atomic model of selected regions in each of the eight EMC subunits, as well as the densities of atomic models of the two phospholipid molecules. NT: N-terminal domain; CT: C-terminal domain; HH: horizontal helix.
Extended Data Figure 5.
Extended Data Figure 5.. Structure of the lumenal and cytosolic regions of the yeast EMC.
a, Structure of the EMC lumenal region shown in front, side, and bottom (lumenal) views. The interface area between C-terminal loop of Emc4 and the NTD2 of Emc1 is outlined by a red rectangle. The dotted black area marks the NTD2 of Emc1, which is an eight-bladed β-propeller. b, Superposition of the NTD2 β-propeller of Emc1 with the structure of a fungus chaperone protein Sqt1 (PDB ID 4ZN4). c, Enlarged view of the red-outlined region in panel a. d, Structure of the EMC cytosolic region in top (cytosolic) and front side views. Emc2 as the organizing center is shown in cartoon, and the cytosolic domains of Emc3, 4, and 5 are shown as cylinders.
Extended Data Figure 6.
Extended Data Figure 6.. In vitro binding assays between the purified EMC and the TOM complex.
a, Gel filtration profiles of the EMC alone, the TOM complex alone, and the mixture of the EMC-TOM complexes. No peak corresponding to the assembly of the EMC-TOM complex was observed. The experiment was repeated three times yielding similar results. b, Peak fractions of the EMC-TOM mixture in panel a were checked by the Coomassie blue-stained SDS-PAGE gel. The band densities suggest that the peak is simply an overlap of the unbound and separate EMC and TOM. For gel source data, see Supplementary Fig. 1.
Extended Data Figure 7.
Extended Data Figure 7.. The 3D EM map of the EMC surface rendered at a low display threshold.
The bound lipids/detergents surrounding the transmembrane region of the EMC complex are visible in this low-threshold display. The atomic model in cartoon is superimposed on the 3D map. Note that the horizontal helix (HH) of Emc1 is at the ER lumen–membrane boundary.
Extended Data Figure 8.
Extended Data Figure 8.. Structural comparison between yeast EMC and E. coli YidC.
a, Structure of EMC in cartoon. b, Structure of E. coli YidC in cartoon (PDB ID 3WVF). c, Superposed structures of EMC (color) and YidC (dark grey).
Extended Data Figure 9.
Extended Data Figure 9.. Comparisons of protein abundance, localization, and growth of the mutant yeast strains with the WT cells.
a, Protein abundance and localization of two putative EMC clients (Mrh1 and Fet3) in WT and EMC3 K26L mutant yeast strains. The EGFP is appended to the C-termini of the genes. b, Growth experiments of yeast strains containing Emc4 linker loop truncations. The three truncations were Emc4-∆56–60, Emc4-∆51–60, and Emc4-∆46–60. Experiments in panels a and b were repeated three times yielding similar results.
Fig. 1.
Fig. 1.. Purification of the yeast EMC and identification of EMC client proteins.
a, The Coomassie blue-stained SDS-PAGE gel of the purified EMC complex. For gel source data, see Supplementary Fig. 1. b, Growth of 10-fold serial diluted yeast strains (WT and individual Emc subunit knockouts) on YPD plates at 30°C and 37°C for 2 d. c, Fold change and statistical significance of the membrane protein levels in EMC-KO cells relative to WT cells. Proteins whose abundance was decreased by >40% and whose significance p-value was smaller than 0.05 are highlighted in red. The p-values were calculated by Empirical Bayes t-tests (two-sided) with no adjustment. d-e, Protein abundance (d) and mRNA levels (e) of nine putative EMC clients in WT and EMC3 knockout yeast strains. The EGFP is appended to the C-termini of the genes. The scale bar is 3 µm. The mRNA columns are shown as mean ± SD. Each black dot indicates the value of a single independent experiment. The experiments in panels a-e were repeated three times yielding similar results.
Fig. 2.
Fig. 2.. Structure of the yeast EMC.
a, Cryo-EM 3D map of the EMC, showing front and back views with individual subunits colored. The dotted black shape outlines the Emc4 density, which is weaker and partially flexible (indicated by the two propagating wave signs). b, An atomic model shown in cartoons and colored in the same scheme as panel a; phospholipids and N-glycans are shown in green and red, respectively. c, Structures of the eight EMC subunits shown separately.
Fig. 3.
Fig. 3.. The transmembrane region of the yeast EMC contains a client-binding pocket.
a, Structure of the transmembrane domain shown as a cartoon in front view. Two parallel black lines mark the lipid bilayer position. The red dots outline the elongated large cavity. Note the horizontal α-helix (HH) in Emc1 at the interface between the lumen and the membrane. b, Superposition of YidC (PDB ID 5Y83) as a black cartoon on the transmembrane domain of EMC in cytosolic view. The red dots encircle the five EMC α-helices aligned with YidC. The putative client TMD position is shown by the arrow, which is suggested by previous YidC-ribosome EM structure . c, A front view of the EMC transmembrane region in cartoon and surface potential. The green cylinder represents a client TMD located between TMH2 of Emc3 and TMH2 of Emc4 in the putative client binding pocket. Panels c and d are viewed from the back of panel a. d, The polar environment of the putative client binding pocket of the EMC. e, Two-day growth of 10-fold serially diluted cells (WT and Emc3-K26L mutant) on YPD plates at 30 °C and 37 °C. f, Diminished amount of two EMC clients (Mrh1 and Fet3) in cells containing the Emc3-K26L mutation. EGFP is inserted in the C-termini of these genes. g, The Coomassie blue–stained SDS-PAGE gel of the purified mutant EMC containing a K26L single mutation in Emc3. The experiments in panels e-g were repeated three times yielding similar results. For gel source data, see Supplementary Fig. 1.
Fig. 4.
Fig. 4.. A model for client TMH insertion by the eukaryotic EMC.
The model highlights the EMC’s ability to chaperone or to facilitate membrane insertion of a diverse set of transmembrane protein clients, with their respective TMH either at the N-terminus (N) or at the C-terminus (C). The TMH insertion can be either co-translational (represented by a client emerging from a ribosome) or post-translational (represented by a client with a folded green domain). The model also shows the presence of a partially hydrophilic pocket formed by the TMDs of Emc3 and Emc4 – the putative client binding pocket – in the transmembrane region of the EMC complex. The pocket is lined by three connected circles which represent the presence of multiple hydrophilic (blue circles) and hydrophobic residues (grey circle). The curved black arrow indicates a potential movement of the Emc4 TMD to accommodate the client TMH.

Comment in

  • Membrane protein biogenesis by the EMC.
    Alvira S, Corey RA, Collinson I, Römisch K. Alvira S, et al. EMBO J. 2021 Jan 15;40(2):e107407. doi: 10.15252/embj.2020107407. Epub 2020 Dec 21. EMBO J. 2021. PMID: 33346928 Free PMC article.

References

    1. Shurtleff MJ et al. The ER membrane protein complex interacts cotranslationally to enable biogenesis of multipass membrane proteins. Elife 7, doi:10.7554/eLife.37018 (2018). - DOI - PMC - PubMed
    1. Chitwood PJ, Juszkiewicz S, Guna A, Shao S & Hegde RS EMC Is Required to Initiate Accurate Membrane Protein Topogenesis. Cell 175, 1507–1519 e1516, doi:10.1016/j.cell.2018.10.009 (2018). - DOI - PMC - PubMed
    1. Guna A, Volkmar N, Christianson JC & Hegde RS The ER membrane protein complex is a transmembrane domain insertase. Science 359, 470–473, doi:10.1126/science.aao3099 (2018). - DOI - PMC - PubMed
    1. Chen Y & Dalbey RE Oxa1 Superfamily: New Members Found in the ER. Trends Biochem Sci 43, 151–153, doi:10.1016/j.tibs.2017.12.005 (2018). - DOI - PubMed
    1. Anghel SA, McGilvray PT, Hegde RS & Keenan RJ Identification of Oxa1 Homologs Operating in the Eukaryotic Endoplasmic Reticulum. Cell Rep 21, 3708–3716, doi:10.1016/j.celrep.2017.12.006 (2017). - DOI - PMC - PubMed

References in Methods

    1. Funakoshi M & Hochstrasser M. Small epitope-linker modules for PCR-based C-terminal tagging in Saccharomyces cerevisiae. Yeast 26, 185–192, doi:10.1002/yea.1658 (2009). - DOI - PMC - PubMed
    1. Kammers K, Cole RN, Tiengwe C & Ruczinski I. Detecting Significant Changes in Protein Abundance. EuPA Open Proteom 7, 11–19, doi:10.1016/j.euprot.2015.02.002 (2015). - DOI - PMC - PubMed
    1. Zheng SQ et al. MotionCor2: anisotropic correction of beam-induced motion for improved cryo-electron microscopy. Nat Methods 14, 331–332, doi:10.1038/nmeth.4193 (2017). - DOI - PMC - PubMed
    1. Mindell JA & Grigorieff N. Accurate determination of local defocus and specimen tilt in electron microscopy. J Struct Biol 142, 334–347 (2003). - PubMed
    1. Zivanov J et al. New tools for automated high-resolution cryo-EM structure determination in RELION-3. Elife 7, doi:10.7554/eLife.42166 (2018). - DOI - PMC - PubMed

MeSH terms

Substances

LinkOut - more resources