. 2020 Jun;582(7812):399-404.
doi: 10.1038/s41586-020-2352-3. Epub 2020 Jun 3.

Hair-bearing human skin generated entirely from pluripotent stem cells

Affiliations

Hair-bearing human skin generated entirely from pluripotent stem cells

Jiyoon Lee et al. Nature. 2020 Jun.

Abstract

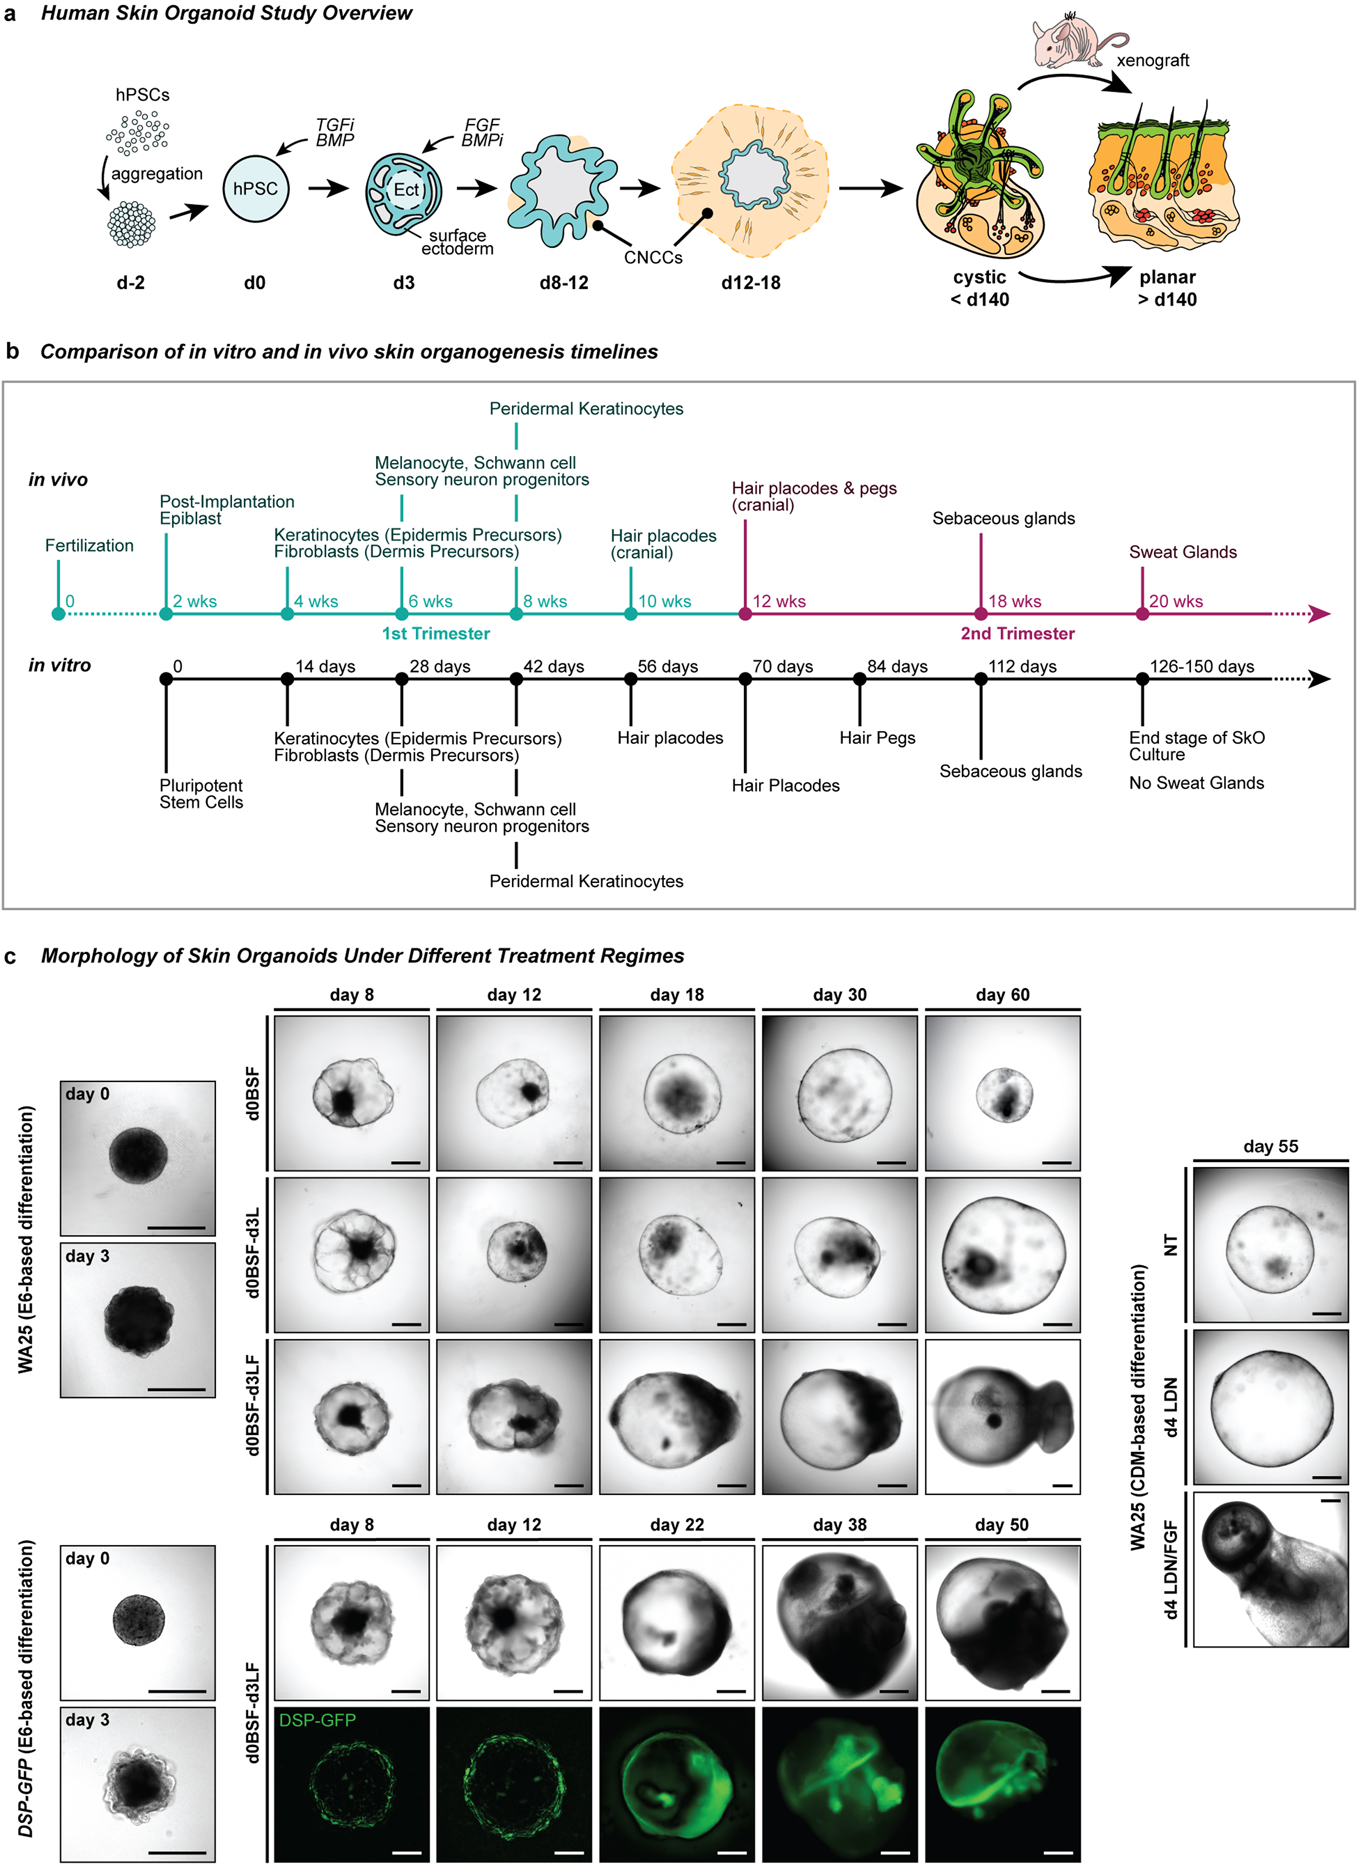
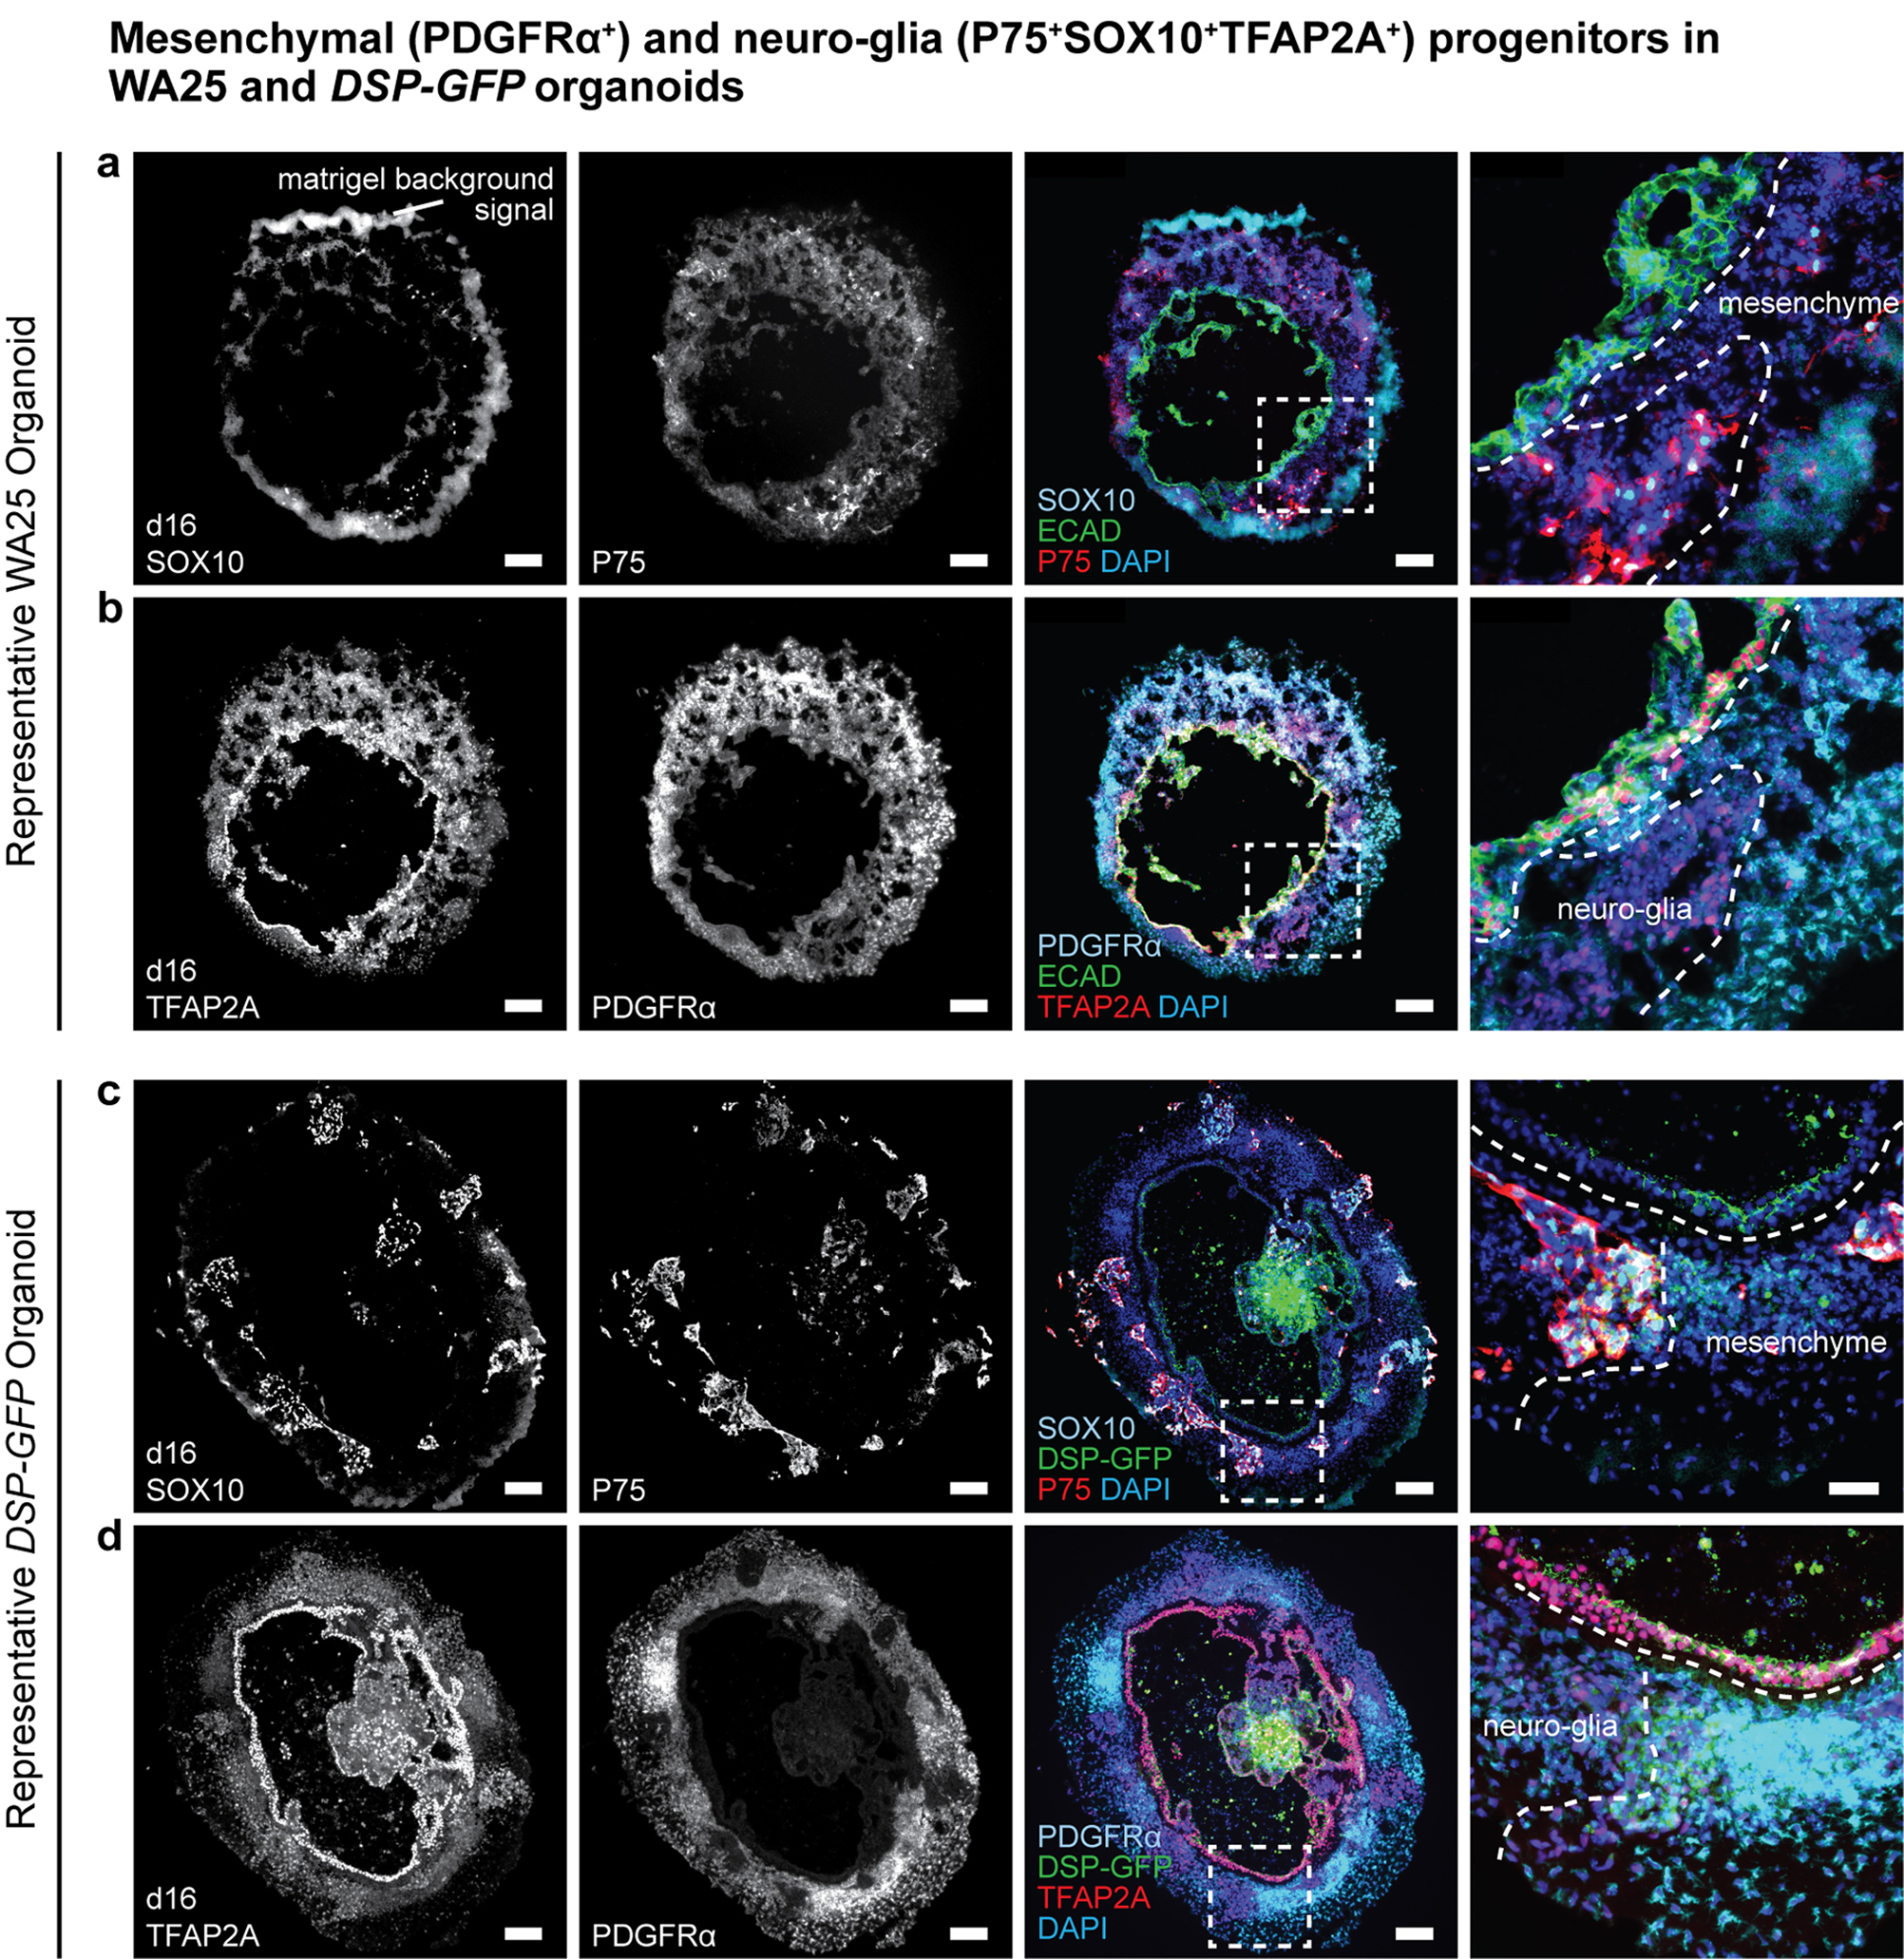
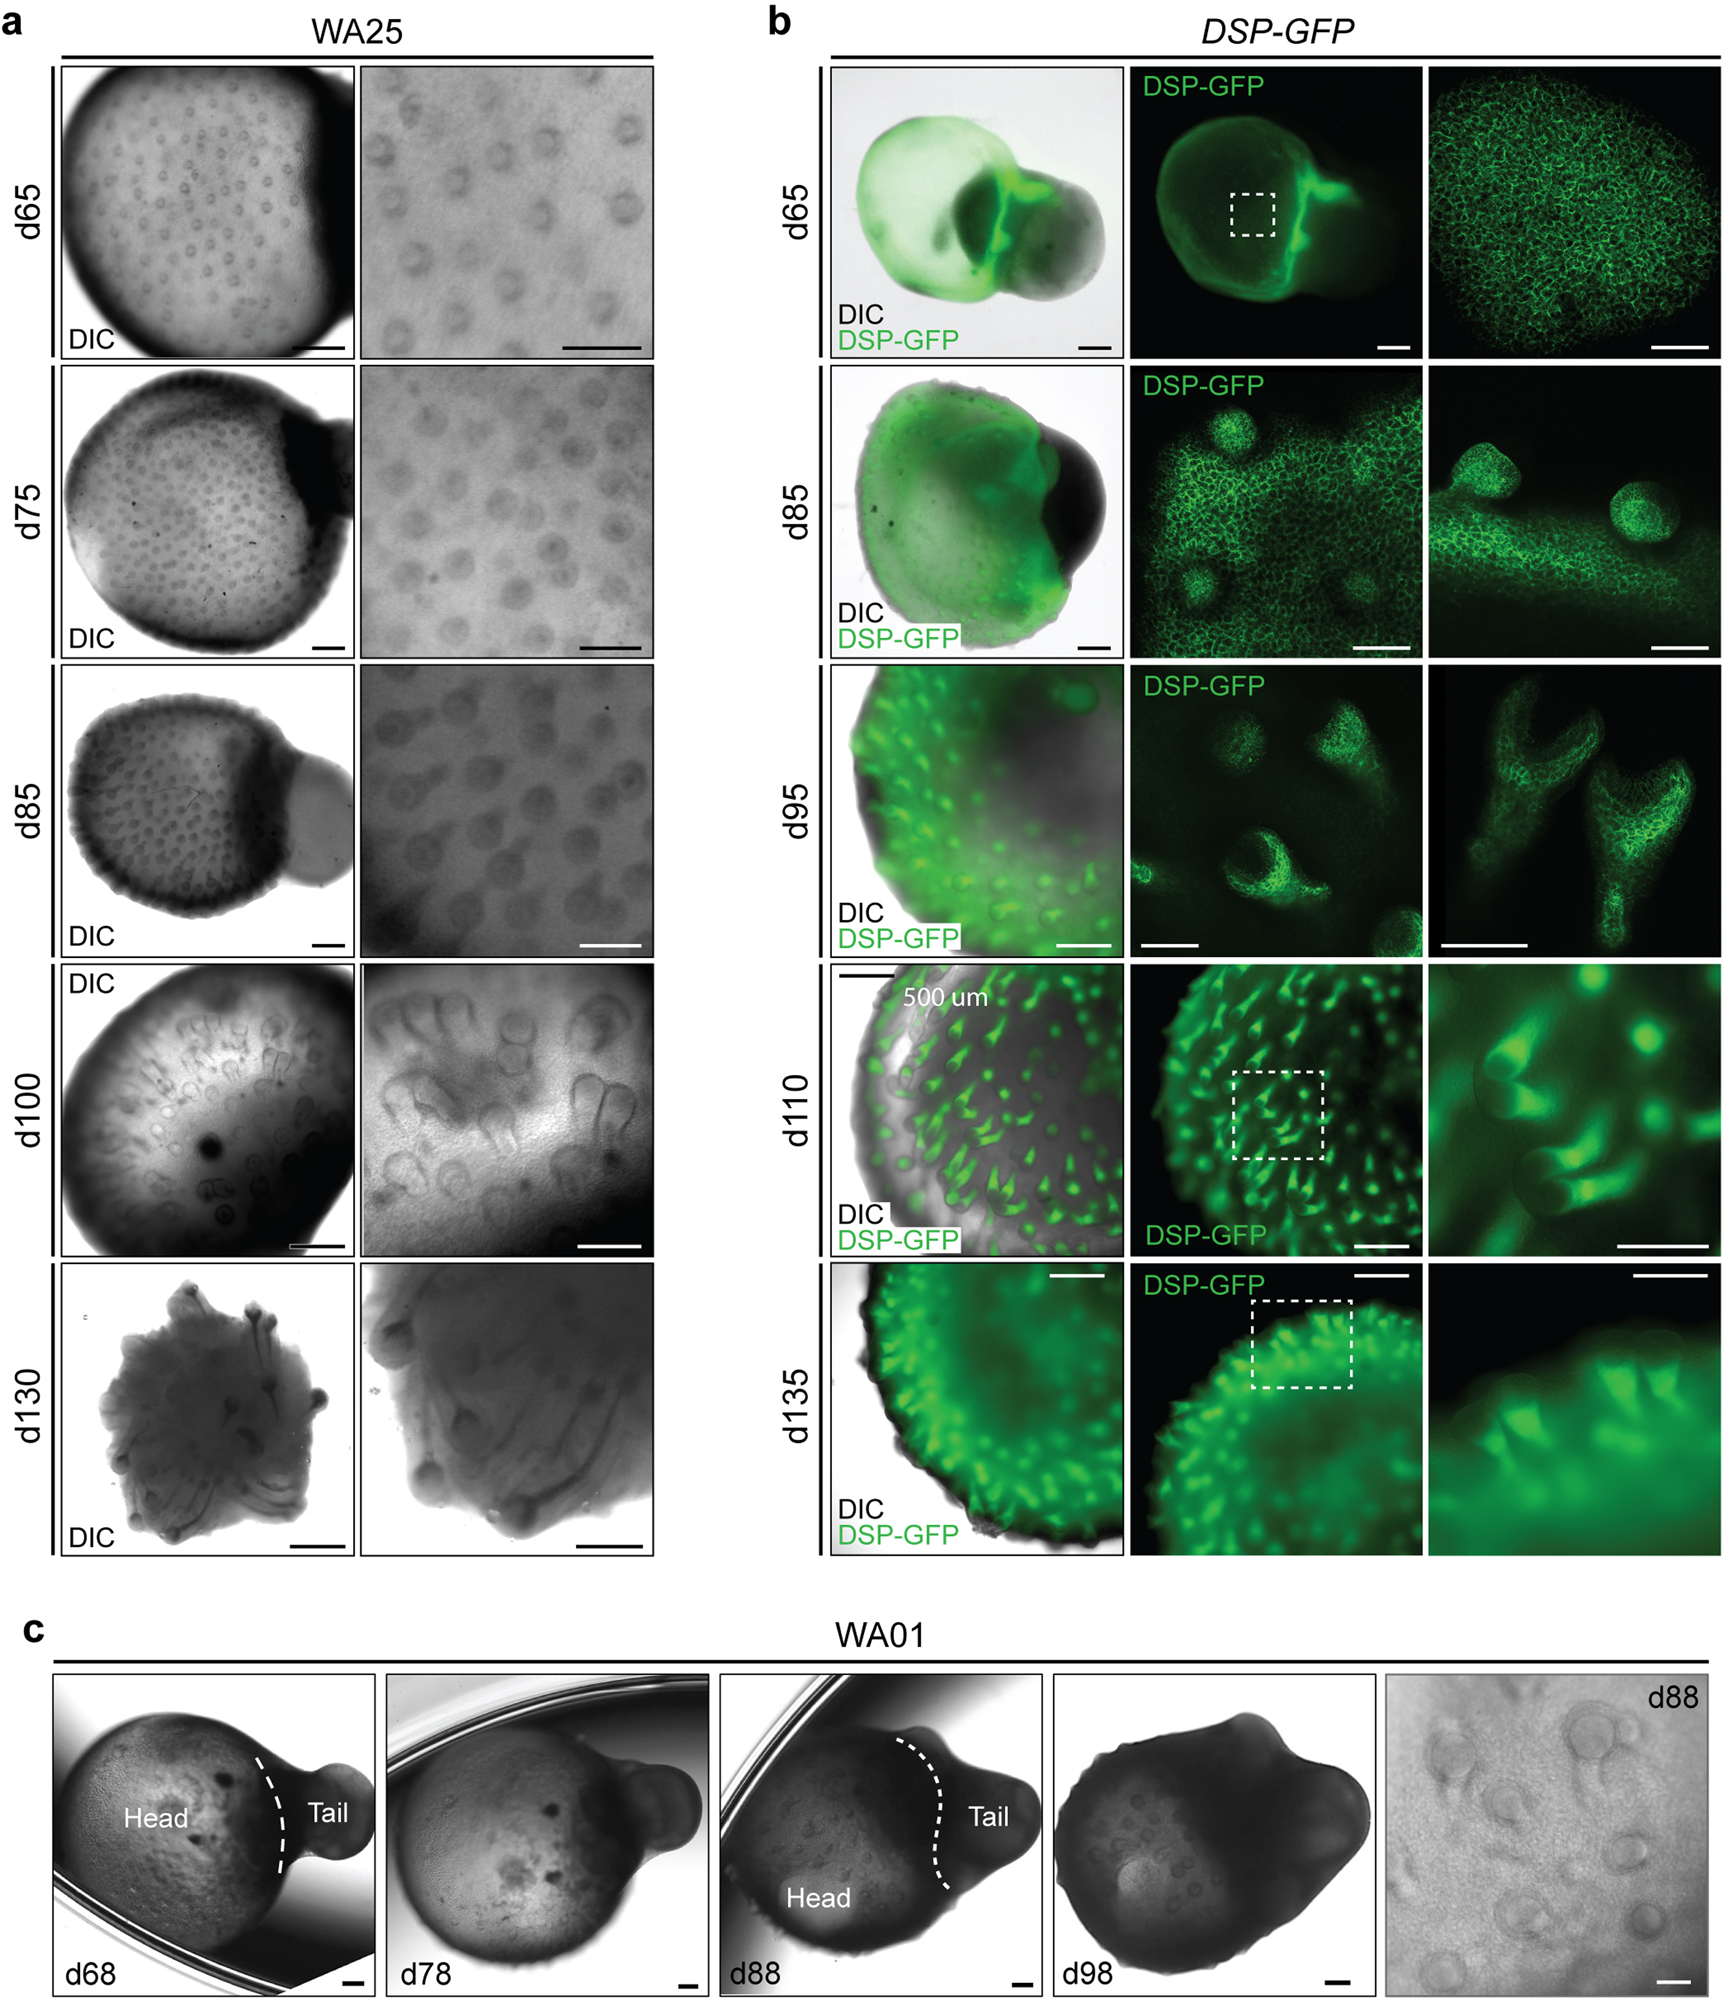
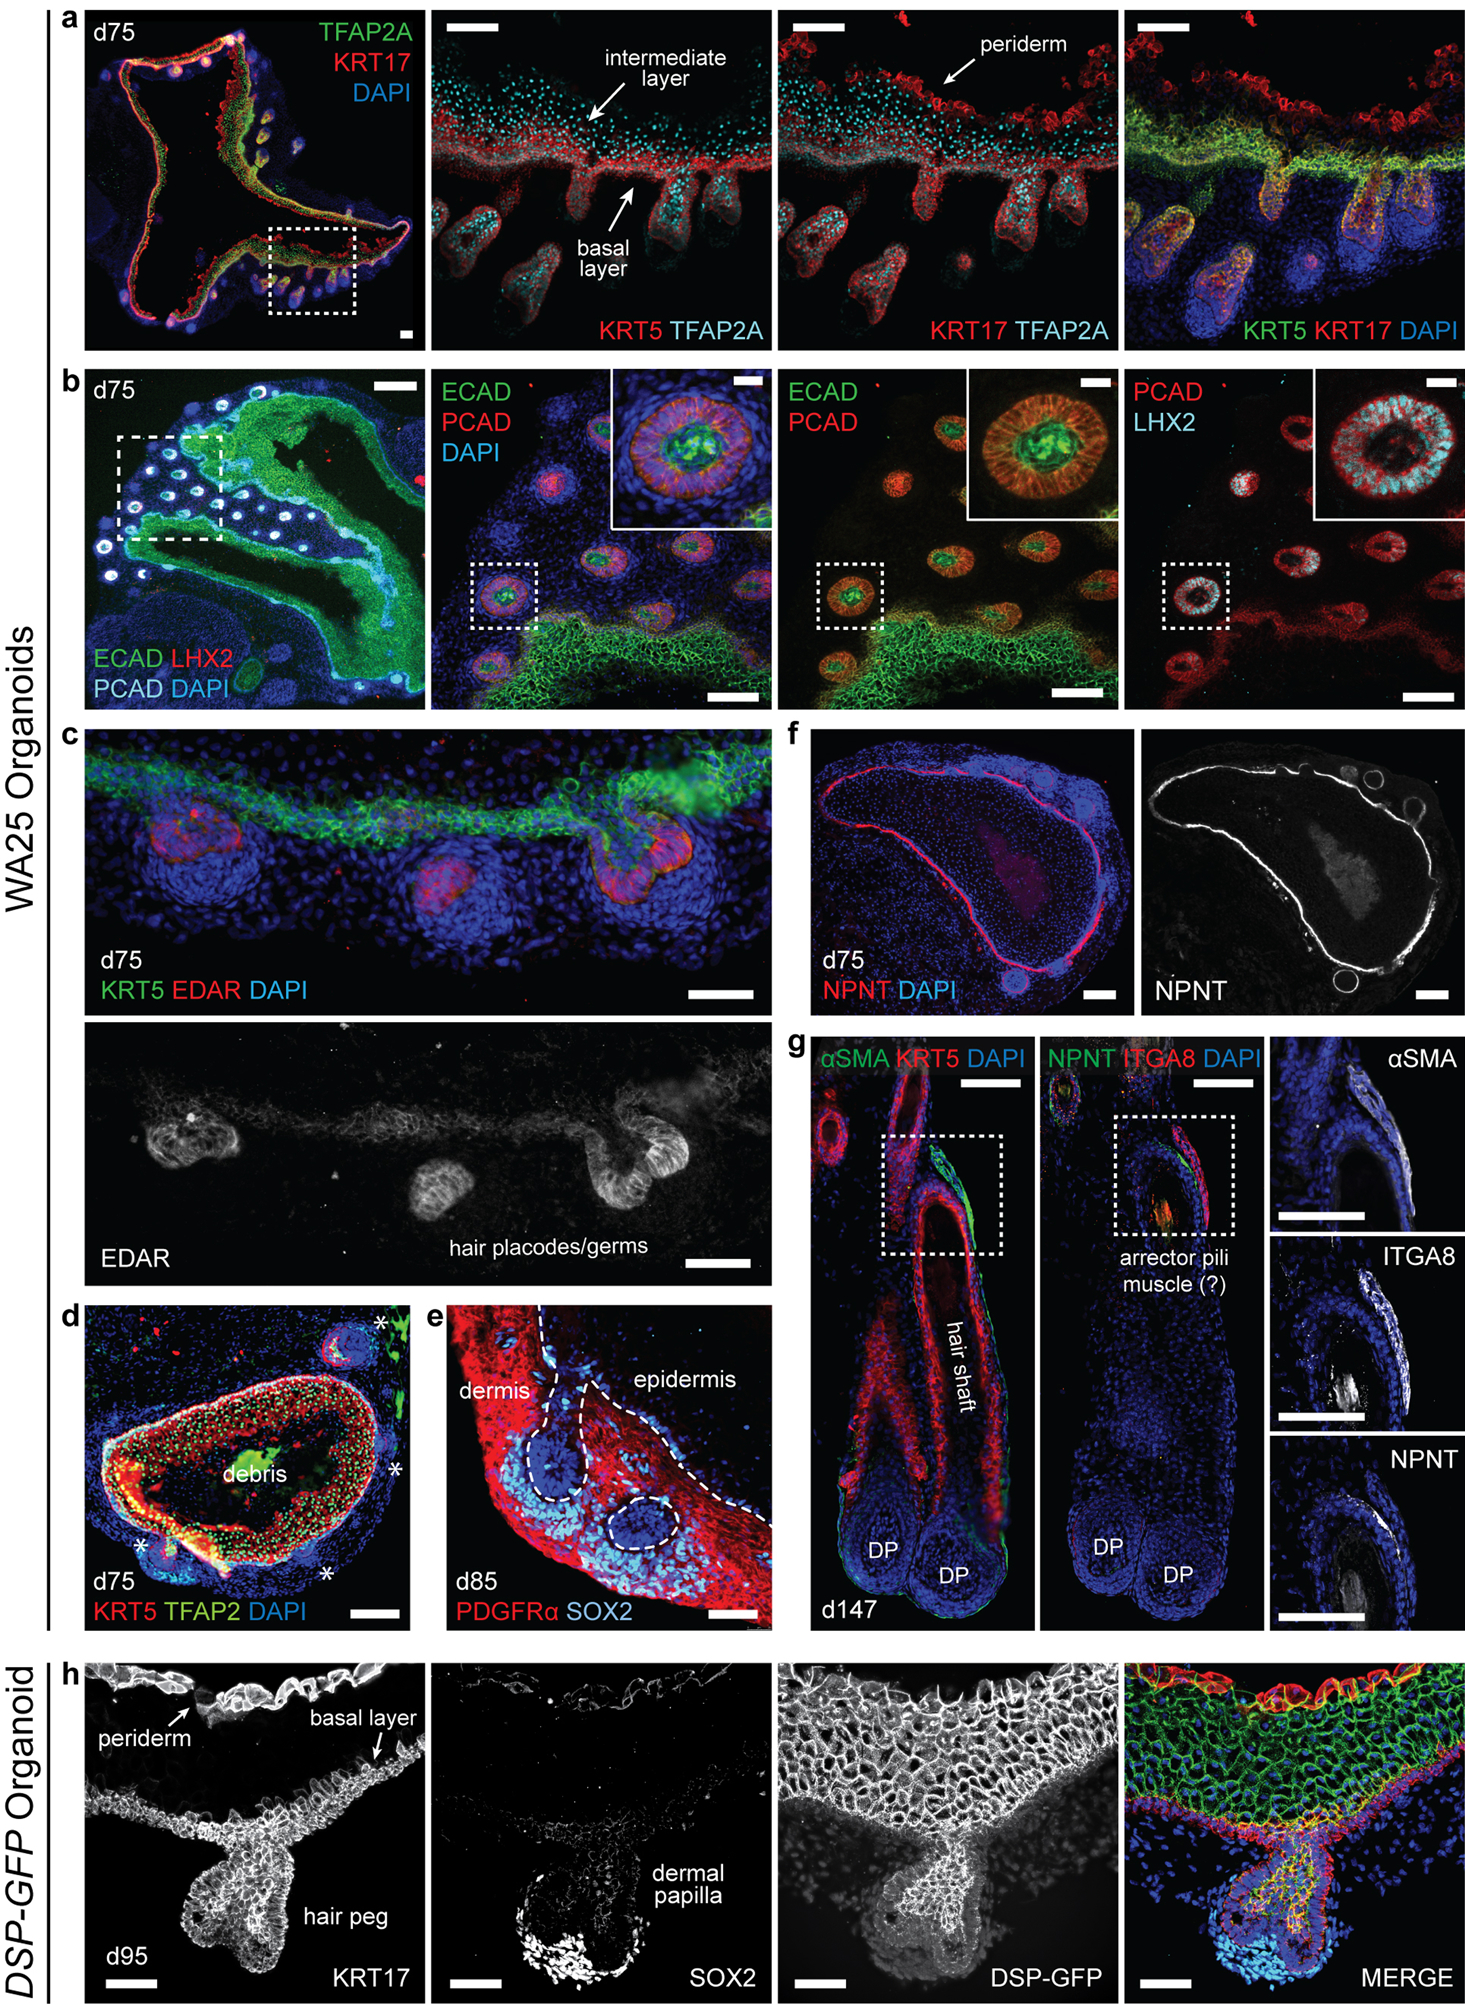
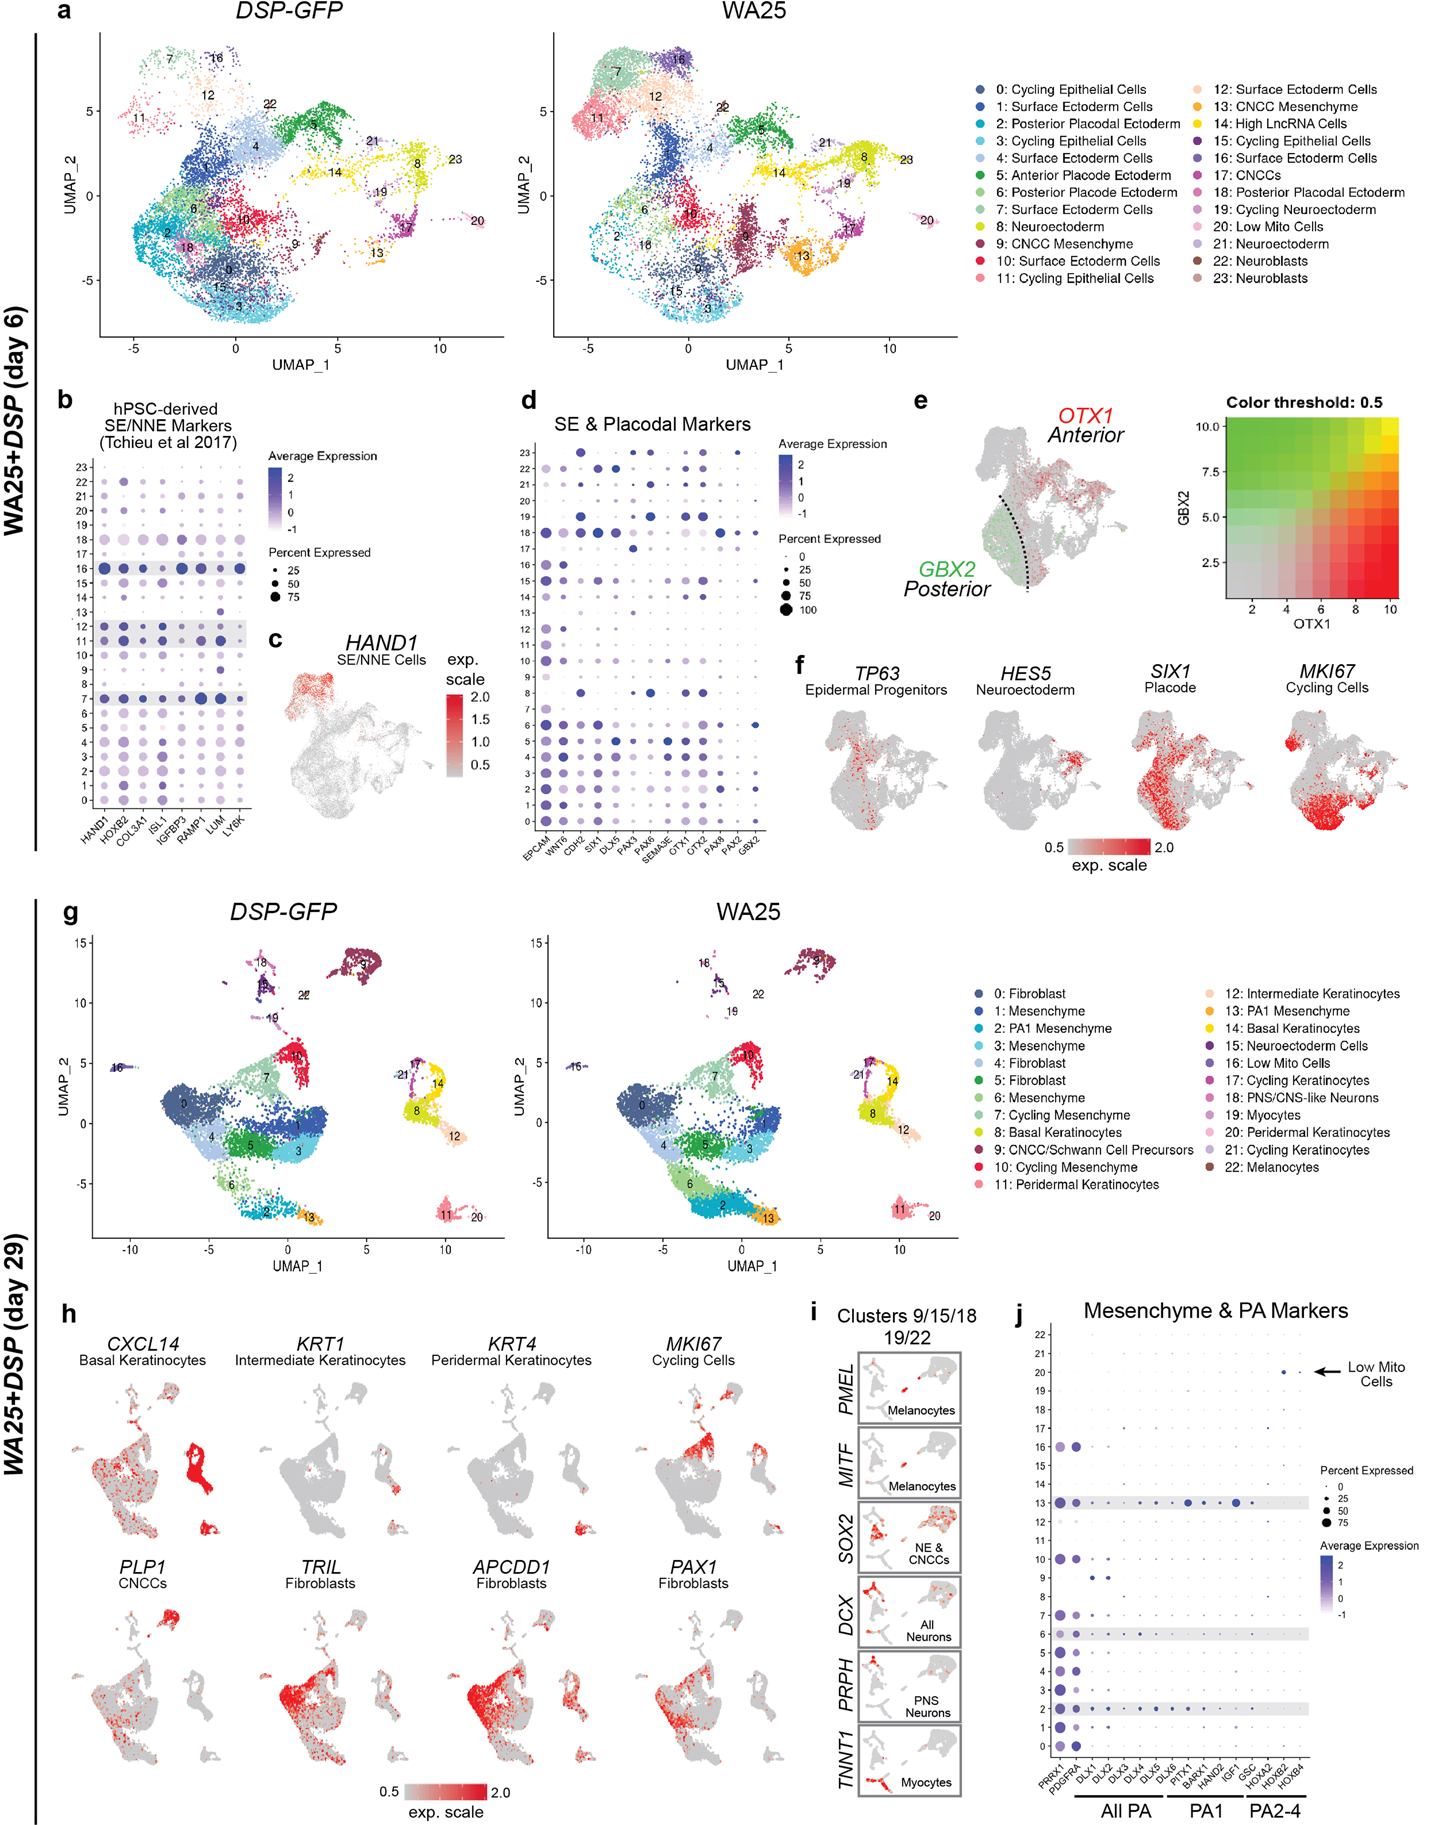
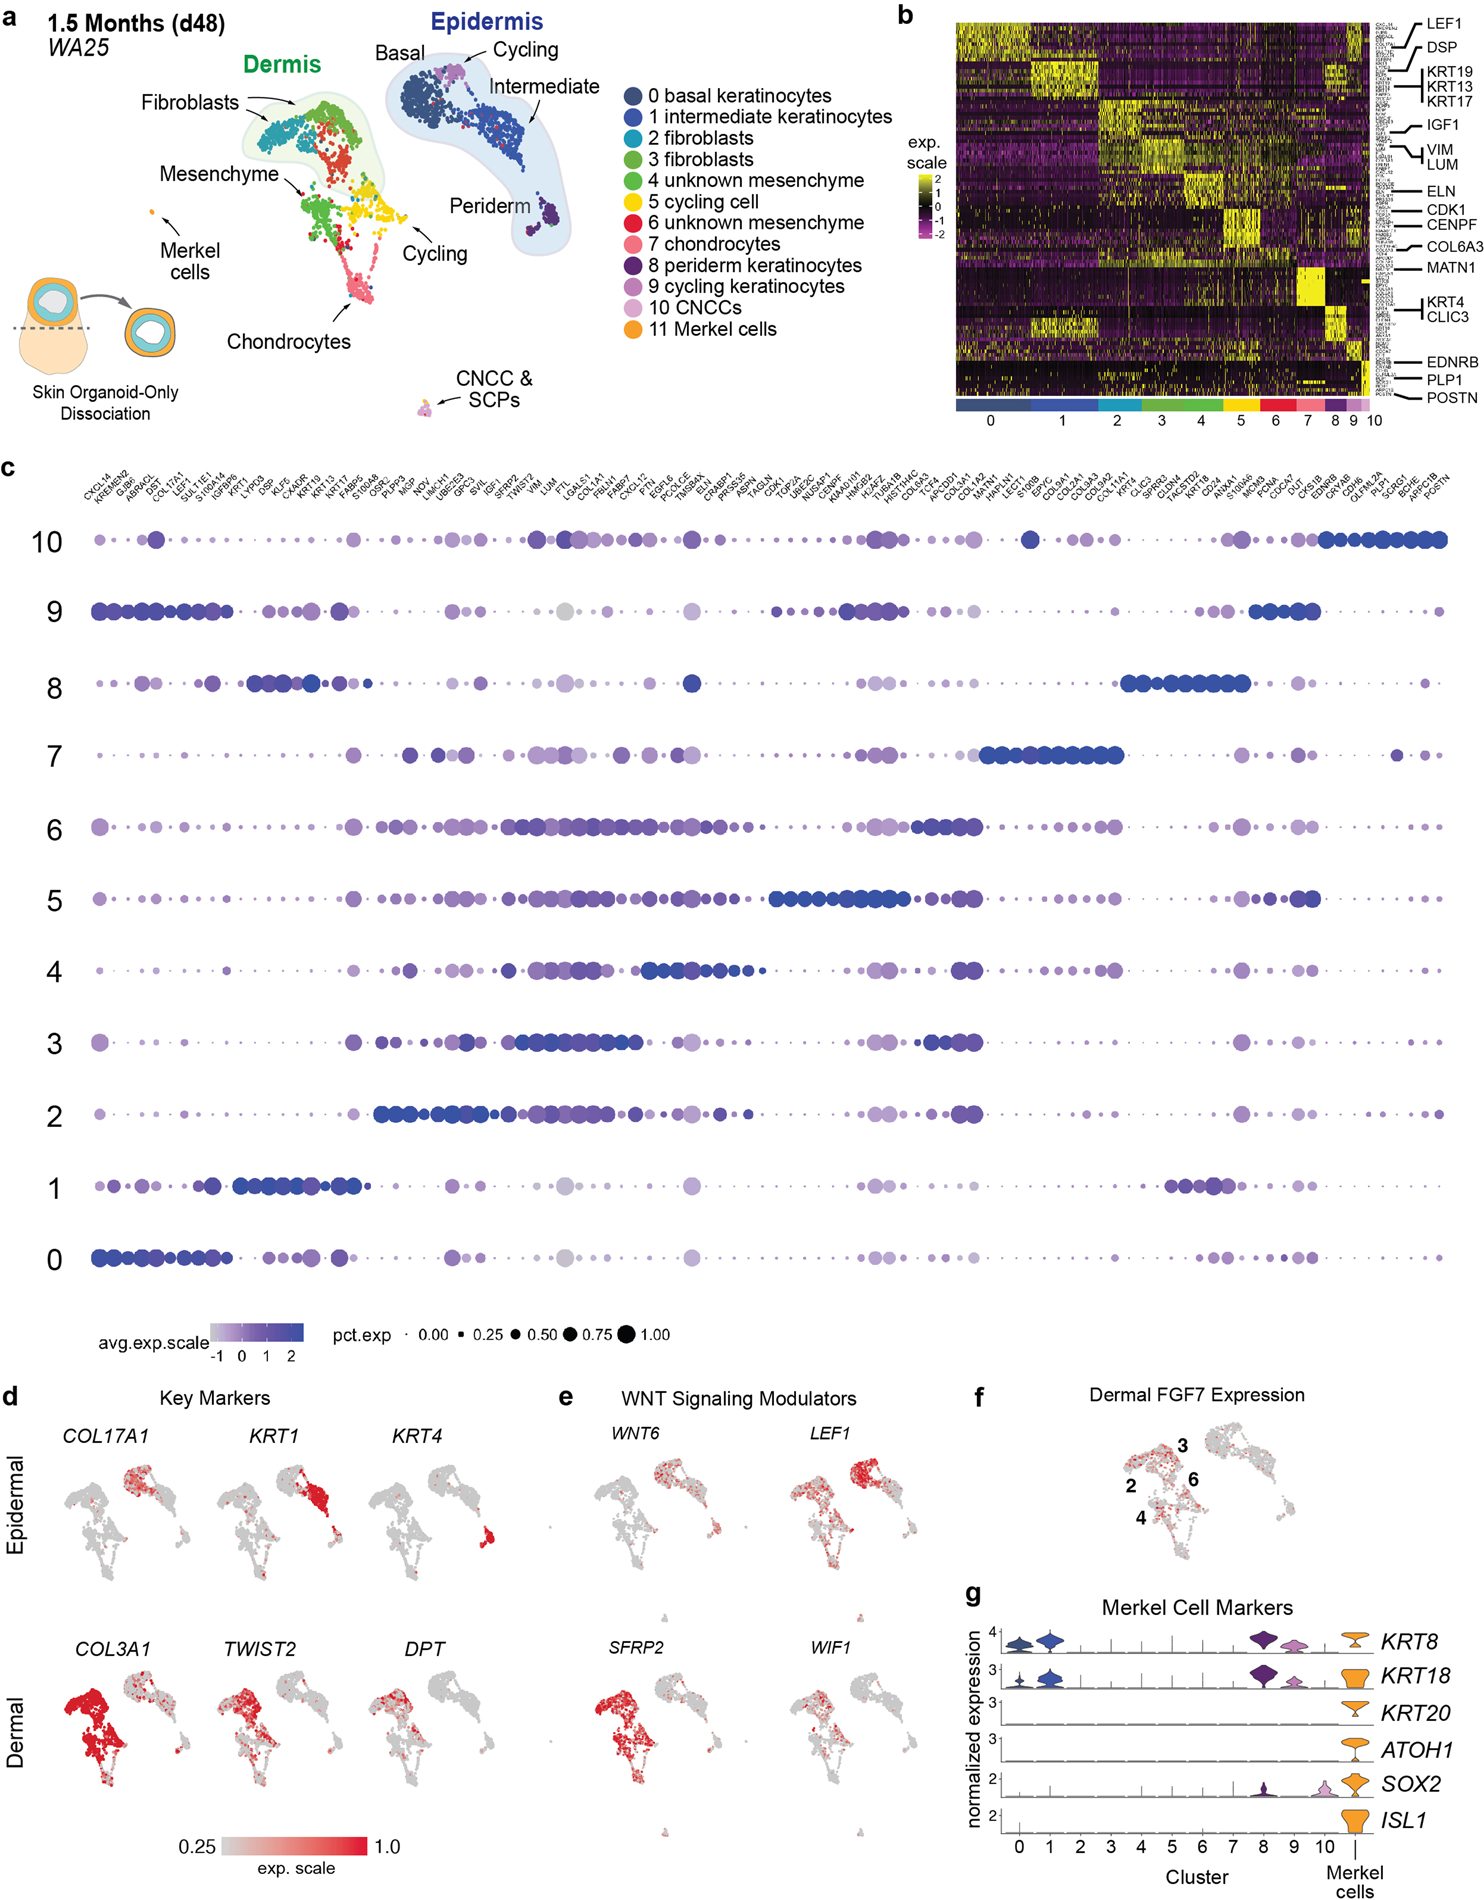
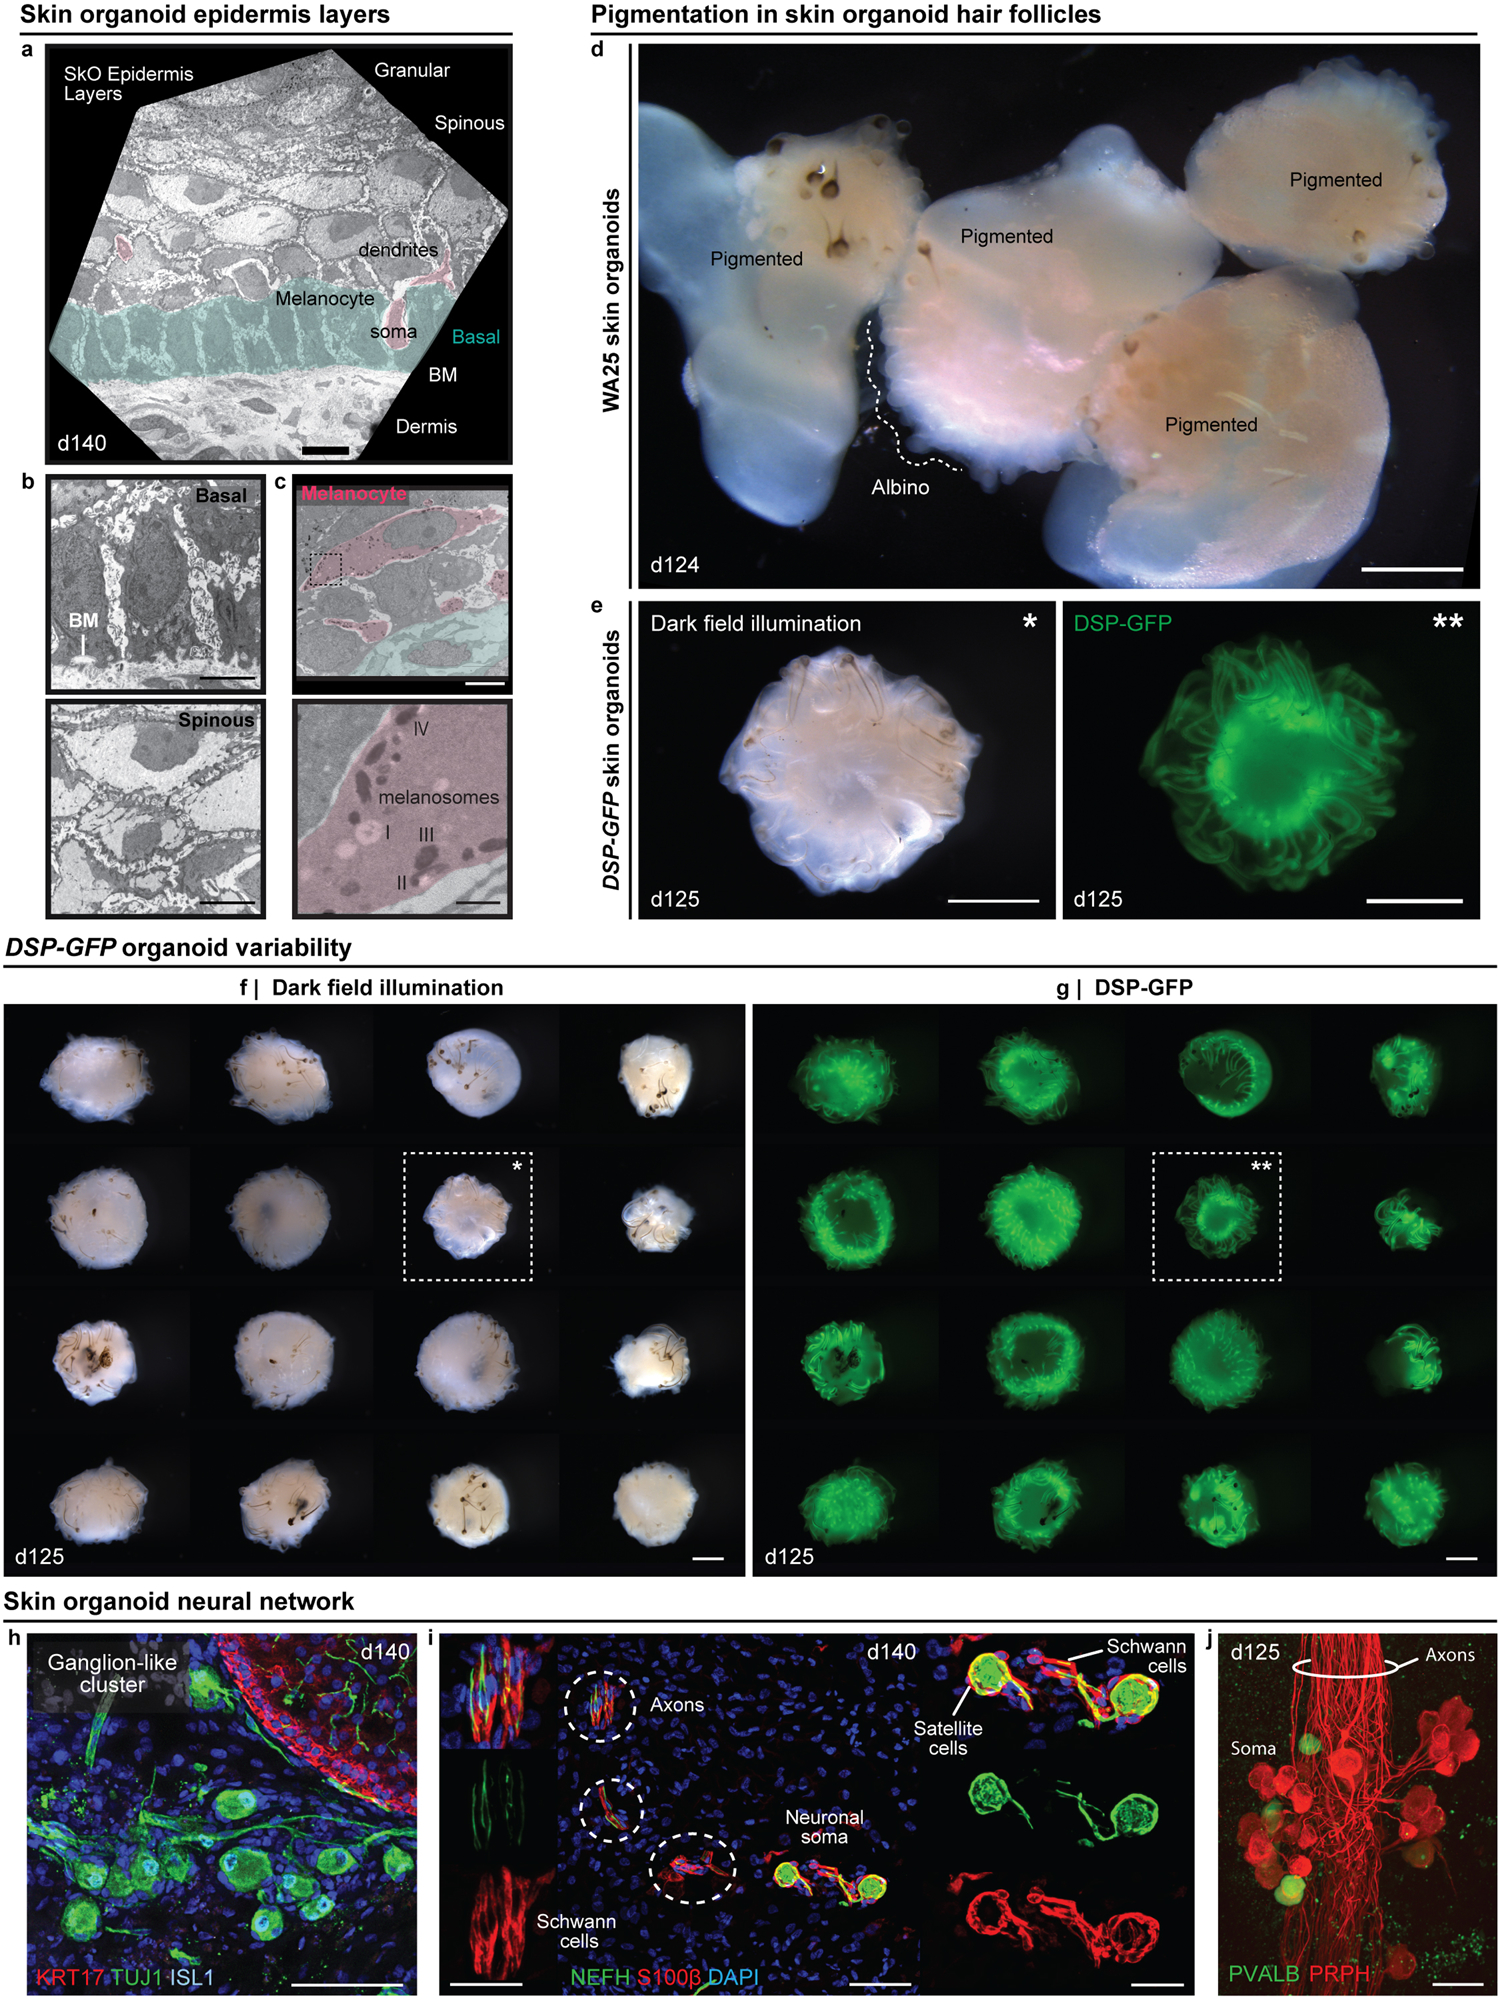
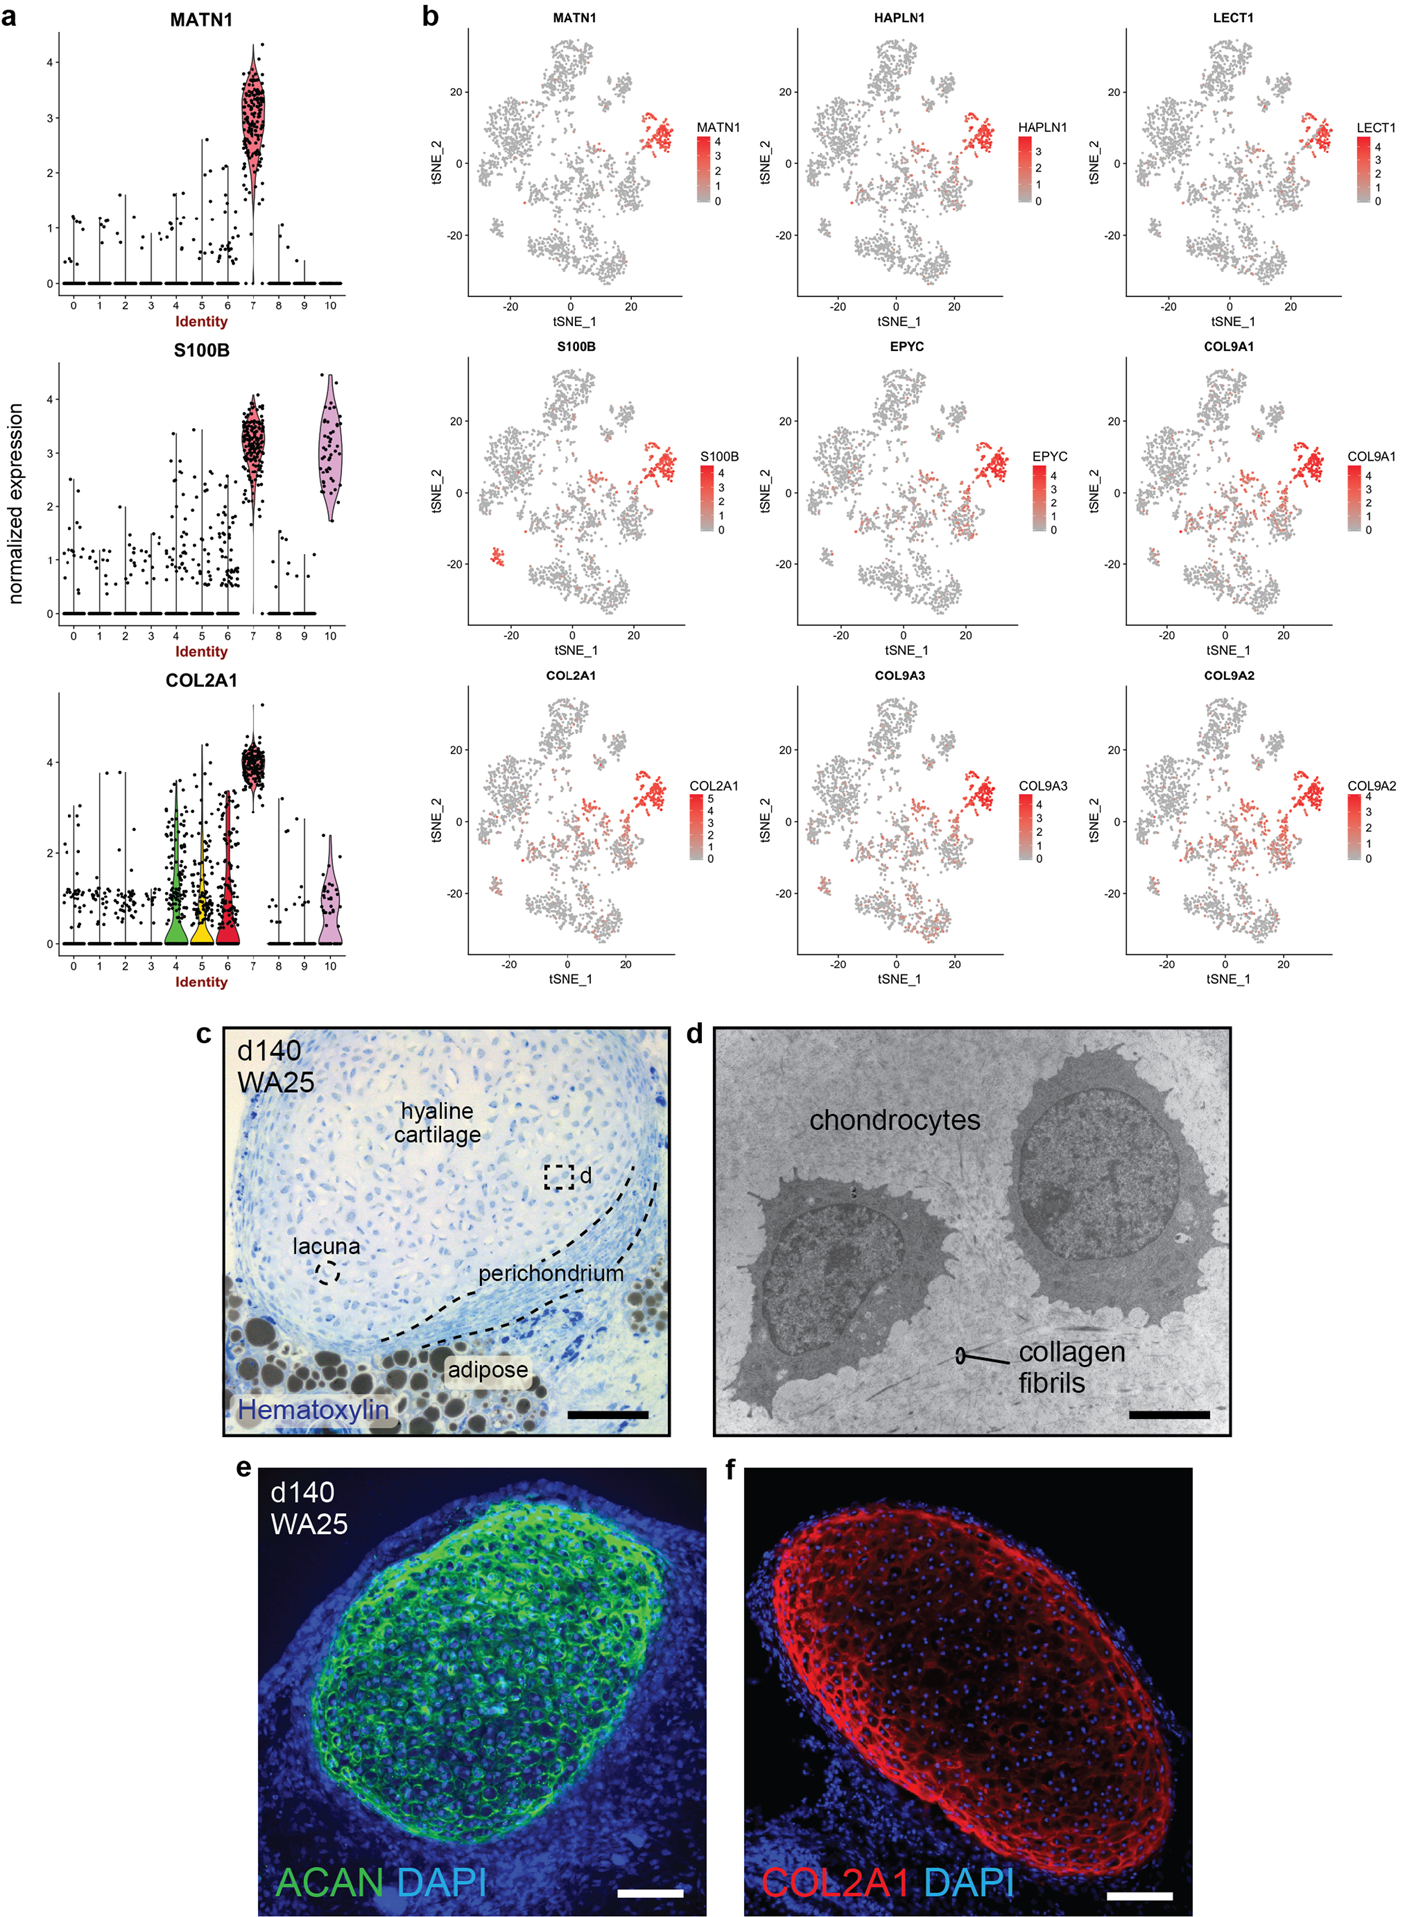
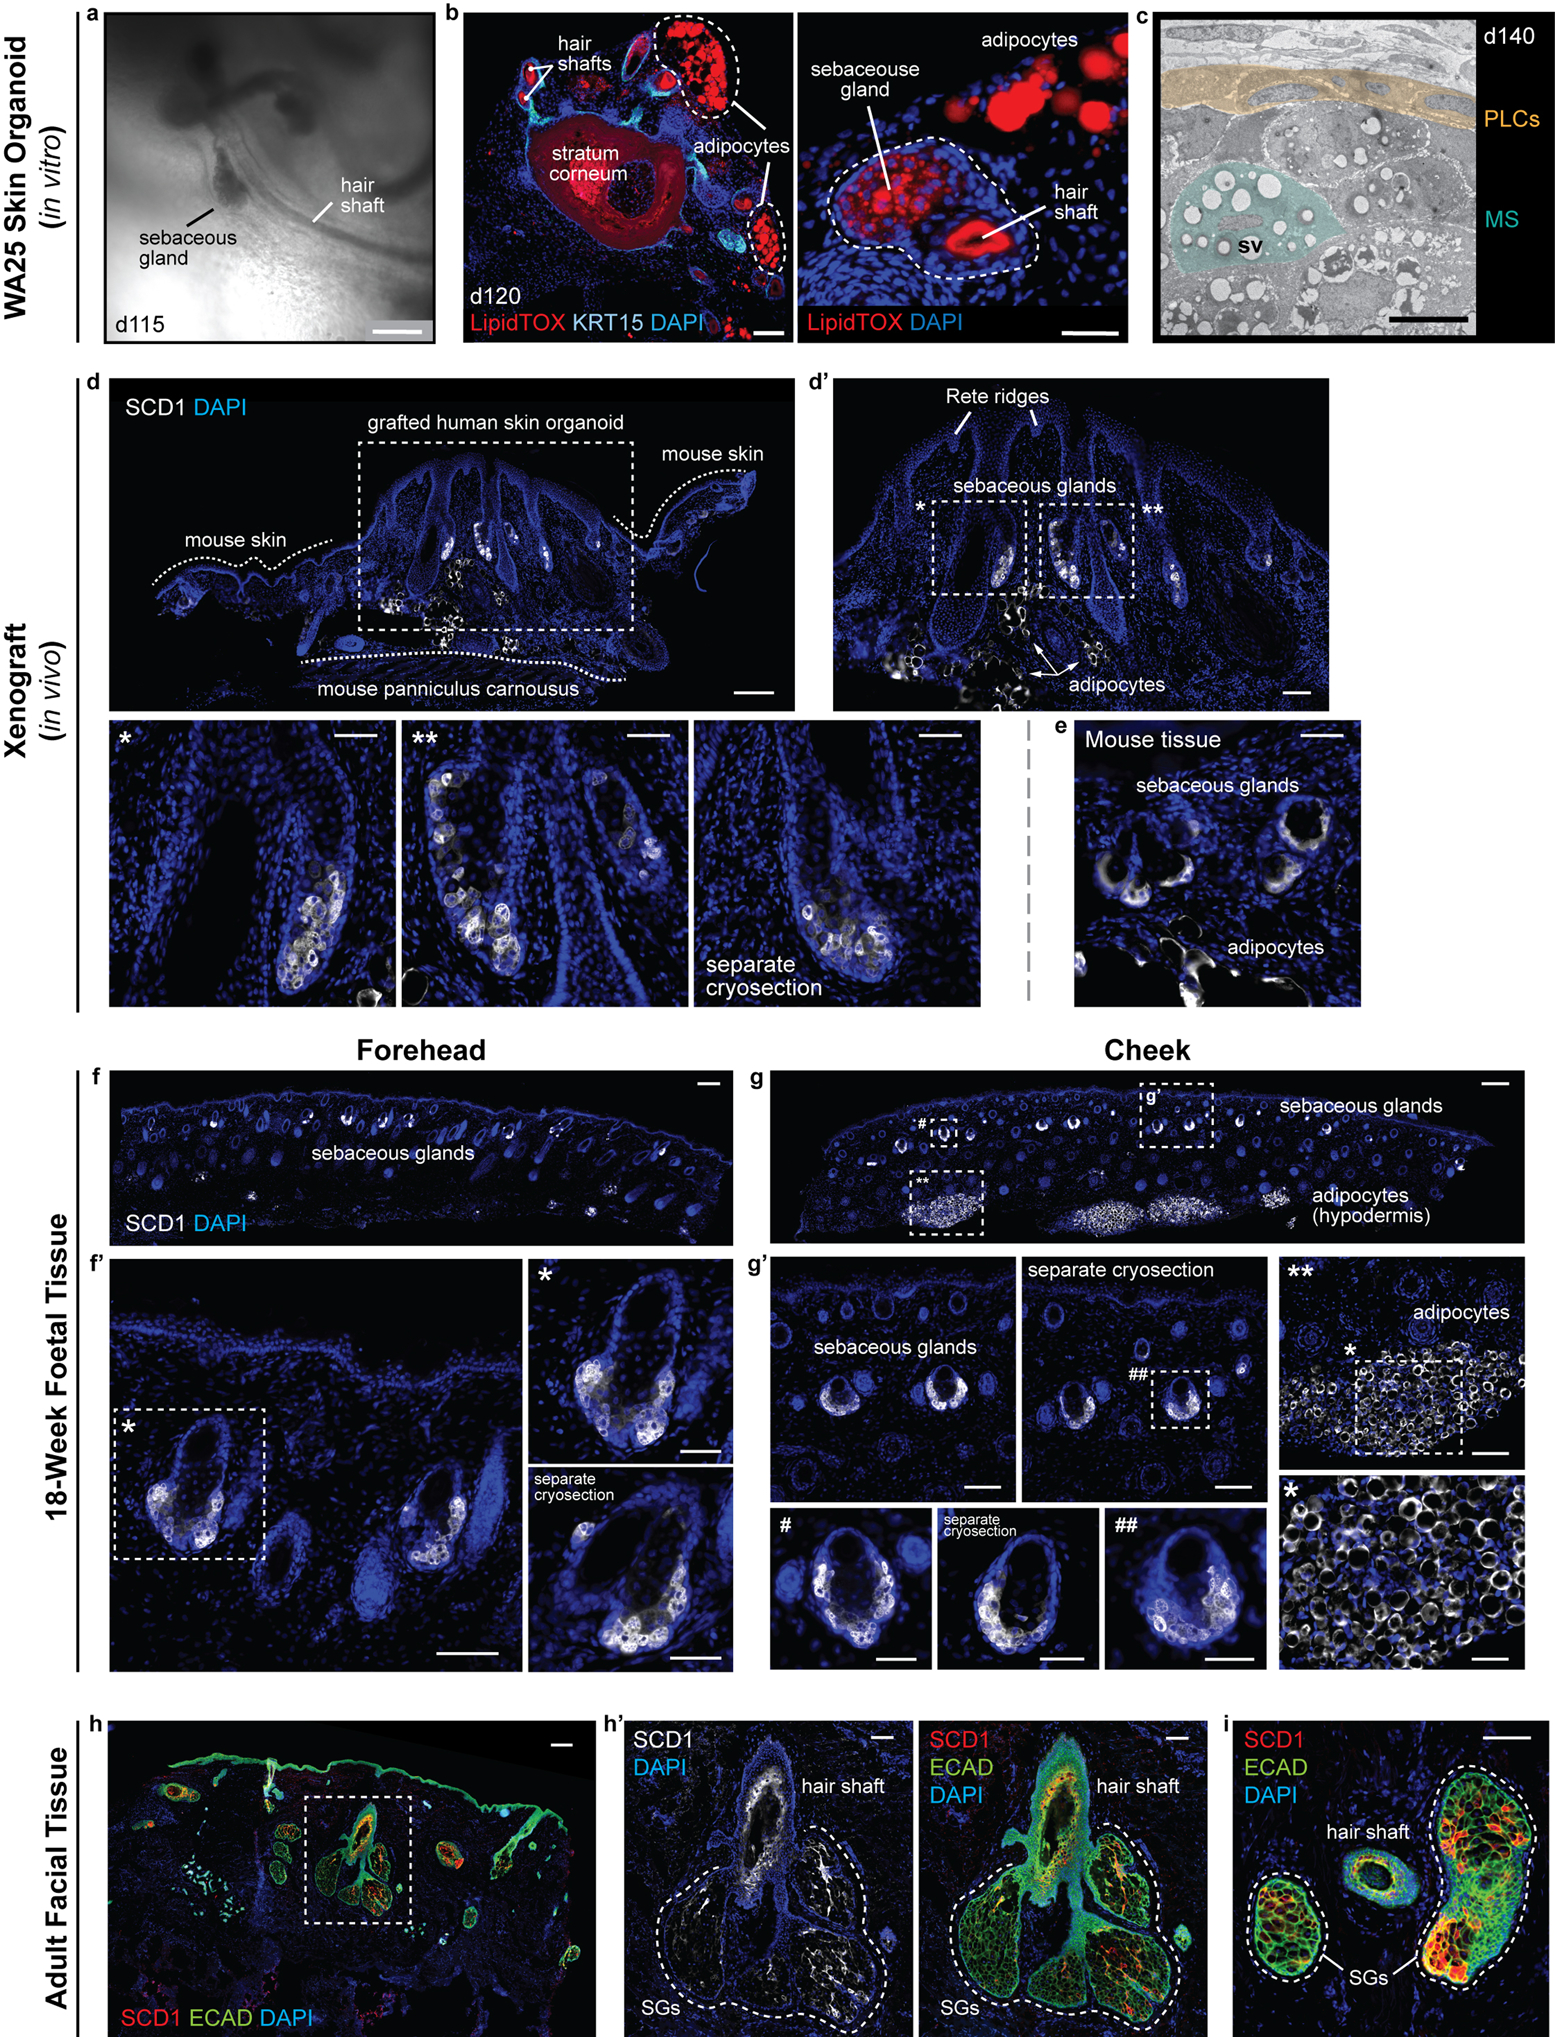
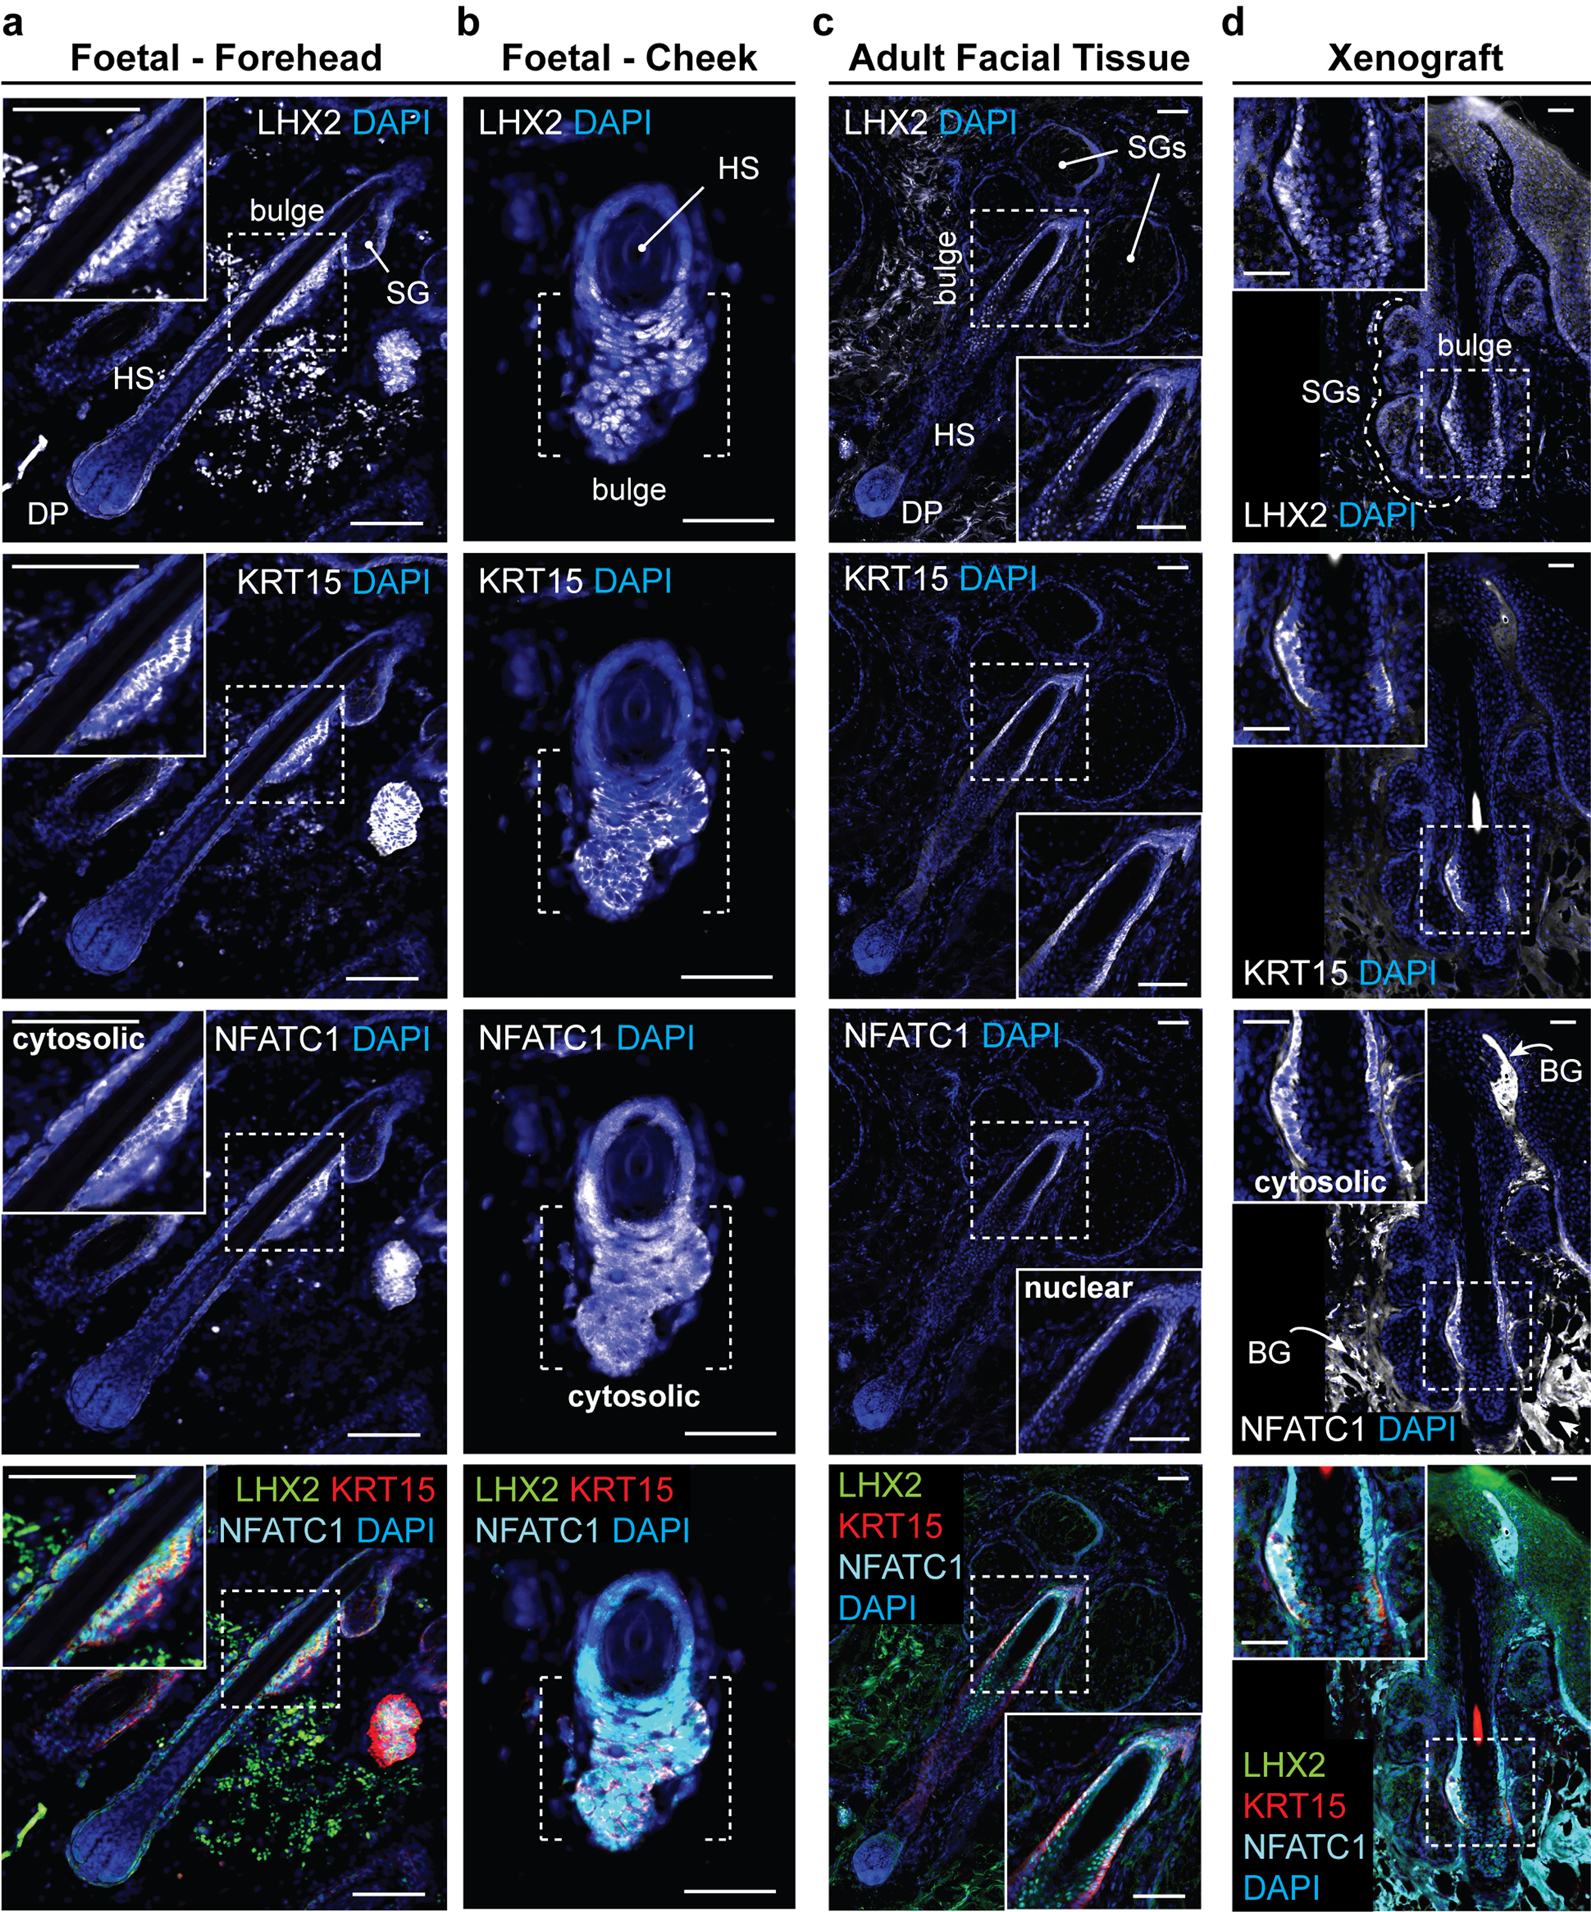
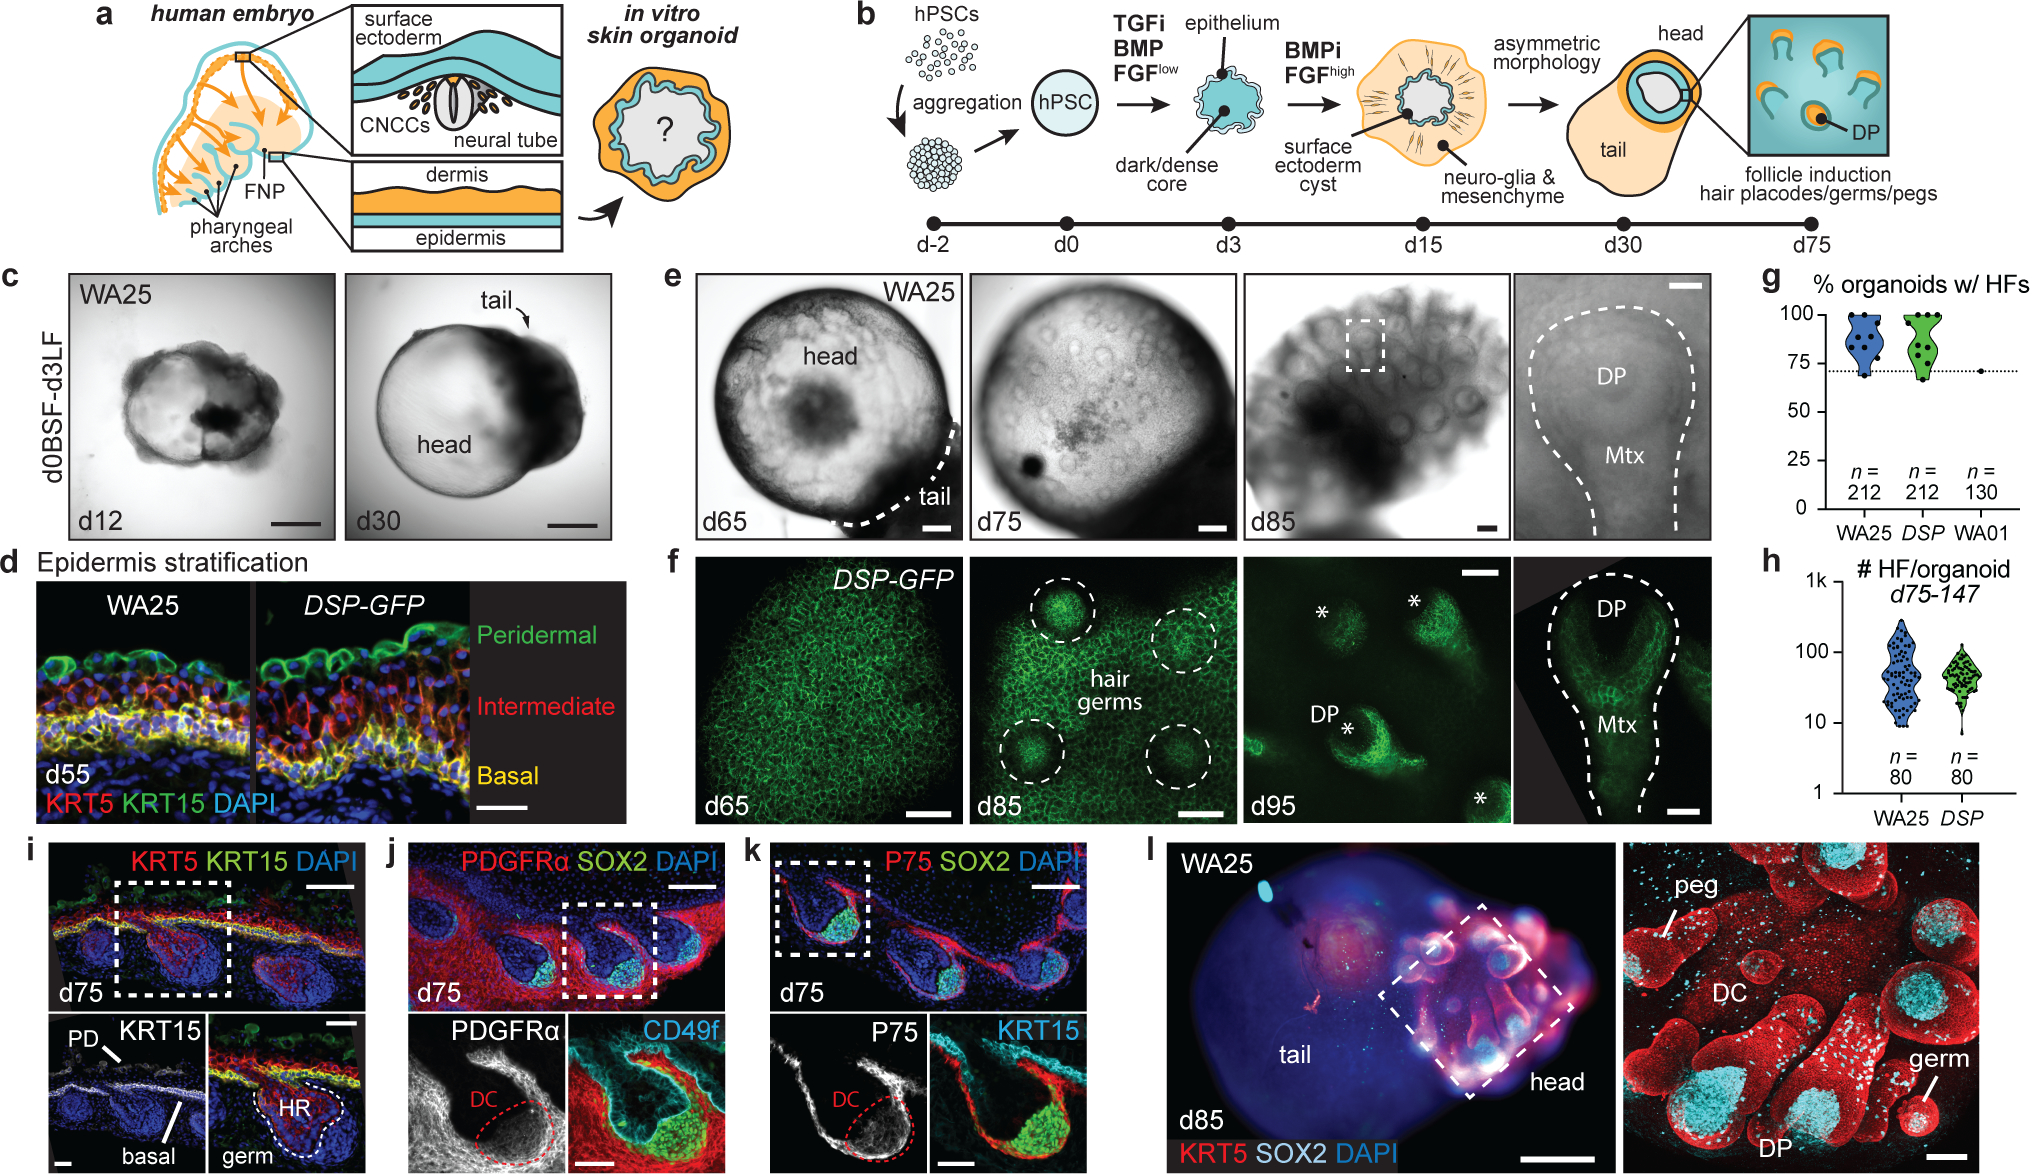
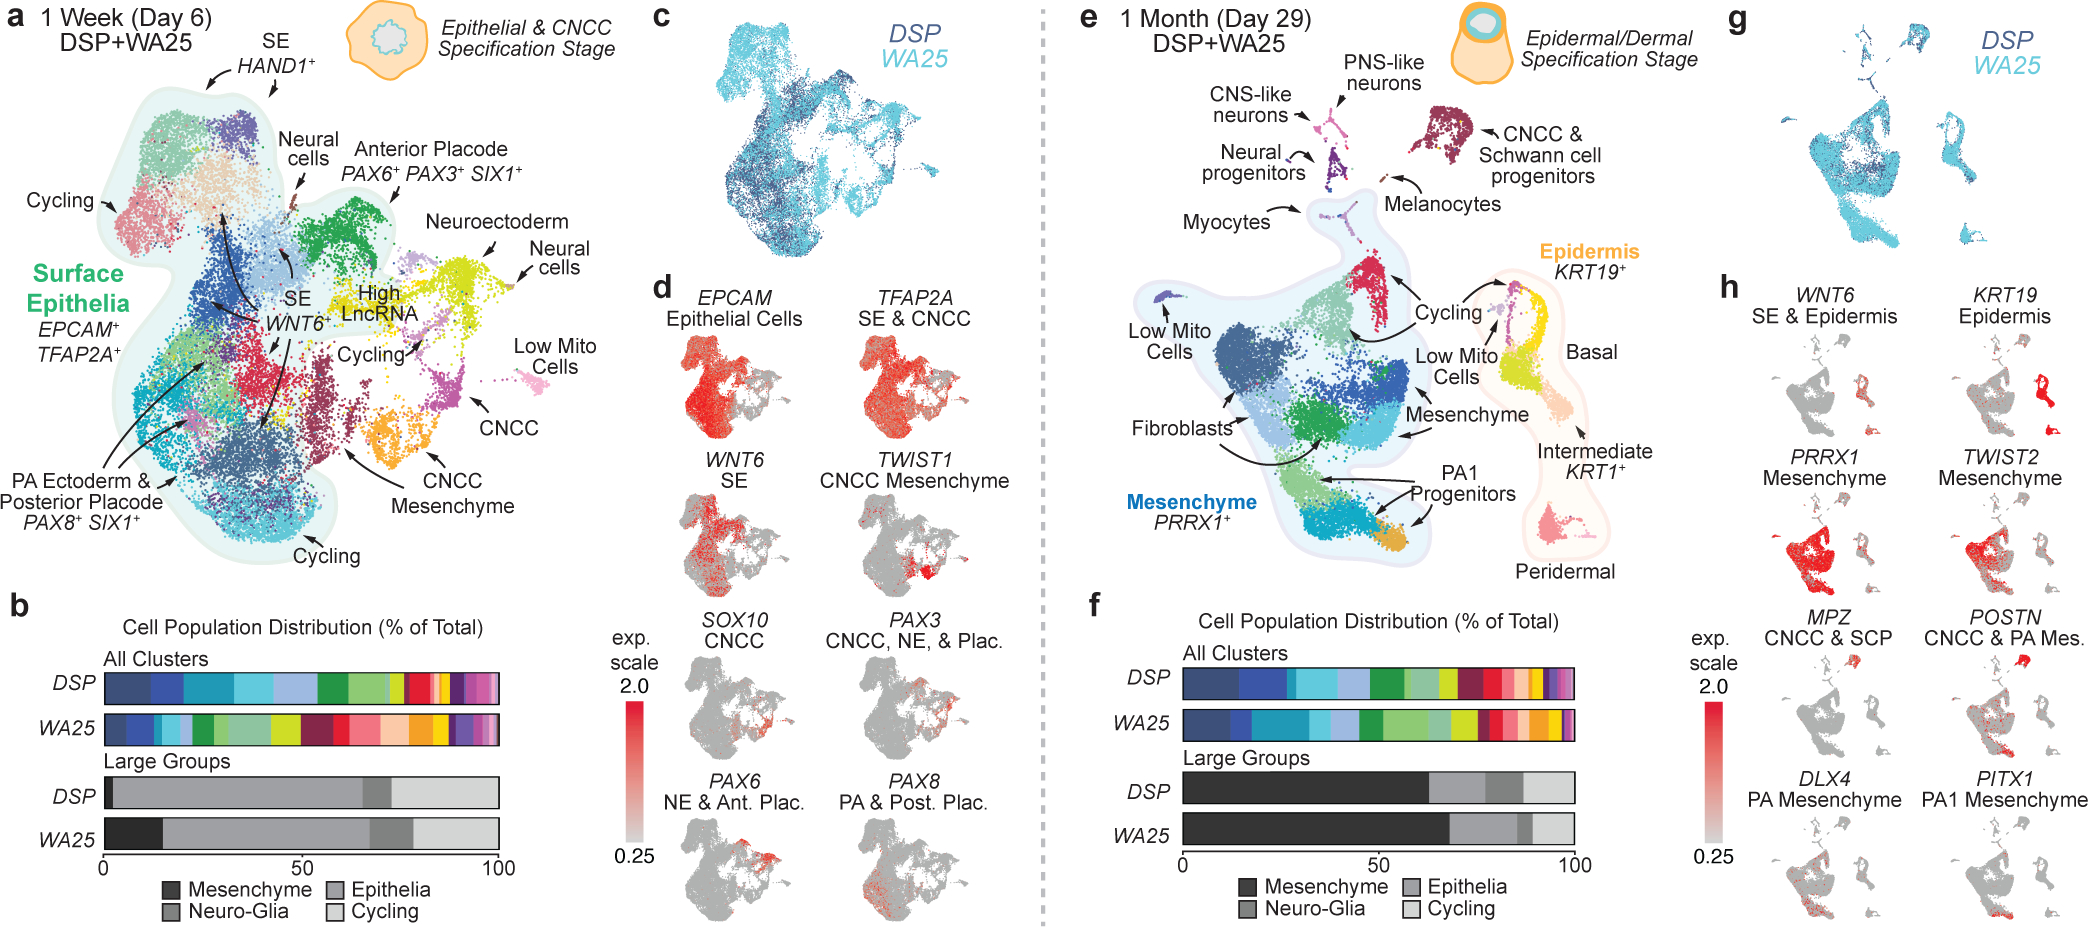
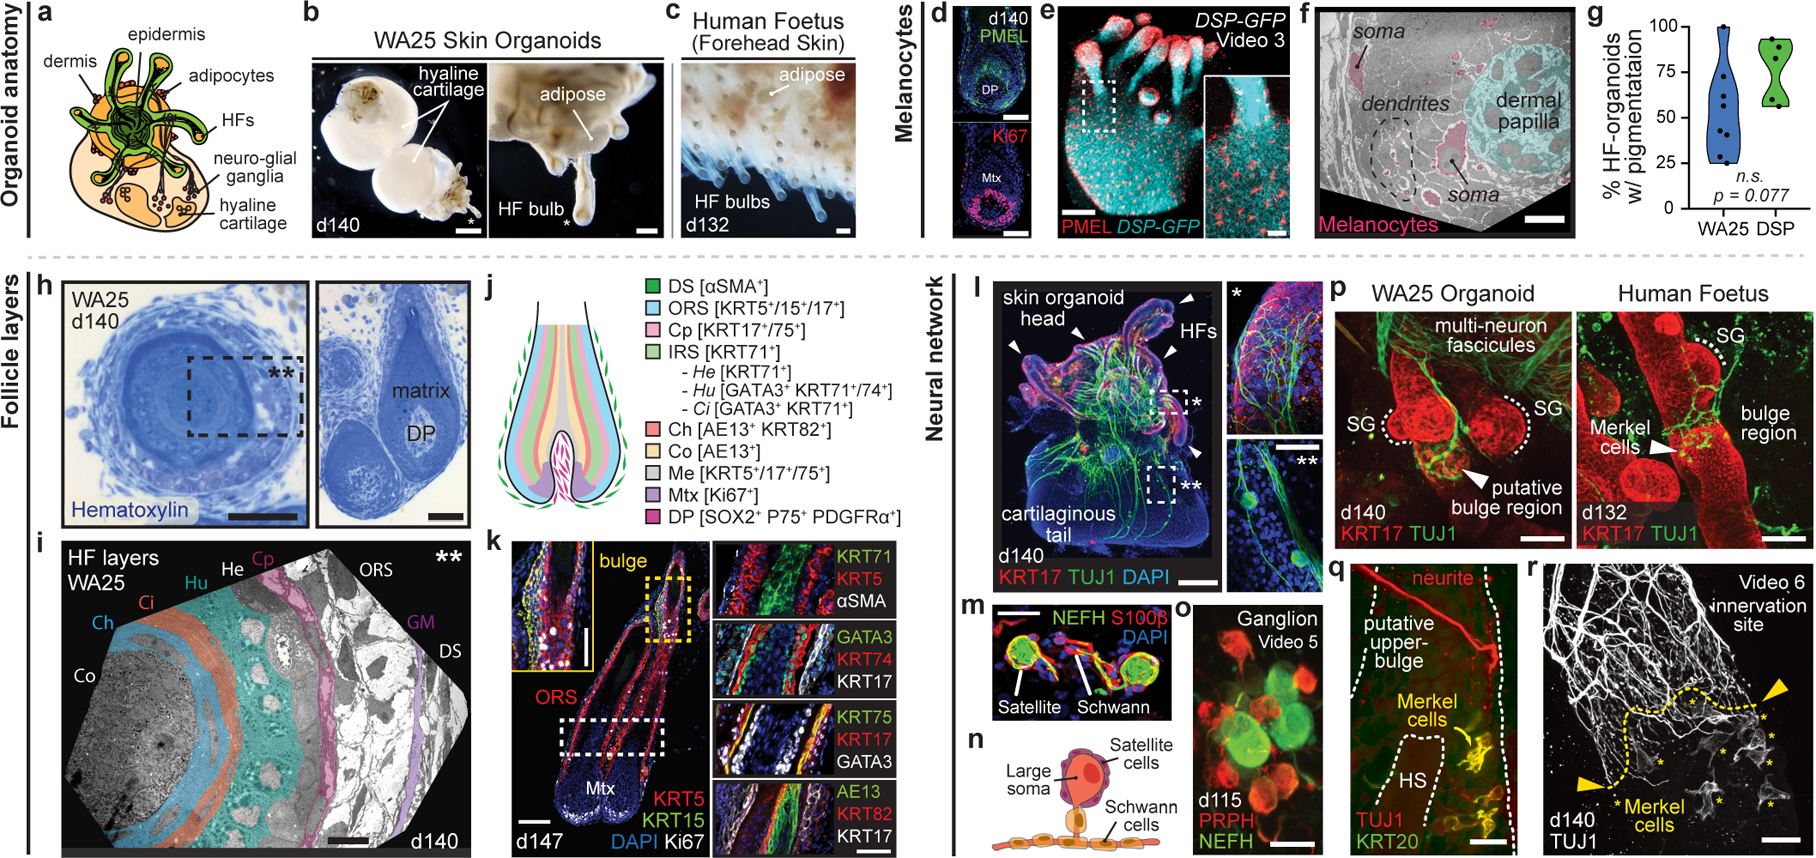
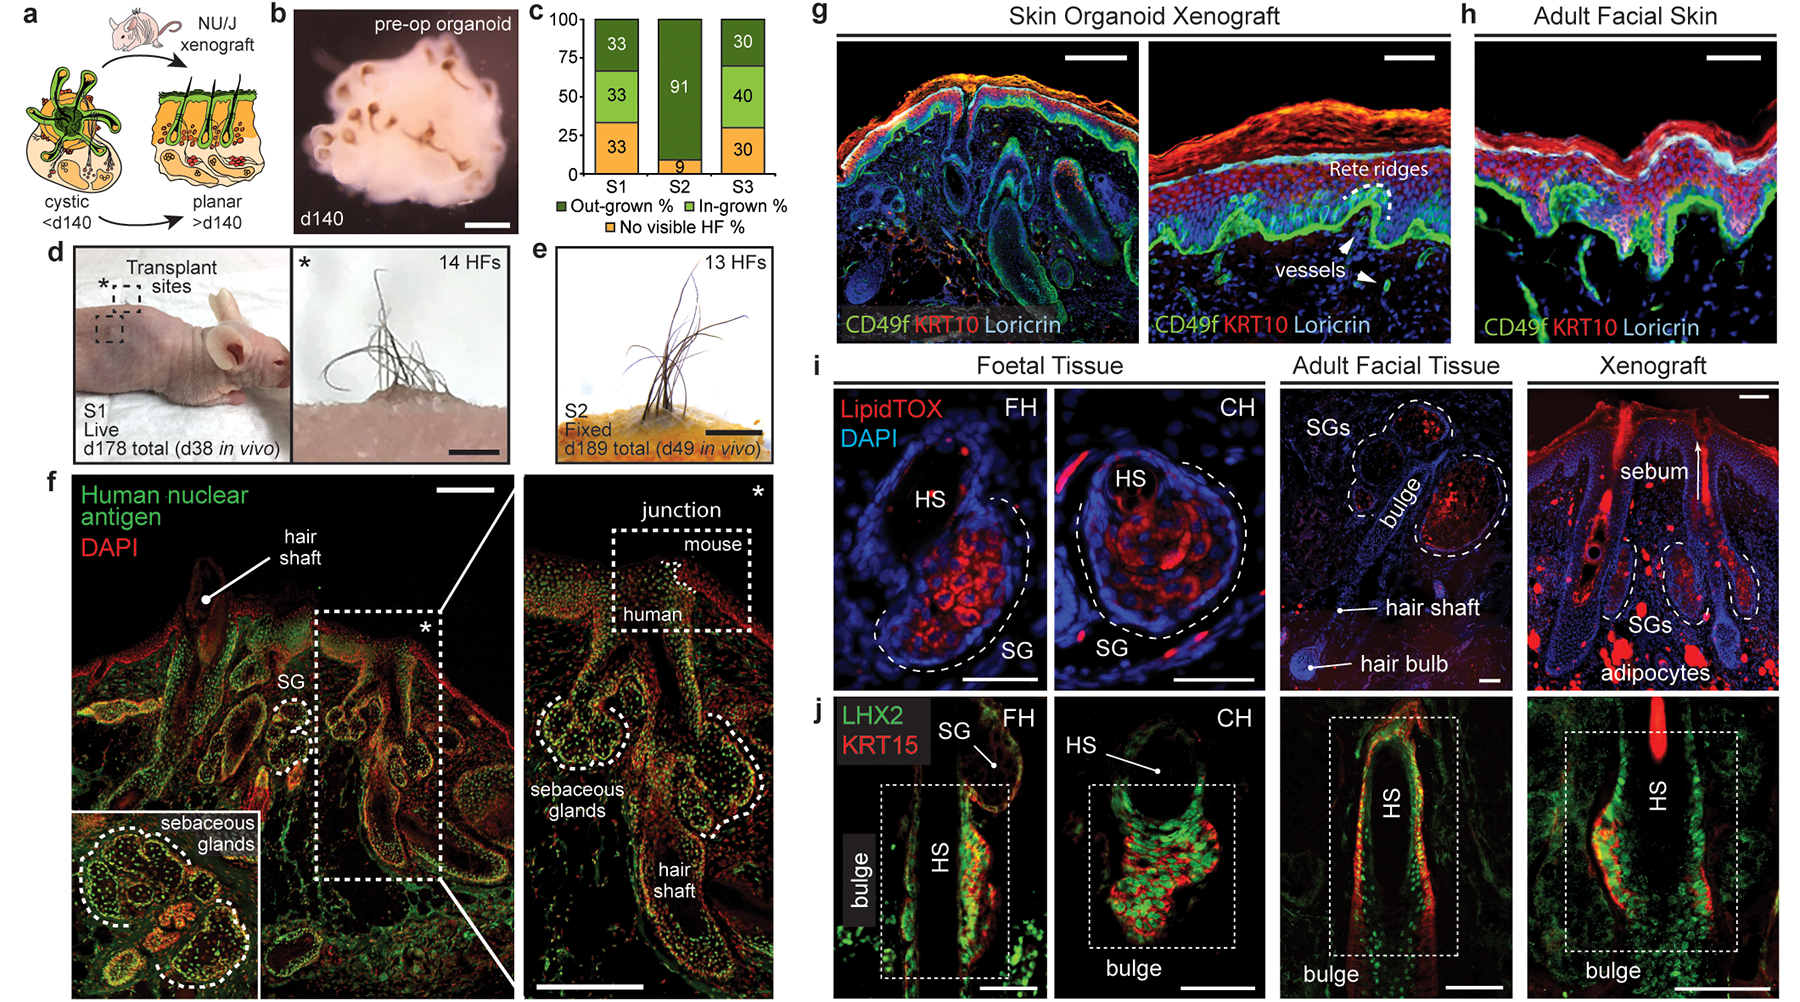
The skin is a multilayered organ, equipped with appendages (that is, follicles and glands), that is critical for regulating body temperature and the retention of bodily fluids, guarding against external stresses and mediating the sensation of touch and pain1,2. Reconstructing appendage-bearing skin in cultures and in bioengineered grafts is a biomedical challenge that has yet to be met3-9. Here we report an organoid culture system that generates complex skin from human pluripotent stem cells. We use stepwise modulation of the transforming growth factor β (TGFβ) and fibroblast growth factor (FGF) signalling pathways to co-induce cranial epithelial cells and neural crest cells within a spherical cell aggregate. During an incubation period of 4-5 months, we observe the emergence of a cyst-like skin organoid composed of stratified epidermis, fat-rich dermis and pigmented hair follicles that are equipped with sebaceous glands. A network of sensory neurons and Schwann cells form nerve-like bundles that target Merkel cells in organoid hair follicles, mimicking the neural circuitry associated with human touch. Single-cell RNA sequencing and direct comparison to fetal specimens suggest that the skin organoids are equivalent to the facial skin of human fetuses in the second trimester of development. Moreover, we show that skin organoids form planar hair-bearing skin when grafted onto nude mice. Together, our results demonstrate that nearly complete skin can self-assemble in vitro and be used to reconstitute skin in vivo. We anticipate that our skin organoids will provide a foundation for future studies of human skin development, disease modelling and reconstructive surgery.


Conflict of interest statement

COMPETING INTERESTS

J.L. and K.R.K, with the Indiana University Research and Technology Corporation, have submitted a patent application covering the entire skin organoid induction method and including much of the data presented in this manuscript (WO2017070506A1). The other authors declare no competing interests.

Figures

Extended Data Figure 1 |
Extended Data Figure 1 |. Overview of skin organoid induction in relation to normal human skin developmental events and its morphological changes under different treatment regimes.
a, Schematic overview of the skin organoid protocol; i) pre-aggregate hPSCs to form an aggregate, ii) induce differentiation of aggregate to form surface ectoderm and cranial neural crest cells (CNCC) by modulating TGF and BMP signaling pathways, and iii) provide sufficient environment for aggregate to mature itself into a complex skin organoid unit composed of fully stratified skin with dermal layer, producing hair follicles, sensory neurons, and cartilages. The cystic skin organoid can be transplanted and integrated into the back skin of a mouse as a planar layer and out-grow hair follicles. b, Comparison of in vitro and in vivo skin development timelines. Note that developmental timing is approximate. c, Representative differential interference contrast (DIC) and endogenous GFP fluorescence images of WA25 and DSP-GFP skin organoids on different days of differentiation under different treatment regimes. (upper) WA25 skin organoid were differentiated in E6-based medium culture under three different day-3 treatment conditions - no LDN nor FGF, LDN only, and LDN/FGF - and monitored during days 0–60. Day-3 no LDN nor FGF treated aggregates maintained cystic organoids for about 30 days of differentiation, but the organoids lost their morphology and shrunk afterwards. Day-3 LDN only treatment promoted cystic morphology, but was not sufficient to produce hair-bearing skin organoids in a consistent manner. Co-treatment of LDN and FGF on day-3 (final optimized treatment condition) was optimal for epithelial stratification and sufficient dermal layer development. Tail-like region containing mesenchymal and neuronal cells on one pole of skin organoids are visible by day-18 of differentiation. (lower) DSP-GFP skin organoids were also differentiated in E6-based medium with day-3 treatment of LDN/FGF (final optimized treatment regime). GFP+ epithelium is visible on the surface/edge of the sphere-like organoid, and the GFP signal intensifies as the organoids differentiate and mature further. The tail portion of the organoid appears by day 22 of differentiation (GFP+ signal at the tail portion presented in the day 22 image is an autofluorescence). (right) WA25 skin organoid were differentiated in CDM-based medium under three different day-4 treatment conditions - no LDN nor FGF, LDN only, and LDN/FGF. By differentiation day-55, aggregates that were treated with neither LDN nor FGF eventually lost their shape and shrunk. Day-4 LDN treatment maintained cystic organoid morphology, and occasionally induced maturation of skin organoids. Co-treatment of LDN and FGF on day-4 of differentiation was suitable for skin organoids to fully mature in a relatively consistent manner. Note: Substitution of CDM- to E6-based differentiation medium improved skin organoid development by reducing the tail portion (non-skin related mesenchymal cells) and increasing the head – skin – portion. Optimization experiments were repeated at least three times independently. Scale bars, 500 μm (all panels). Corresponds with data/concepts in Fig. 1.
Extended Data Figure 2 |
Extended Data Figure 2 |. Surface ectoderm and CNCC induction in WA25 and DSP-GFP skin organoid cultures.
a-d, Representative immunostaining images of day-16 (a, b) WA25 and (c, d) DSP-GFP aggregates with co-induced epithelium and CNCCs under optimized d0BSF-d3LF treatment culture. P75 and SOX10 highlight neuro-glial-associated CNCCs, and PDGFRα and TFAP2A highlight mesenchyme-associated CNCCs. (a, b) Epithelium is highlighted by ECAD and TFAP2A double-positive signals. (c, d) ECAD was omitted to allow observation of the endogenous DSP-GFP signal at the apical surface of the epithelium. Dashed boxes indicate magnified regions presented in the right-end panels. Dashed lines outline the borders between the epithelium and CNCCs and between neuro-glial- and mesenchyme-associated CNCCs. Note that there are nonspecific fluorescence background noise signals from Matrigel. Immunostaining was repeated three times independently on a total 9 aggregates from 3 separate experiments. Scale bars: 100 μm (a-d), 50 μm (magnified panels). Corresponds with concepts/data in Fig. 1c.
Extended Data Figure 3 |
Extended Data Figure 3 |. Comparison of initial hair follicle induction in WA25 and DSP-GFP live-cell aggregates.
a, Representative DIC images of days 65–130 WA25 skin organoids with developing HFs. b, DIC and endogenous GFP fluorescence images of days 65–135 DSP-GFP skin organoids with developing HFs. c, DIC images of days 68–98 WA01 skin organoids with developing HFs. Magnified view of day-88 WA01 skin organoid HFs is shown in the last panel. Note that the head (skin cyst)-and-tail (non-skin mesenchymal) portions within skin organoids are distinguishable. Also, note that the hair bulbs are facing outward of the organoid, contacting medium, while the hair shafts grow inward toward the center of the skin organoid. Dashed boxes indicate magnified regions. Scale bars: 500 μm (a; left panels, b; left/middle panels), 250 μm (a & b; right panels, c; all panels except last panel), 100 μm (b; d65 & 85 right panels), 50 μm (c; last panel). WA25 and DSP-GFP skin organoid images represent morphologies observed throughout 9 independent cultures, and WA01 skin organoid images represent one experiment performed by the Stanford group. Corresponds with data in Fig. 1e and f.
Extended Data Figure 4 |
Extended Data Figure 4 |. Key protein markers of hair follicle induction in skin organoids.
a, Day-75 WA25 skin organoid with nascent hair follicles immunostained for KRT5, KRT17, and TFAP2A. Note that this KRT17 antibody labels basal and peridermal keratinocytes. KRT5 and TFAP2A double-positive staining represents basal layer, and TFAP2A single-positive staining between basal and peridermal layers indicates intermediate layer. Dashed box region is presented in a high-magnification image. b, Immunostaining for ECAD on day-75 WA25 skin organoids labels the entire epithelium, whereas PCAD expression is restricted to the basal layer and the hair germ epithelium. LHX2 labels hair placode and matrix cells. Close up hair germ images in dashed boxes are presented on the right top corner in each panel as insets. c, Immunostaining for EDAR on day-75 WA25 skin organoids labels placodes and matrix cells of hair follicles. d, Low magnification immunostaining image of a day-75 WA25 organoid shows the distribution of KRT5 and TFAP2A expression, representing basal and intermediate layers. Note that the nonspecific fluorescence signal in the core of the skin cyst is cell debris. Asterisks indicates developing hair follicle placodes and germs. e, Representative immunostaining image for PDGFRα and SOX2 on a day-85 WA25 skin organoid. PDGFRα is expressed throughout the dermis developed in the outer layer of skin cyst, and SOX2 labels dermal condensate and dermal papilla cells, yet is also expressed in some basal epidermal cells—likely Merkel cells. f, By day-75 of differentiation, NPNT (nephronectin) is localized to the basement membrane of WA25 skin organoid epithelia. g, In an immunostaining image of a day-147 WA25 skin organoid, ⍺SMA (alpha-smooth muscle actin)+ ITGA8 (integrin-alpha-8)+ arrector pili muscle-like feature was detected along with the NPNT+ hair follicle bulge region, residing next to each other, suggesting the potential capability of producing arrector pili muscle in our skin organoid. However, this feature is extremely rarely observed in our current culture condition, which is still at an early developmental stage that further optimization of medium for long-term culture is necessary. Dashed boxes indicate magnified bulge region with arrector pili muscle-like phenotype presented on the right panels. Dermal papilla (DP). h, Immunostaining of a day-95 DSP-GFP skin organoid showing a hair peg with KRT17+ peridermal layer and outer root sheath, SOX2+ dermal papilla, and GFP+ desmosome-rich intermediate epidermis of the hair follicle. All immunostaining was repeated at least 3–5 times on 9–12 skin organoids generated from 4 independent experiments prior to selection of representative images. Scale bars: 250 μm (b-first panel), 100 μm (a, b-all magnified panels, d, f, g), 50 μm (c, e, h), 23 μm (b-all insets). Corresponds with data in Fig. 1.
Extended Data Figure 5 |
Extended Data Figure 5 |. Single-cell RNA-seq analysis of day-6 and day-29 skin organoids derived from WA25 and DSP-GFP cells.
a, g, Separate uniform manifold approximation projections (UMAP) for WA25 and DSP-GFP cell clusters at day-6 and day-29. The major cell cluster groupings of surface epithelia, epidermis, and mesenchyme are noted. Colours indicate cell state. The presumptive cell identities, based on a priori knowledge of marker genes, are listed. Cell clusters with no discernable identity had either low mitochondrial or high long non-coding RNA gene expression and are labeled “Low Mito Cells” and “High LncRNA”, respectively. n = day-6: 11,785 WA25 cells, 11,544 DSP-GFP cells; day-29: 9,268 WA25 cells, 9,013 DSP-GFP cells. Ten day-6 organoids from one experiment and five day-29 organoids from one experiment were randomly pooled for scRNA-seq analysis (per cell line). b, Dot plot for SE and NNE markers based on RNA-seq data from Tchieu et al. Cell Stem Cell 2017. c, UMAP plot for HAND1, a key marker for NNE cells derived from hPSCs. d, Dot plot for SE and anterior-posterior placodal markers. Gene expression frequency is indicated by spot size and expression level is indicated by colour intensity. e, UMAP overlay plot showing the distribution of OTX1 (Anterior placode/Neuroectoderm marker) and GBX2 (Posterior placode marker). f, UMAP plots for key markers of epidermal progenitors, neuroectoderm, general placode, and cycling cells. h, UMAP plots for specific marker genes that define epidermal, cycling, CNCC, and dermal cell subtypes. i, Magnified view of clusters 9 (CNCC and Schwann Cell Precursors), 15 (Neuroectoderm Cells), 18 (PNS/CNS-like Neurons), 19 (Myoctyes), 22 (Melanocytes). Key marker genes are displayed to label each cell cluster. SOX2 has broad expression across Neuroectoderm and CNCCs. j, Dot plot for general mesenchymal (PRRX1, PDGFRA), PA, PA1, and PA2–4 markers. Gene expression frequency is indicated by spot size and expression level is indicated by colour intensity. Note expression of HOX genes appears limited to a subset of high LncRNA gene expressing cells. Abbr: surface ectoderm (SE); non-neural ectoderm (NNE); cranial neural crest cell (CNCC); pharyngeal arch (PA). Corresponds with data in Fig. 2.
Extended Data Figure 6 |
Extended Data Figure 6 |. Single-cell RNA-seq analysis of day-48 skin organoids derived from WA25 cells.
a, UMAP clustering of day-48 WA25 cell subtypes. Colours indicate cell state. n = 2491 cells. Six day-48 skin organoids from one experiment were pooled for scRNA-seq analysis. b, Heatmap displaying the scaled LogNormalize (ln)-expression of the top 10 differentially expressed genes per cell cluster for the day-48 WA25 scRNA-Seq dataset. c, Dot plot array displaying the top 10 positively expressed genes per cell cluster for the day-48 WA25 scRNA-Seq dataset. Gene expression frequency is indicated by spot size and expression level is indicated by colour intensity. d, UMAP plots for cell subtype specific marker genes. e, UMAP plots for WNT signalling pathway genes. Note that WNT6 is expressed in basal keratinocytes and peridermal keratinocytes. LEF1 expression appears localized to basal keratinocytes. Negative WNT modulatory genes, SFRP2 and WIF1, are expressed in putative dermal fibroblasts of the mesenchymal cell group. f, Dermal fibroblast clusters also contain cells expressing FGF7 (also known as Keratinocyte Growth Factor). The numbers of cell clusters with positive expression are listed on the UMAP plot. g, Merkel cell identification: Using the UMAP clustering algorithm, we identified a subset (n = 8 cells) of cluster (C)-0 cells (putative basal keratinocytes) that were completely separated from the majority of C-0 cells, suggesting that our unbiased analysis pipeline failed to identify a unique subset of low-abundance cells. We used the Seurat manual selection tool to generate an 11th cluster containing these cells (see left side of panel “a”). Violin plots show normalized gene expression of the Merkel cell marker genes ATOH1, ISL1, SOX2, KRT8, KRT18, and KRT20.
Extended Data Figure 7 |
Extended Data Figure 7 |. Pigmentation in WA25 and DSP-GFP skin organoid hair follicles.
a, TEM image of epidermis in a day-140 WA25 skin organoid. A melanocyte cell body is pseudo-coloured pink, and basal skin layer is pseudo-coloured green. b, Higher magnification image of (upper) basal keratinocytes and the basement membrane (BM) and (lower) spinous layer keratinocytes. c, Higher magnification image of matrix-associated melanocytes (pink) with (lower) melanosomes at different stages (I, II, III, and IV); corresponds to Fig. 3f. Dashed box area in upper panel is magnified in lower panel. (a-c) TEM was performed on two day-140 skin organoids from separate experiments. d, Dark field illumination image of day-124 WA25 skin organoids, comparing pigmented vs. non-pigmented (albino) hairs development; represents pigmented and non-pigmented hairy-skin organoids from 9 independent experiments. e, Representative (*) dark field illumination and (**) endogenous GFP fluorescence images of day-125 DSP-GFP skin organoids with pigmented hair follicles. f, g, Overview of one DSP-GFP experiment containing 24 skin organoids. Note that each organoid displays pigmented hair follicles; however, the morphology of the epidermal cyst, as shown by DSP-GFP expression (green), varies between organoids. Closeup view of organoids highlighted with dashed boxes and asterisks are presented in (e). (e-g) Images show a set of organoids from one experiment and are representative of morphologies observed over the course of 9 independent experiments. h, Immunostaining for TUJ1 and ISL1 on day-140 WA25 organoid reveals the ganglion-like cluster of neurons. i, A subset of organoid neurons express NEFH and are associated with S100β+ satellite glial cells and Schwann cells. Dashed circles indicate axons of neurons. j, Immunostaining for PVALB on a day-125 WA25 organoid reveals the proprioceptors. PRPH+ sensory neurons have small somas, and their axons form a fascicle. (h-j) Immunostaining was repeated at least three times on 5–6 independent organoids. Scale bars: 1 mm (d-g), 50 μm (h, i), 35 μm (j), 25 μm (i; inserts) 10 μm (a), 5 μm (b, c; upper), 800 nm (c; lower). Corresponds with data in Fig. 3.
Extended Data Figure 8 |
Extended Data Figure 8 |. Chondral development in the skin organoid tail region.
a, b, Violin and tSNE plots showing normalized expression of chondral marker genes within cluster 7 of the day-48 WA25 skin organoid dataset (see Fig. 2 and Supplementary Data 4). The data represent cells pooled from six day-48 skin organoids from one experiment. c, Hematoxylin stained section of a day-140 skin organoid showing hyaline cartilage that has formed within skin organoid-associated mesenchymal tissue; 3 independent hematoxylin stainings were performed on 6 skin organoids from 3 different experiments. d, TEM image of two representative chondrocytes located within hyaline cartilage tissue shown in panel (c); TEM was performed once on two different skin organoids. e, f, Immunostaining of day-140 organoid samples for Aggrecan (ACAN) and Collagen 2A1 (COL2A1) highlights cartilage development; images represent one of 3 independent IHC staining on 6 skin organoids produced from 3 separate experiments. Scale bars: 100 μm (c-f). Corresponds with data in Fig. 2 and 3.
Extended Data Figure 9 |
Extended Data Figure 9 |. Xenografted WA25 skin organoid hair follicles have sebaceous glands comparable to second-trimester (18 weeks) foetal and adult facial hair.
a, Brightfield image of two day-115 (in vitro) WA25 skin organoid hair follicles with visible hair shafts and sebaceous glands; represents hair follicles produced in 9 independent experiments. b, LipidTOX staining of day-120 WA25 skin organoid hair follicles reveals lipid-rich cells, such as sebocytes and adipocytes (APs; outlined by dashed lines). (left) Immunostaining for KRT15 labels outer root sheath of hair follicle cells. (right) High magnification image of an adjacent cryosection of the specimen in the left panel. Dashed line highlights a horizontally-cross-sectioned hair shaft and a sebaceous gland. c, TEM image of a day-140 WA25 skin organoid sebaceous gland; TEM was performed once on 2 different skin organoids from separate experiments. Peripheral layer cells (PLCs) and a maturing sebocyte (MS) containing sebum vacuoles (SV) have been pseudo-coloured in yellow and green, respectively. d, d’, SCD1+ sebaceous glands in xenografted day-140 WA25 skin organoids. Xenografts were extracted and fixed in 4% PFA, >49 days after transplantation. Dashed boxes and asterisks indicate magnified regions presented in following image panels. Dashed lines distinguish between the grafted human skin organoid tissue and the tissues of host mouse (NU/J). Arrows indicate SCD1+ adipocytes. e, SCD1+ sebaceous glands in the NU/J mouse skin adjacent to xenografts. Note that the size of mouse sebaceous glands is smaller than those of human that the origin of sebaceous glands is distinguishable within the extracted xenograft samples. f, f’, SCD1+ sebaceous glands in 18-week human foetal forehead skin. g, g’, SCD1+ sebaceous glands and adipocytes in 18-week human foetal cheek skin. Note that the adipocytes are prominently abundant in foetal cheek tissue compared to forehead tissue (f vs. g). Dashed boxes and symbols highlight the magnified regions in following images. h-i, SCD1+ sebaceous glands (SG) in adult human facial skin. Epithelium is visualized by ECAD immunostaining. Dashed line outlines several lobes of sebaceous glands of a hair follicle. Immunostaining images represent one of 5 independent staining on 3–5 different samples per tissue type. Scale bars: 250 μm (a, f, g, h), 100 μm (b; left, d, d’, f’, g’, g’; **, h’, i), 50 μm (b; right, d’; *, **, separate cryosection (SC), e, f’; *, SC, g’; #, SC, ##, *), 5 μm (c). Corresponds with data in Fig. 4.
Extended Data Figure 10 |
Extended Data Figure 10 |. Xenografted WA25 skin organoid hair follicles have bulge regions comparable to second-trimester (18 weeks) foetal and adult facial hair.
a-d, Representative immunostaining images for hair follicle stem cell markers, LHX2, KRT15, and NFATC1, in the hair follicle bulge region in (a, b) 18-week human foetal skin from two facial locations (Forehead and Cheek), (c) adult facial skin, and (d) xenografted skin organoid tissue. Note that in both foetal and xenograft hair follicles, NFATC1 expression is predominantly localized to the cytoplasm in bulge cells, while NFATC1 expression in adult facial hair follicles is nuclear-localized in hair follicle bulge region, reminiscent of previous reports showing nuclear-localized NFATC1 in mouse bulge stem cells. Arrows indicate background (BG) staining noises. Dashed boxes indicate magnified bulge regions presented on a corner of each image panel (a, c, d). Dashed brackets indicate bulge region (b). Abbr: hair shaft (HS); dermal papilla (DP); sebaceous gland (SG). Representative immunostaining images are selected from 5 independent staining on 3–5 different samples per tissue type. Scale bars: 100 μm (a, c), 50 μm (b, d). Corresponds with data in Fig. 4.
Figure 1 |
Figure 1 |. Surface ectoderm and CNCC co-induction leads to hair-bearing skin generation.
a, b, Overview of (a) study objectives and (b) skin organoid (SkO) protocol. c, Brightfield images of WA25 aggregates on days 12 and 30 in optimized culture. d, Immunostaining for KRT5+KRT15+ basal and KRT15+ peridermal layers at day-55. e, f, Representative HF-induction images (e) in brightfield of days 65–85 WA25 SkOs and (f) max-intensity confocal image (endogenous DSP-GFP) of days 65–95 DSP-GFP SkO. Dashed-box: magnified-HF; dashed-line: HF; dashed-circles: developing hair germs; asterisks: dermal papilla. g, h, Violin plots showing (g) frequencies of HF-formation in WA25 (average 87.4%, min=68.8%, max=100%, n=212 organoids), DSP-GFP (average 87.2%, min=66.7%, max=100%, n=212 organoids), and WA01 (71%, n=130 organoids) cultures, and (h) average number of HFs formed in WA25 (average 64 HFs/organoid, min=9, max=285, n=80 organoids) and DSP-GFP (average 48 HFs/organoid, min=7, max=128, n=80 organoids) cultures between days 75–147. i-k, Immunostained day-75 WA25 SkO with hair placodes. Antibodies highlight epidermal (KRT5+KRT15+CD49f+) and periderm (KRT15+) layers, dermis (PDGFRα+P75+), and DC cells (SOX2+PDGFRα+P75+). Dashed-boxes: magnified-regions. l, Wholemount of day-85 WA25 SkO with head-tail structures. KRT5 highlights epidermis and HF outer root sheath. SOX2 marks DC, DP, Merkel cells and melanocytes. Dashed-box: area shown to the right. Abbr: frontonasal prominence (FNP); cranial neural crest cells (CNCCs); dermal papilla (DP); matrix (Mtx); periderm (PD); hair root (HR); dermal condensate (DC). Scale: 500 μm (c), 250 μm (l; left), 100 μm (e; first three panels, f; third-panel, i-k; upper-panels), 50 μm (d, f; second-panel, i-k; lower-panels, l; right), 25 μm (e; last-panel, f; first/last-panels). See Statistics and Reproducibility for plot and experimental information.
Figure 2 |
Figure 2 |. Single-cell RNA-sequencing reveals gene expression signatures of craniofacial skin development.
a, e, Uniform manifold approximation projections (UMAP) of day-6 and day-29 WA25 and DSP-GFP integrated datasets. Data represent (a) 23,239 cells and (e) 18,190 cells. The major cell cluster groupings of surface epithelia, epidermis, and mesenchyme and presumptive cell identities, based on a priori knowledge, are noted. b, f, Percentage distribution of all cell clusters (color-coded to match panels a and e) and large groups consisting of mesenchymal, epithelial, neuro-glial, and cycling cells. c, g, Overlay UMAP plots comparing cells from DSP-GFP and WA25 datasets. d, h, Key gene markers for cell subtype classification and determination of anterior-posterior patterning. Clusters with no discernable identity had either low mitochondrial or high long non-coding RNA gene expression and are labeled “Low Mito Cells” and “High LncRNA”, respectively. Abbr: pharyngeal arch (PA).
Figure 3 |
Figure 3 |. Skin organoid HF pigmentation, structure, and neural innervation.
a-c, Skin organoid (SkO) anatomy: (a) Schematic; typical SkO. (b, c), Darkfield-images; (b) day-140 WA25 SkOs; cartilage in organoid-tail and (c) 18-week human foetal skin. d-g, Melanocytes: (d) PMEL/Ki67 immunostaining; WA25 organoid-HFs and (e) PMEL+ melanocytes in DSP-GFP organoid-HFs and -epithelium. (f) Transmission electron microscopy (TEM); matrix-associated melanocytes (pink). (g) Violin plots compare HF-pigmentation frequency between WA25 (average=53.5%, min=25%, max=100%, n=137 organoids) and DSP-GFP (average=76.2%, min=56.3%, max=93.3%, n=91 organoids); Welch’s two-sided t-test, p=0.077. h-k, HF-layers: (h) Hematoxylin-staining; day-140 WA25 HFs. Dashed-box: region in (i) TEM; HF-layers. (j) Schematic; human HF-layers. (k) Immunostaining for markers in (j) on day-147 organoid-HFs; each layer from outermost ⍺SMA+ DS to innermost AE13+ Co. l-r, Neural network: (l) KRT17/TUJ1 wholemount; neurons in day-140 WA25 SkO. Magnified-area with asterisks: neurites targeting (*) HF-bulge and (**) neuron-soma. Arrowheads: HF-clusters. (m) Neurofilament-heavy chain (NEFH)-positive neurons with S100β+ satellite glial and Schwann cells. (n) Schematic; typical SkO-neurons. (o) Wholemount of day-115 WA25 SkO; ganglion with PRPH+NEFH and PRPHLOWNEFH+ neurons. (p) Wholemount for TUJ1/KRT17; (left) day-140 WA25 SkO and (right) 18-week human foetus-forehead skin; neurites innervate HF-upper-bulge. HF-SGs noted. (q, r) TUJ1/KRT20 wholemount on day-140 WA25 SkOs; TUJ1+ neurites innervate HF-upper-bulge above TUJ1+KRT20+ (yellow) Merkel cells. (r) High-magnification of innervation site. Yellow-asterisks: Merkel cells. Abbr: hair shaft (HS); dermal sheath (DS); glassy membrane (GM); outer root sheath (ORS); companion (Cp); inner root sheath (IRS); Henle’s (He); Huxley’s (Hu); IRS-cuticle (Ci); cuticle (Ch); cortex (Co); medulla (Me); sebaceous gland (SG). Scale: 250 μm (b; upper, l; left), 100 μm (b; lower, c, e, k; left), 50 μm (d, h; right, k; insert and right-panels, p), 25 μm (e; insert, h; left, l; right-panels, m, o, q, r), 10 μm (f, i). See Statistics and Reproducibility for statistics and experimental information.
Figure 4 |
Figure 4 |. Skin organoids undergo cystic-to-planar transition when xenografted.
a, Schematic of skin organoid (SkO) xenografting strategy. b, Darkfield image of day-140 WA25 SkO prior to grafting (pre-operative; pre-op). c, Quantification of HF-growth percentage throughout xenograft experiments. Data compiled from 27 xenografts performed over 3 separate experiments/surgeries (S1, S2, S3). d, A xenografted NU/J mouse at 38-days post-operative (PO) following the first experiment (S1); total 178-days-old SkO. Pigmented hair shafts are visible at both graft sites, highlighted by boxes. One graft site (right) shows 14 HFs. e, S2 xenograft containing out-grown pigmented-hairs at 49-days PO; total 189-days-old SkO. f, Immunostaining for Human nuclear antigen and DAPI in out-grown xenograft. Note mouse and human epidermis junction (right). Organoid-HFs have SGs. g, h, Comparison of epidermis layers between (g) SkO-xenograft and (h) adult facial skin by immunostaining for CD49f (basal), KRT10 (intermediate), and Loricrin (granular). Unspecific staining above Loricrin+ granular layer is cornified layer. Note Rete ridges in xenograft and adult skin. Arrowheads; vessels. i, j Comparison of (i) LipidTOX+ SGs and (j) LHX2+KRT15+ putative bulge stem cells at HF-bulge region in (left) foetal forehead and cheek, (middle) adult facial, and (right) xenograft. (i) LipidTOX also labeled adipocytes. Dashed-lines; SGs. (j) Dashed-boxes: HF-bulge. Abbr: operative (OP); forehead (FH); cheek (CH). Scale: 1 mm (d; right, e), 200 μm (b, f, g; left), 100 μm (i & j; Adult & Xenograft), 50 μm (g; right, h, i & j; Foetal). See Statistics and Reproducibility for experimental information.

Comment in

References

    1. Sun BK, Siprashvili Z & Khavari PA Advances in skin grafting and treatment of cutaneous wounds. Science 346, 941–945 (2014). - PubMed
    1. Lee J et al. Hair Follicle Development in Mouse Pluripotent Stem Cell-Derived Skin Organoids. Cell reports 22, 242–254 (2018). - PMC - PubMed
    1. Yang R et al. Generation of folliculogenic human epithelial stem cells from induced pluripotent stem cells. Nat Commun 5, 3071–3071 (2014). - PMC - PubMed
    1. Abaci H et al. Tissue engineering of human hair follicles using a biomimetic developmental approach. Nat Commun 9, 5301 (2018). - PMC - PubMed
    1. Gledhill K et al. Melanin transfer in human 3D skin equivalents generated exclusively from induced pluripotent stem cells. Plos One 10, e0136713–e0136713 (2015). - PMC - PubMed

Publication types

MeSH terms