. 2020 Jul;583(7815):259-264.
doi: 10.1038/s41586-020-2347-0. Epub 2020 Jun 3.

Insights into variation in meiosis from 31,228 human sperm genomes

Affiliations

Insights into variation in meiosis from 31,228 human sperm genomes

Avery Davis Bell et al. Nature. 2020 Jul.

Abstract

Meiosis, although essential for reproduction, is also variable and error-prone: rates of chromosome crossover vary among gametes, between the sexes, and among humans of the same sex, and chromosome missegregation leads to abnormal chromosome numbers (aneuploidy)1-8. To study diverse meiotic outcomes and how they covary across chromosomes, gametes and humans, we developed Sperm-seq, a way of simultaneously analysing the genomes of thousands of individual sperm. Here we analyse the genomes of 31,228 human gametes from 20 sperm donors, identifying 813,122 crossovers and 787 aneuploid chromosomes. Sperm donors had aneuploidy rates ranging from 0.01 to 0.05 aneuploidies per gamete; crossovers partially protected chromosomes from nondisjunction at the meiosis I cell division. Some chromosomes and donors underwent more-frequent nondisjunction during meiosis I, and others showed more meiosis II segregation failures. Sperm genomes also manifested many genomic anomalies that could not be explained by simple nondisjunction. Diverse recombination phenotypes-from crossover rates to crossover location and separation, a measure of crossover interference-covaried strongly across individuals and cells. Our results can be incorporated with earlier observations into a unified model in which a core mechanism, the variable physical compaction of meiotic chromosomes, generates interindividual and cell-to-cell variation in diverse meiotic phenotypes.


Conflict of interest statement

Competing Interests

A.D.B. and S.A.M. are inventors on a United States Provisional Patent application (PCT/US2019/029427; applicant: President and Fellows of Harvard College) currently in PCT stage relating to droplet-based genomic DNA capture, amplification and sequencing that is capable of obtaining high-throughput single-cell sequence from individual mammalian cells, including sperm cells. A.D.B. is an occasional consultant for Ohana Biosciences since October 2019. The other authors declare no competing interests.

Figures

Extended Data Fig. 1.
Extended Data Fig. 1.. Characterization of egg-mimic sperm preparation and optimization of bead-based single-sperm sequencing.
a-c, Two-channel fluorescence plots showing the results of droplet digital PCR (ddPCR) with input template noted in each title, demonstrating that two loci (from different chromosomes) are detectable in the same droplet far more often when sperm DNA florets (rather than purified DNA) are used as input. Each point represents one droplet. Gray points in the bottom left quadrant represent droplets in which neither template molecule was detected; blue points in the top left quadrant represent droplets in which the assay detected a template molecule for the locus on chromosome 7; green droplets in the bottom right quadrant represent droplets in which the assay detected a template molecule for the locus on chromosome 10; and brown point in the top right quadrant represent droplets in which both loci were detected. With a high concentration of purified DNA as input (a), comparatively fewer droplets contain both loci than when untreated (b) or treated (c) sperm were used as input. Sperm “florets” treated with the egg-mimicking decondensation protocol had a much higher fraction of droplets containing both loci than purified DNA (compare a and c, right, high-input treated sperm) and had more-sensitive ascertainment and cleaner results (quadrant separation) than untreated sperm (compare b and c, left, low-input sperm and treated sperm). The pink lines in (b) delineate the boundaries between droplets categorized as negative or positive for each assay. d, Optimization of sperm preparation: Characterization of the effect of different lengths of 37°C incubation of sperm cells treated with egg-mimicking decondensation reagents on how often the loci on chromosomes 7 and 10 were detected in the same ddPCR droplet. Y axis, the percentage of molecules calculated to be linked to each other (i.e. physically linked in input) for assays targeting chromosomes 7 and 10. Extracted DNA (a negative control) gives the expected result of random assortment of the two template molecules into droplets (first bar). The 45-minute heat treatment was used for all subsequent experiments in this study. e and f, Distribution of sequence reads across cell barcodes from droplet-based single-sperm sequencing. Each panel shows the cumulative fraction (y-axis) of all reads from a sequencing run coming from each read-number-ranked cell barcode; a sharp inflection point delineates the barcodes with many reads from those with few reads. Points to the left of the inflection point are the cell barcodes that associated with many reads (i.e., beads that co-encapsulated with cells); the height of the inflection point reflects the proportion of the sequence reads that come from these barcodes. Only reads that mapped to the human genome (hg38) and were not PCR duplicates are included. e, Data from an initial adaptation of 10X Genomics’ GemCode linked reads system where a small proportion of the reads come from cell barcodes associated with putative cells. f, Data from the final, implemented adaptation of 10X Genomics’ GemCode linked reads system for the same number of input sperm nuclei as in e. Note that this x-axis includes five times fewer barcodes than in (e).
Extended Data Fig. 2.
Extended Data Fig. 2.. Evaluation of chromosomal phasing and identification of cell doublets.
a, Phasing strategy. Green and purple denote the chromosomal phase of each allele (unknown before analysis). Each sperm cell carries one parental haplotype (green or purple) except where a recombination event separates consecutively observed SNPs (red “X” in bottom sperm). Because alleles from the same haplotype will tend to be observed in the same sperm cells, the haplotype arrangement of the alleles can be assembled at whole-chromosome scale. b, Evaluation of our phasing method using 1,000 simulated single-sperm genomes (generated from two a priori known parental haplotypes and sampled at various levels of coverage). Since cell doublets (which combine two haploid genomes and potentially two haplotypes at any region) can in principle undermine phasing inference, we included cell doublets in the simulation (in proportions shown on the X axis, which bracket the observed doublet rates). Each point shows the proportion of SNPs phased concordantly with the correct (a priori known) haplotypes (Y axis) for one simulation (five simulations were performed per proportion of cell doublets-percentage of observed sites condition pair). c, Relationship of phasing capability to number of cells analyzed. Data are as in (b), but for different numbers of simulated cells. All simulations had an among-cell mean of 1% of heterozygous sites observed. d, A cell doublet: when two cells (here, sperm DNA florets) are co-encapsulated in the same droplet, their genomic sequences will be tagged with the same barcode; such events must be recognized computationally and excluded from downstream analyses. e, Four example chromosomes from a cell barcode associated with two sperm cells (a cell doublet). Black lines: haplotypes; blue circles: observations of alleles, shown on the haplotype from which they derive. Both parental haplotypes are present across regions of chromosomes where the cells inherited different haplotypes. f, Computational recognition of cell doublets in Sperm-seq data (from an individual sperm donor, NC11). The proportion of consecutively observed SNP alleles derived from different parental haplotypes is used to identify cell doublets; this proportion is generally small (arising from sparse crossovers, PCR/sequencing errors, and/or ambient DNA) but is much higher when the analyzed sequence comes from a mixture of two distinct haploid genomes. We use 21 of the 22 autosomes to calculate this proportion, excluding the autosome with the highest such proportion given the possibility that a chromosome is aneuploid. The dashed gray line marks the inflection point beyond which sperm genomes are flagged as potential doublets and excluded from downstream analysis. Red points indicate barcodes with coverage of both the X and Y chromosome (potentially X+Y cell doublets or XY aneuploid cells); black points indicate barcodes with one sex chromosome detected (X or Y). The red (XY) cells below the doublet threshold are XY aneuploid but appear to have just one copy of each autosome.
Extended Data Fig. 3.
Extended Data Fig. 3.. Identification and use of “bead doublets.”
a, SNP alleles were inferred genome-wide (for each sperm genome) by imputation from (i) the subset of alleles detected in each cell and (ii) Sperm-seq-inferred parental haplotypes. For each pair of sperm genomes (cell barcodes), the proportion of all SNPs at which they shared the same imputed allele was estimated. A small but surprising number of such pairwise comparisons (19 of 984,906 from the donor shown, NC14) indicate essentially identical genomes (ascertained through different SNPs). b, We hypothesize that this arises from a heretofore undescribed scenario we call “bead doublets”, in which two barcoded beads have co-encapsulated with the same gamete and whose barcodes therefore tagged the same haploid genome. c, Random pairs of cell barcodes (here 100 pairs selected from donor NC10) tend to interrogate few of the same SNPs (left), and tend to detect the same parental haplotype on average at the expected 50% of the genome (right). d, “Bead doublet” barcode pairs (here 20 pairs from donor NC10, who had the median number of bead doublets, left) also interrogate few of the same SNPs, yet detect identical haplotypes throughout the genome (right). Results were consistent across donors. e, Use of “bead doublets” to characterize the concordance of crossover inferences between distinct samplings of the same haploid genome by different barcodes. The bead doublets (barcode pairs) were compared to 100 random barcode pairs per donor. Crossover inferences were classified as “concordant” (overlapping, detected in both barcodes), as “one SNP apart” (separated by just one SNP, detected in both barcodes), as “near end of coverage” (within 15 heterozygous SNPs of the end of SNP coverage at a telomere, where power to infer crossovers is partial), or as discordant. Error bars (with small magnitude) show binomial 95% confidence intervals for the number of crossovers per category divided by number of crossovers total in both barcodes (32,714 crossovers total in 1,201 bead doublet pairs; 67,862 crossovers total in 2,000 random barcode pairs; some barcodes are in multiple bead doublet or random barcode pairs).
Extended Data Fig. 4.
Extended Data Fig. 4.. Numbers and locations of crossovers called from down-sampled data (equal number of SNPs in each cell, randomly chosen).
To eliminate any potential effect of unequal sequence coverage across donors and cells, down-sampling was used to create data sets with equal coverage (numbers) of heterozygous SNP observations in each cell. Crossovers were called from these random equally sized sets of SNPs from all cells. a and b, Crossover number per cell globally (a) and per chromosome (b) (785,476 total autosomal crossovers called from down-sampled SNPs included, 30,778 cells included, aneuploid chromosomes excluded). c, Density plots of crossover location with crossover midpoints plotted and area scaled to be equal to per-chromosome crossover rate. Gray rectangles mark centromeric regions; coordinates are in hg38. d, Similar numbers of crossovers were called from full data and equally down-sampled SNP data: we performed correlation tests across cells for each donor and chromosome to compare the number of crossovers called from all data to the number of crossovers called from equal numbers of randomly down-sampled SNPs. The histogram shows Pearson’s r values for all 460 (20 donors x 23 chromosomes [total number plus number for 22 autosomes]) tests (n per test = 974–2,274 cells per donor as in Extended Data Table 1, all chromosome comparisons Pearson’s r > 0.83, all two-sided p < 10−300). E, Crossovers called from equally down-sampled SNP data were in similar locations to those called from all data: we performed correlation tests comparing crossover rate in 500 kb bins (cM/500 kb) from all data vs. equally down-sampled SNP data for each donor and chromosome. The histogram shows Pearson’s r values for all 460 (20 donors x 23 chromosomes [genome-wide rate plus rate for 22 autosomes]) tests (n per test = number of 500 kb bins per chromosome [genome-wide: 5,739, chromosomes 1 through 22: 497, 484, 396, 380, 363, 341, 318, 290, 276, 267, 270, 266, 228, 214, 203, 180, 166, 160, 117, 128, 93, 101], all chromosome comparisons Pearson’s r > 0.87, all two-sided p < 10−300 ).
Extended Data Fig. 5.
Extended Data Fig. 5.. Inter-individual and inter-cell recombination rate from single-sperm sequencing.
a, Density plot showing per-cell number of autosomal crossovers for all 31,228 cells (813,122 total autosomal crossovers) from 20 sperm donors (per-donor cell and crossover numbers as in Extended Data Table 1; aneuploid chromosomes were excluded from crossover analysis). Colors represent a donor’s mean crossover rate (crossovers per cell) from low (blue) to high (red). This same mean recombination rate-derived color scheme is used for donors in all figures. Recombination rate differs among donors (n = 20, Kruskal–Wallis chi-squared = 3,665, df =19, p < 10−300). b, Per-chromosome crossover number in each of the 20 sperm donors (data as in (a) but shown for individual chromosomes). c, Per-chromosome genetic map lengths for: (i) each of the 20 sperm donors, as inferred from Sperm-seq data (colors from blue to red reflect donors’ individual crossover rates as described above); (ii) a male average, as estimated from pedigrees by deCODE (yellow triangles); (iii) a population average (including female meioses, which have more crossovers), as estimated from HapMap data (yellow circles). The deCODE genetic maps stop 2.5 Mb from the ends of SNP coverage. d, Physical vs. genetic distances (for individualized sperm donor genetic maps and deCODE’s paternal genetic map) plotted at 500 kb intervals (hg38). Gray boxes denote centromeric regions (or centromeres and acrocentric arms). Sperm-seq maps are broadly concordant with deCODE maps (correlation test results in Supplementary Notes) except at subtelomeric regions not included in deCODE’s map.
Extended Data Fig. 6.
Extended Data Fig. 6.. Distributions of crossover locations along chromosomes (in “crossover zones”).
a, Each donor’s crossover locations are plotted as a colored line; color indicates the donor’s overall crossover rate (blue: low, red: high); gray boxes show the locations of centromeres (or, for acrocentric chromosomes, centromeres and p arms). The midpoint between the SNPs bounding each inferred crossover was used as the position for each crossover in all analyses. To combine data across chromosomes, crossover locations (density plot) are shown on “meta-chromosomes” in which crossover locations are normalized to the length of the chromosome or arm on which they occurred. For acrocentric chromosomes, only the q arm was considered; for non-acrocentric chromosomes, the p and q arms were afforded space based on the proportion of the non-acrocentric genome (in bp) they comprise, with the centromere placed at the summed p arms’ proportion of bp of these chromosomes. Crossover locations were first converted to the proportion of the arm at which they fall, then these positions normalized to the genome-wide p or q arm proportion. b, Identification of chromosomal zones of recombination use (“crossover zones”) from all donors’ crossovers for 22 autosomes. Density plots of crossover location for all sperm donors’ total 813,122 crossovers (aneuploid chromosomes excluded; crossover location is the midpoint between SNPs bounding crossovers) along autosomes (hg38) are shown. Crossover zones (bounded by local minima of crossover density) are shown by alternating shades of gray. Diagonally-hatched rectangles indicate centromeres (or centromeres and acrocentric arms).
Extended Data Fig. 7.
Extended Data Fig. 7.. Crossover placement in end zones, and crossover separation, vary in ways that correlate with crossover rate – among sperm donors and among individual gametes.
Analyses are shown by donor (a-h, n = 20 sperm donors) or by individual gamete (i-j, n = 31,228 gametes). In a-h, the left panels show the phenotype distributions for individual donors, and the right panels show the relationship to the donors’ crossover rates. To control for the effect of the number of crossovers, the analyses in panels c, d, and g-j use “two-crossover chromosomes” – chromosomes on which exactly two crossovers occurred. For scatter plots (a-h, right), all x axes show mean crossover rate and all error bars are 95% confidence intervals (y axes are described per panel). a and b, The proportion of crossovers falling in the most distal chromosome crossover zones (a) and crossover separation (b) – a readout of crossover interference, the distance between consecutive crossovers (Mb) – vary among 20 sperm donors (left panels; proportion of crossovers in end per cell distributions among-donor Kruskal–Wallis chi-squared = 2,334, df = 19, p < 10−300; all distances between consecutive crossovers among-donor Kruskal–Wallis chi-squared = 3,309, df = 19, p < 10−300). Right panels show both properties (y axes, total proportion of crossovers in distal zones and median crossover separation, respectively) vs. donor’s crossover rate (Correlation results for 20 sperm donors: proportion of all crossovers across cells in distal zones Pearson’s r = −0.95, two-sided p = 2 × 10⁻¹⁰; Pearson’s r = −0.96, two-sided p = 1 × 10⁻¹¹). c, An alternative method for the proportion of crossovers in the distal regions of chromosomes: proportion of crossovers in the distal 50% of chromosome arms varies across donors (left, among-donor Kruskal–Wallis chi-squared = 2,209, df = 19, p < 10−300) and negatively correlates with recombination rate (right, Pearson’s r = −0.92, two-sided p = 2 × 10⁻⁸; y axis shows actual proportion of crossovers in distal 50%). d, As in (c), but with proportion of crossovers from two-crossover chromosomes occurring in the distal 50% of chromosome arms. Left, among-donor Kruskal–Wallis chi-squared = 1,058, df = 19, p = 2 × 10−212; right, correlation with recombination rate Pearson’s r = −0.93, two-sided p = 4 × 10⁻⁹. e, as in (b) but for consecutive crossovers on the q arm of the chromosome. Left, among-donor Kruskal–Wallis chi-squared = 346, df = 19, p = 7 × 10−62; right, correlation with recombination rate Pearson’s r = −0.90, two-sided p = 5 × 10⁻⁸. f, as in (b) but for consecutive crossovers on opposite chromosome arms (i.e. that span the centromere). Left, among-donor Kruskal–Wallis chi-squared = 1,554, df = 19, p = 1 < 10−300; right, correlation with recombination rate Pearson’s r = −0.96, two-sided p = 3 × 10-11. g, as in (e) but for distances between consecutive crossovers on two-crossover chromosomes. Left, among-donor Kruskal–Wallis chi-squared = 181, df = 19, p = 2 × 10⁻²⁸; right, correlation with recombination rate Pearson’s r = −0.88, two-sided p = 3 × 10⁻⁷. h, as in (f) but for distances between consecutive crossovers on two-crossover chromosomes. Left, among-donor Kruskal–Wallis chi-squared = 930, df = 19, p = 5 × 10−185; right, correlation with recombination rate Pearson’s r = −0.92, two-sided p = 1 × 10⁻⁸. i, j, Boxplots show medians and interquartile ranges with whiskers extending to 1.5 times the interquartile range from the box. Each point is a cell. i, Within-donor percentile of proportion of crossovers from two-crossover chromosomes falling in distal zones plotted vs. crossover rate decile. Groups are deciles of crossover rate normalized by converting each cell’s crossover count to a percentile within-donor (All cells from all donors shown together, n cells in deciles = 3,152, 3,122, 3,276, 3,067, 3,080, 3,073, 3,135, 3,132, 3,090, 3,101, respectively [31,228 total]). Because the initial data is proportions with small denominators, an integer effect is evident as pileups at certain values. j, Crossover interference from two-crossover chromosomes (median consecutive crossover separation per cell shown). Each point represents the median of all percentile-expressed distances between crossovers from all two-crossover chromosomes in one cell (percentile taken within-chromosome), groupings and ns as in (i).
Extended Data Fig. 8.
Extended Data Fig. 8.. Crossover interference in individual sperm donors and on chromosomes.
a, Solid lines show density plots (scaled by donor’s crossover rate) of the observed distance (separation) between consecutive crossovers as measured in the proportion of the chromosome separating them (left) and in genomic (Mb) distance (right), one line per donor (n = 20). Dashed lines show the distance between consecutive crossovers when crossover locations are permuted randomly across cells to remove the effect of crossover interference. b, The median of observed distances between consecutive crossovers for one donor (NC18, 10th lowest recombination rate of 20 donors; blue dashed line) is shown with a histogram of the medians of n = 10,000 among-cell crossover permutations (both permutation one-sided ps < 0.0001). Units, proportion of the chromosome (left) and genomic (Mb) distance (right). c, Crossover separation on example chromosomes; plots and ns are as in (b). (Permutation one-sided p < 0.0001 for all chromosomes in all sperm donors except occasionally chromosome 21, where especially few double crossovers occur). d, Median distances between donor NC18’s consecutive crossovers for each autosome for all inter-crossover distances (top) and inter-crossover distances only from chromosomes with two crossovers (bottom). Units are proportion of the chromosome (left) and genomic (Mb) distance (right). e, Schematic: analyzing crossover interference in individualized genetic distance (one 20 cM window shown) using a donor’s own recombination map. f, When parameterized using each donor’s own genetic map, sperm donors’ crossover interference profiles across multiple genetic distance windows (as shown in e) do not differ (n = 20 sperm donors, Kruskal–Wallis chi-squared = 0.22, df = 19, p = 1 using 20 estimates [cM distances] for each of 20 donors). Error bars, binomial 95% confidence intervals on proportion of cells with a second crossover in the window given. This suggests that inter-individual variation in crossover interference, while substantial when measured in base pairs, is negligible when measured in donor-specific genetic distance, pointing to a shared influence upon crossover interference and crossover rate.
Extended Data Fig. 9.
Extended Data Fig. 9.. Relationships of aneuploidy frequency to chromosome size and recombination.
a. The across-donor per-cell frequency of chromosome losses (left) and gains (center), plotted against the length of the chromosome (hg38; for losses across n = 22 chromosomes, Pearson’s r = −0.29, two-sided p = 0.19 and for gains across n = 22 chromosomes, Pearson’s r = −0.23, two-sided p = 0.30). Right, the per-chromosome rate of losses exceeding gains (number of losses minus number of gains divided by number of cells) is plotted against the length of the chromosomes (across n = 22 chromosomes, Pearson’s r = −0.29, two-sided p = 0.19). Red labels, acrocentric chromosomes. Error bars, 95% binomial confidence intervals on per-cell frequency (number of events / number of cells, all 31,228 cells included). b-d, Relationship between aneuploidy frequency and recombination. Only autosomal whole-chromosome aneuploidies are included. b, Left, Total number of crossovers on MI nondisjoined chromosomes (blue line; chromosomes analyzed, called as transitions between the presence of one haplotype and both haplotypes on the gained chromosome) compared to n = 10,000 donor- and chromosome-matched sets (35 × 2 chromosomes per set) of properly segregated chromosomes (gray histogram; permutation). (54 total crossovers on MI gains vs. 84.2 mean total crossovers on sets of matched chromosomes, one-sided permutation p < 0.0001, for the hypothesis that gained chromosomes have fewer crossovers). Right, as left but for gains occurring during MII (71 MII-derived gained chromosomes of one whole copy from all individuals with fewer than 5 crossovers called on gained chromosome). (One-sided permutation p = 0.98 for MII from n = 10,000 permutations, for the hypothesis that gained chromosomes have fewer crossovers; sister chromatids nondisjoined in MII capture all crossovers whereas matched chromosomes do not: matched simulations and homologs nondisjoined in MI capture only a random half of crossovers occurring on that chromosome in the parent spermatocyte). c, Crossovers per non-aneuploid megabase from each cell from each donor, split by aneuploidy status (n cells = 498, 50, 92, 30,609, left-to-right; “euploid” excludes cells with any autosomal whole- or partial-chromosomal loss or gain and “gains” includes gains of one or more than one chromosome copy; Mann–Whitney test W = 7,264,117, 722,191, 1,370,376; two-sided p = 0.07, 0.49, 0.66 for all autosomal aneuploidies, meiosis I (MI) gains, and meiosis II (MII) gains, respectively, all compared against euploid). Each cell is one point; boxplots show medians and interquartile ranges with whiskers extending to 1.5 times the interquartile range from the box. d, Per-cell crossover rates vs. per-cell aneuploidy (loss and gain) rates, n = 20 donors (colored by crossover rate). p values shown in subtitles are for two-sided Pearson’s correlation tests. Error bars are 95% confidence intervals on mean crossover rate (x axis) and on observed aneuploidy frequency (y axis).
Extended Data Fig. 10.
Extended Data Fig. 10.. Additional examples of non-canonical aneuploidy events detected with Sperm-seq, including those shown in Fig. 3f.
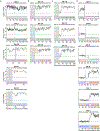
Copy number, SNPs, haplotypes, and centromeres are plotted as in Fig. 3a. Donor and cell identity are noted in the panel subtitles. Coordinates are in hg38. Chromosomes 2, 20, 21 (a) and 15 (b) are sometimes present in 3 copies in an otherwise haploid sperm cell. c, A distinct, recurring triplication of much of chromosome 15, from ~33 Mb onwards but not including the proximal part of the q arm, also recurs in cells from 3 donors. d, Chromosome arm-level losses (top) and gains (including in more than one copy, bottom three panels, and a compound gain of the p arm and loss of the q arm, top panel).
Extended Data Fig. 11.
Extended Data Fig. 11.. Single-cell and person-to-person variation in diverse meiotic phenotypes may be governed by variation in the physical compaction of chromosomes during meiosis.
Previous work shows that the physical length of the same chromosome varies among spermatocytes at the pachytene stage of meiosis, likely by differential looping of DNA along the meiotic chromosome axis (e.g. left column shows smaller loops, resulting in more loops total and in greater total axis length compared to the right column with larger loops),–. This physical chromosome length is correlated across chromosomes among cells from the same individual, and correlates with crossover number,,,,,. This length – measured as the length of the chromosome axis or of the synaptonemal complex (the connector of homologous chromosomes) – can vary two or more-fold among a human’s spermatocytes. We propose that the same process differs on average across individuals and may substantially explain inter-individual variation in recombination rate. On average, individual 1 (left) would have meiotic chromosomes that are physically longer (less compacted) in an average cell than individual 2 (right); one example chromosome is shown in the figure. After the first crossover on a chromosome (likely in a distal region of a chromosome, where synapsis typically begins in male human meiosis before spreading across the whole chromosome), crossover interference prevents nearby double-strand breaks (DSBs) from becoming crossovers; DSBs far away can become crossovers (which themselves also cause interference). More DSBs are likely created on physically longer chromosomes, and crossover interference occurs among non-crossover as well as crossover DSBs. Crossover interference occurs over relatively fixed physical (micron) distances–,; these distances encompass different genomic (Mb) lengths of DNA in different cells or on average in different people due to variable compaction. Thus, crossover interference tends to lead to different total number of crossovers as a function of degree of compaction, resulting in the observed negative correlation (Fig. 2c,e) of crossover rate with crossover spacing (as measured in base pairs). Given that the first crossover likely occurs in a distal region of the chromosome, this model can also explain the negative correlation (Fig. 2b,d) of crossover rate with the proportion of crossovers in chromosome ends. Note: this figure shows the total number of crossovers, crossover interference extent, and crossover locations for both sister chromatids of each homolog combined; in reality, these crossovers are distributed among the sister chromatids, making these relationships harder to detect in daughter sperm cells and requiring large numbers of observations to make relationships among these phenotypes clear.
Fig. 1.
Fig. 1.. “Sperm-seq” overview.
Schematic of our droplet-based single-sperm sequencing method.
Fig 2.
Fig 2.. Variation in crossover positioning and crossover separation (interference).
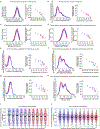
Color indicates crossover rate of donor or cell (blue: low, red: high). a, Crossover location density plots for each donor (n = 20). Dashed gray vertical lines: crossover zone boundaries. b-e, Crossover positioning and separation (interference) on chromosomes with two crossovers. b-c, Inter-individual variation among n = 20 sperm donors. Error bars: 95% confidence intervals. b, Left, per-cell proportion of crossovers in the most distal crossover zones (Kruskal–Wallis chi-squared = 1,034, df = 19, p = 2 × 10−207). Right, mean crossover rate (x axis) vs. the proportion of all crossovers (on two-crossover chromosomes) occurring in distal zones (y axis, total proportion) (Pearson’s r = −0.95, two-sided p = 8 × 10⁻¹¹). c, Left, density plot of separation between consecutive crossovers (Kruskal–Wallis chi-squared = 1,792, df = 19, p < 10−300). Right, mean crossover rate (x axis) vs. median crossover separation (y axis) on two-crossover chromosomes (Pearson’s r = −0.95, two-sided p = 7 × 10⁻¹¹). d-e, Among-cell covariation of crossover rate with distal zone use (d) or crossover interference (e). Phenotypes are analyzed as percentiles relative to sperm from the same donor. Boxplots: midpoints, medians; boxes, 25th and 75th percentiles; whiskers, minima and maxima. d, Single-cell distal-zone use (the proportion of crossovers on two-crossover chromosomes that are in the most distal zones) vs. crossover rate (n cells per decile = 3,152, 3,080, 3,101 for first, fifth, and tenth deciles, respectively; Mann–Whitney W = 5,271,934.5, two-sided p = 2 × 10⁻⁹ between first and tenth deciles.) e, Single-cell crossover-separation (the median of all fractions of a chromosome separating consecutive two-crossover chromosome crossovers in each cell) vs. crossover rate (Mann–Whitney W = 148,548,161, two-sided p = 3 × 10−53 between first [n = 11,658] and tenth [n = 23,154] deciles; all inter-crossover separations used in test).
Fig. 3.
Fig. 3.. Aneuploidy in sperm from 20 sperm donors.
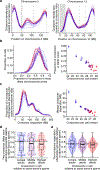
a, Example chromosomal ploidy analyses. Thick dark gray line: DNA copy number measurement (normalized sequence coverage in 1 Mb bins); blue (haplotype 1) and yellow (haplotype 2) vertical lines: observed heterozygous SNP alleles, plotted with 90% transparency; gray vertical boxes: centromeres (hg38). b-e, Frequencies (number of events divided by number of cells) of various aneuploidy categories. n = 23 chromosomes (b, d) and n = 20 donors (c, e). Error bars are 95% binomial confidence intervals. b, Frequencies of whole-chromosome losses (x axis) vs. gains (y axis) for each chromosome (excluding XY Pearson’s r = 0.88, two-sided p = 7 × 10⁻⁸; including XY [inset] Pearson’s r = 0.99, two-sided p < 10−300). c, Per-sperm-donor aneuploidy rates (axes as in b) (excluding XY [not shown] Pearson’s r = 0.51, two-sided p = 0.02; including XY Pearson’s r = 0.62, two-sided p = 0.003). d, Frequencies of whole-chromosome gains occurring during MI (x axis) and MII (y axis) for each chromosome (excluding XY Pearson’s r = 0.32, two-sided p = 0.15; including XY [inset] Pearson’s r = 0.85, two-sided p = 3 × 10⁻⁷). e, Frequencies of whole-chromosome gains occurring during MI (x axis) and MII (y axis) for each donor (axes as in d) (excluding XY [not shown] Pearson’s r = 0.06, two-sided p = 0.80; including XY Pearson’s r = 0.17, two-sided p = 0.47). f, Example genomic anomalies detected in sperm cells, plotted as in (a).

Comment in

References

    1. Broman KW & Weber JL Characterization of human crossover interference. American journal of human genetics 66, 1911–1926, doi:10.1086/302923 (2000). - DOI - PMC - PubMed
    1. Coop G, Wen X, Ober C, Pritchard JK & Przeworski M. High-resolution mapping of crossovers reveals extensive variation in fine-scale recombination patterns among humans. Science 319, 1395–1398, doi:10.1126/science.1151851 (2008). - DOI - PubMed
    1. Halldorsson BV et al. Characterizing mutagenic effects of recombination through a sequence-level genetic map. Science 363, doi:10.1126/science.aau1043 (2019). - DOI - PubMed
    1. Kong A et al. A high-resolution recombination map of the human genome. Nature genetics 31, 241–247, doi:10.1038/ng917 (2002). - DOI - PubMed
    1. Kong A et al. Common and low-frequency variants associated with genome-wide recombination rate. Nature genetics 46, 11–16, doi:10.1038/ng.2833 (2014). - DOI - PubMed

Publication types