. 2020 Jun;582(7810):109-114.
doi: 10.1038/s41586-020-2227-7. Epub 2020 Apr 22.

Mouse models of neutropenia reveal progenitor-stage-specific defects

Affiliations

Mouse models of neutropenia reveal progenitor-stage-specific defects

David E Muench et al. Nature. 2020 Jun.

Abstract

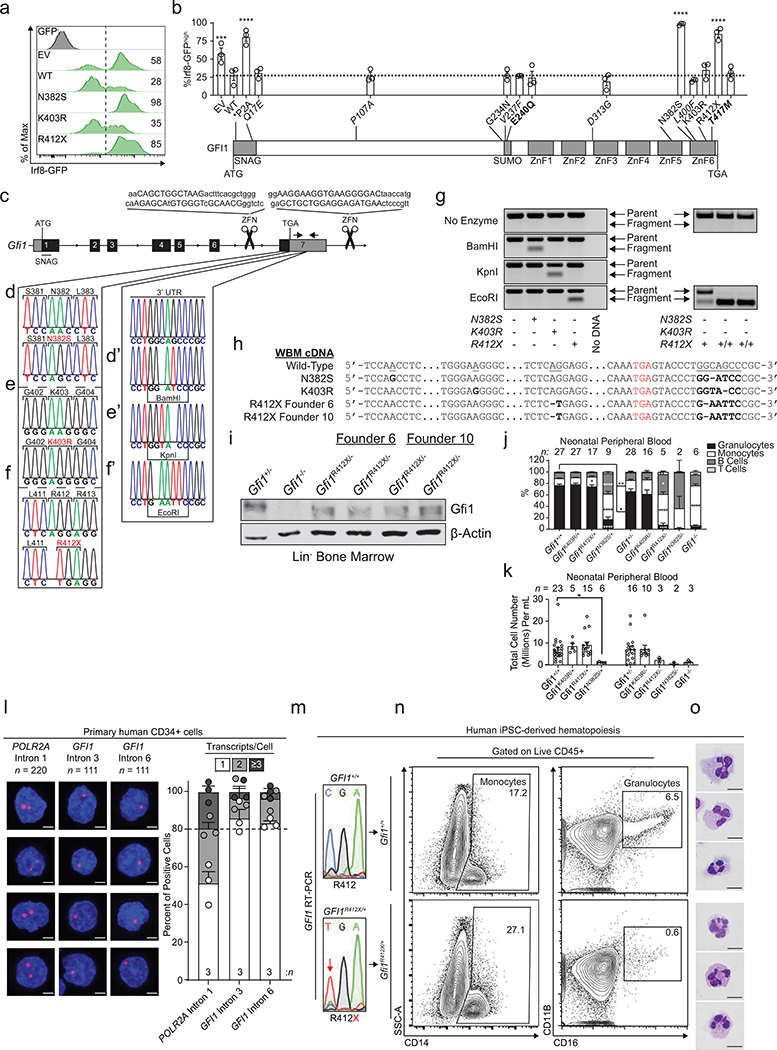
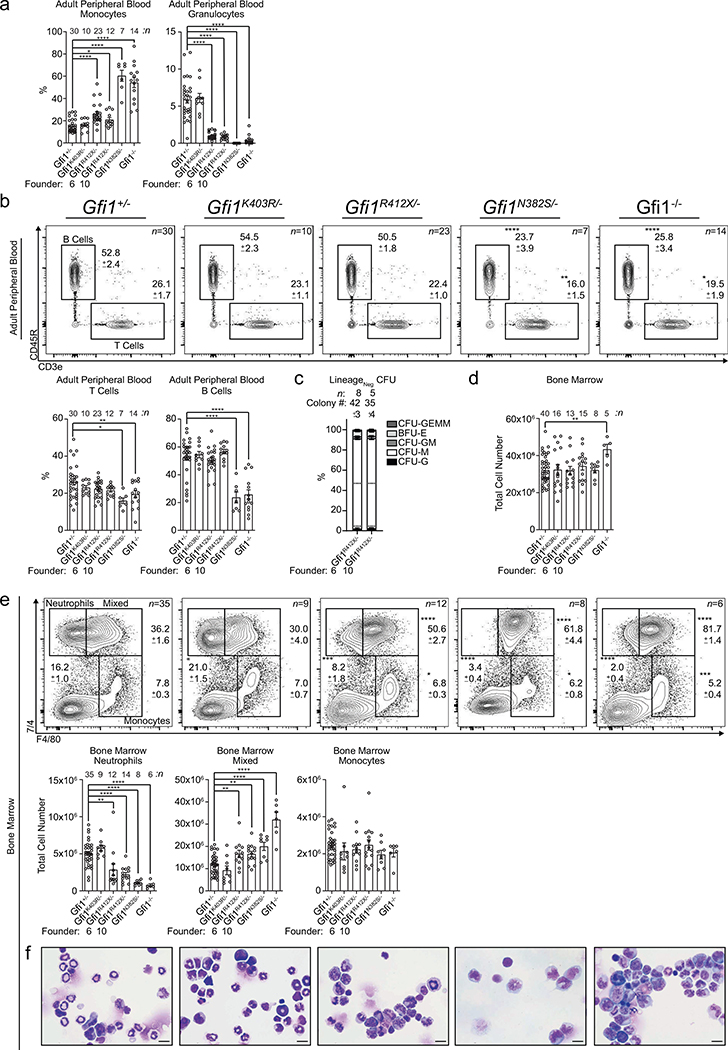
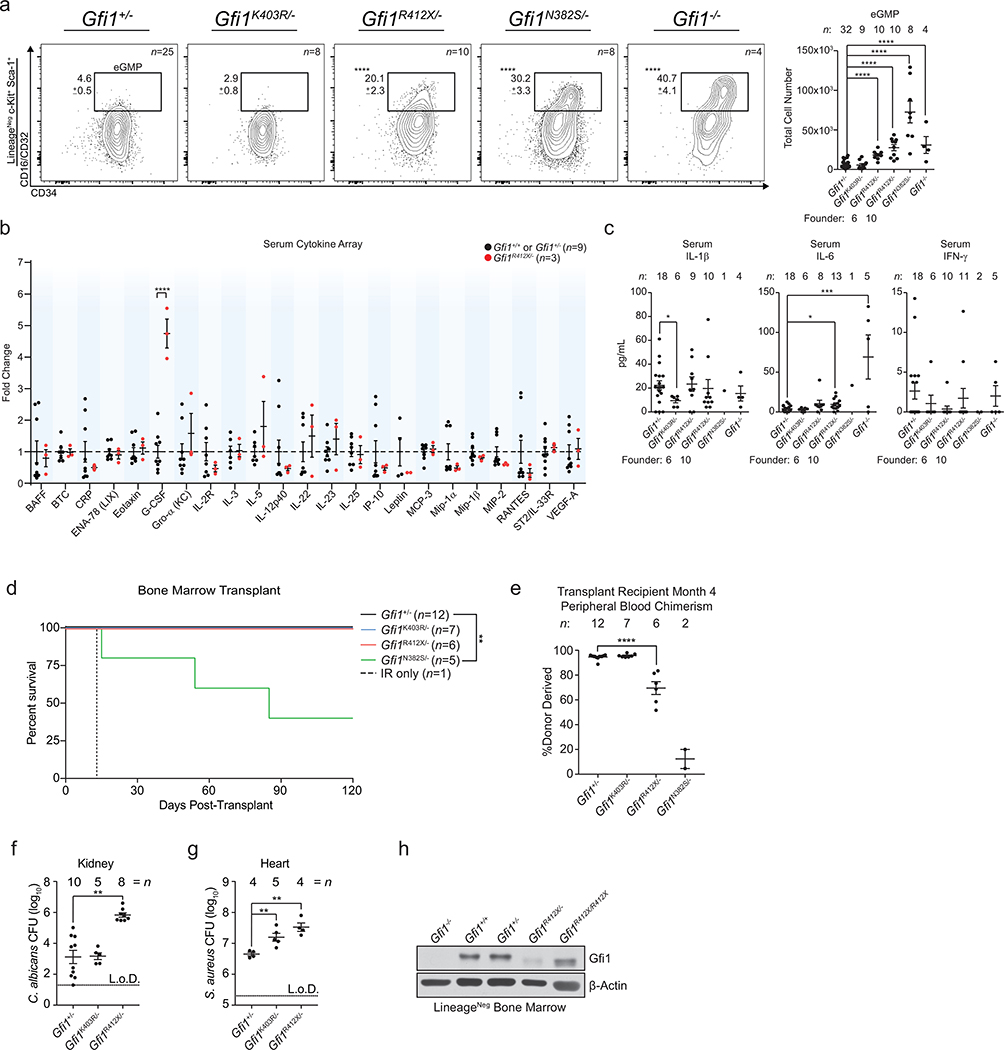
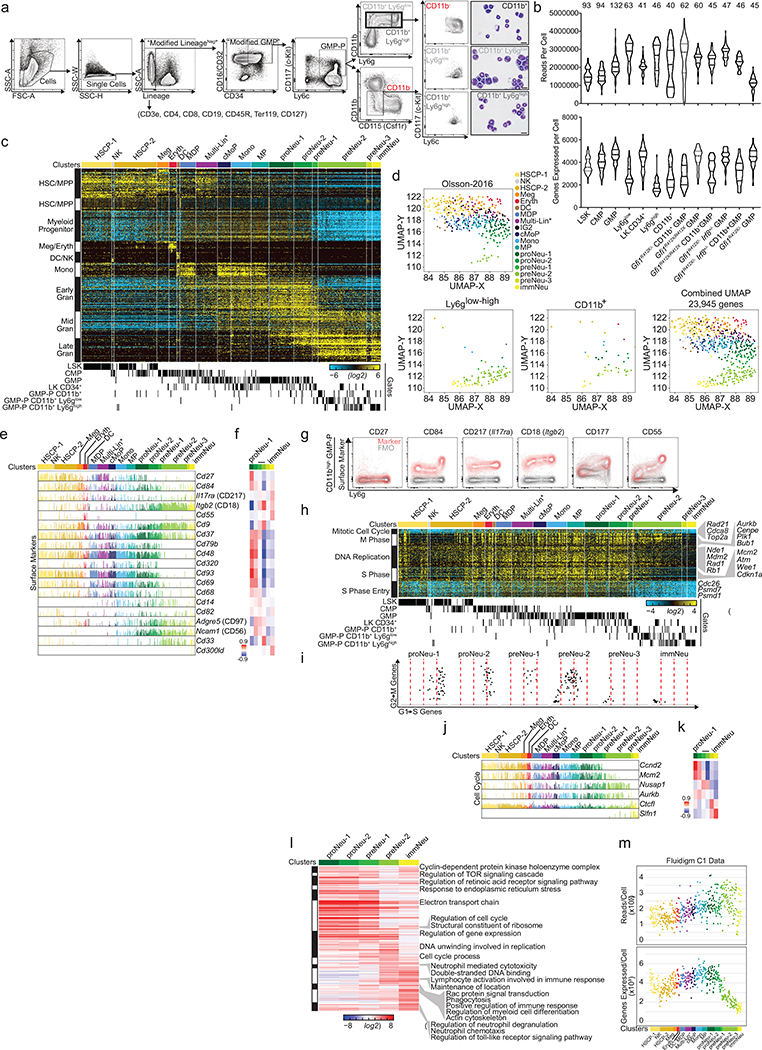
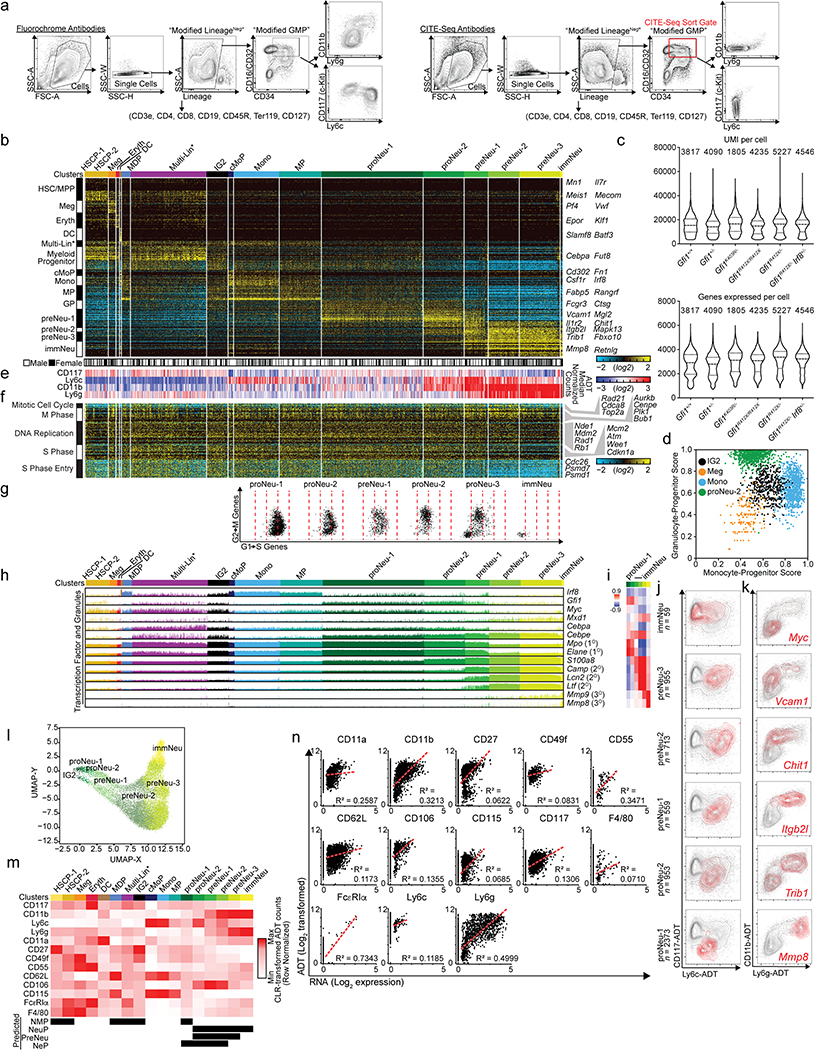
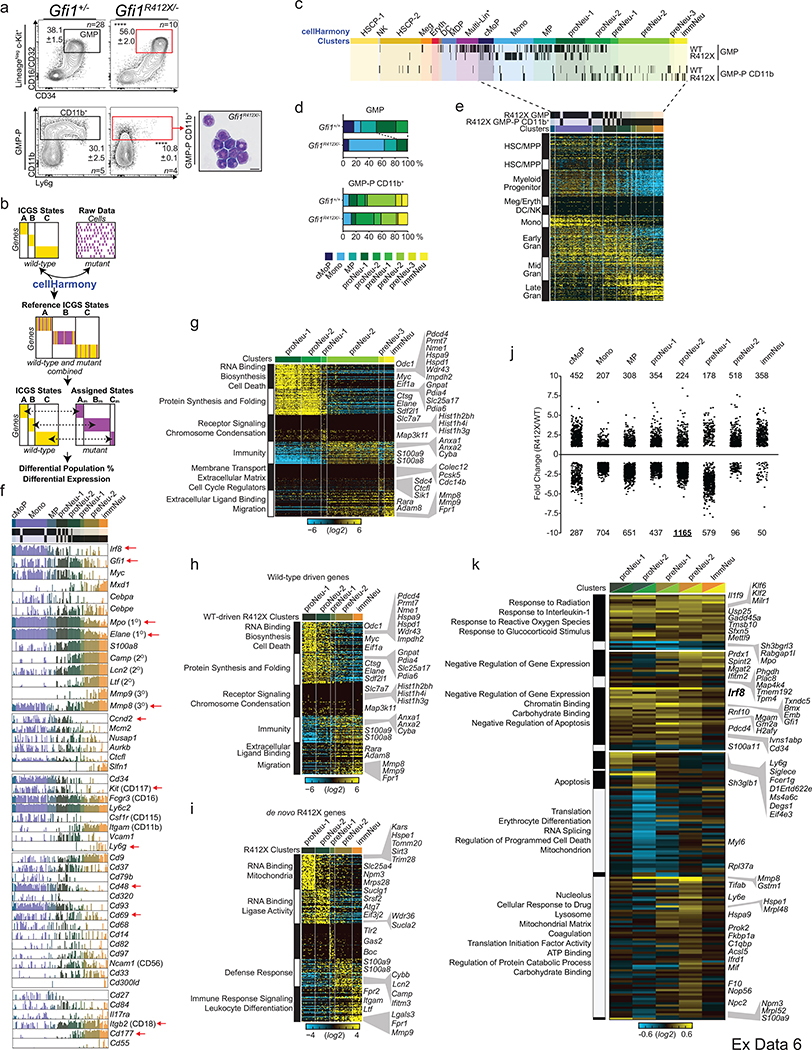
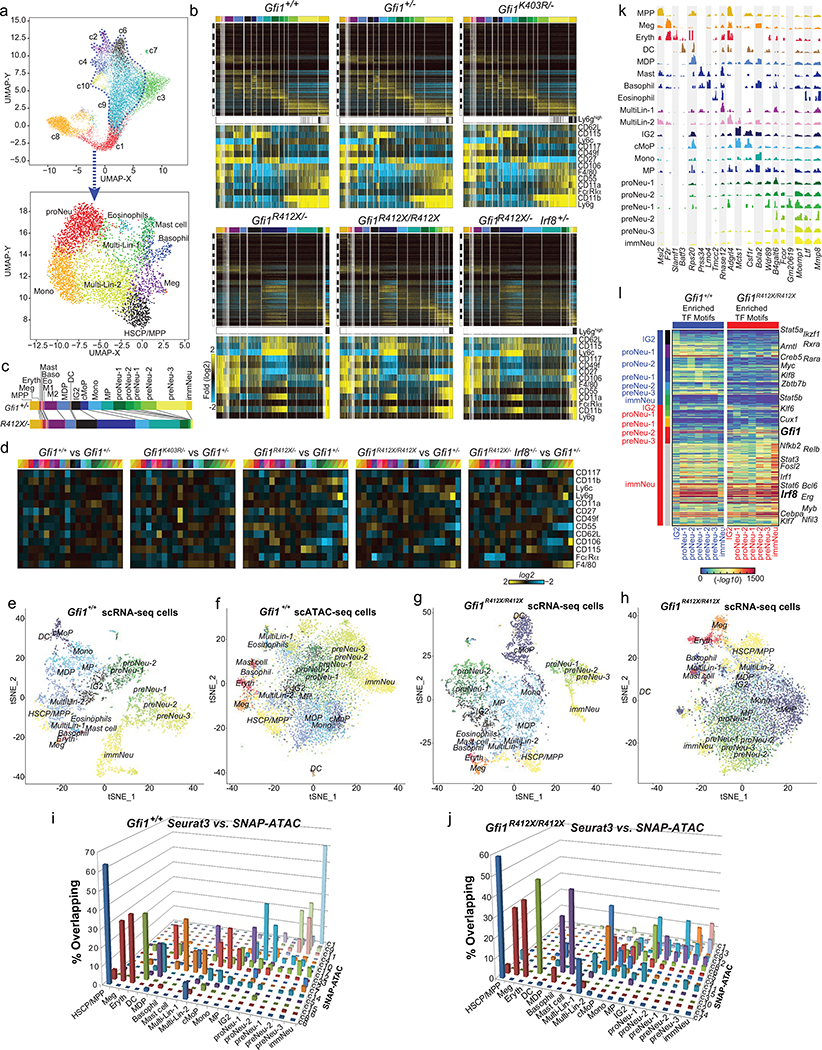
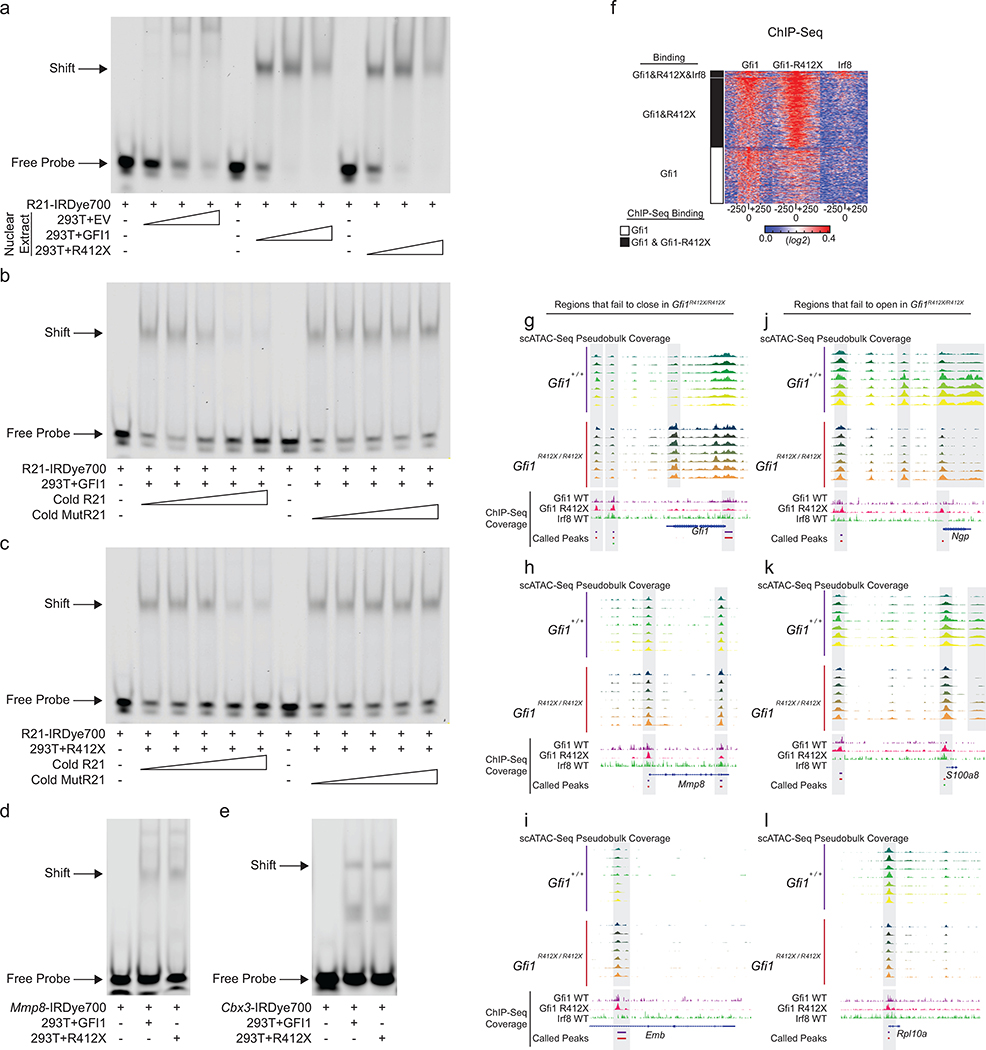
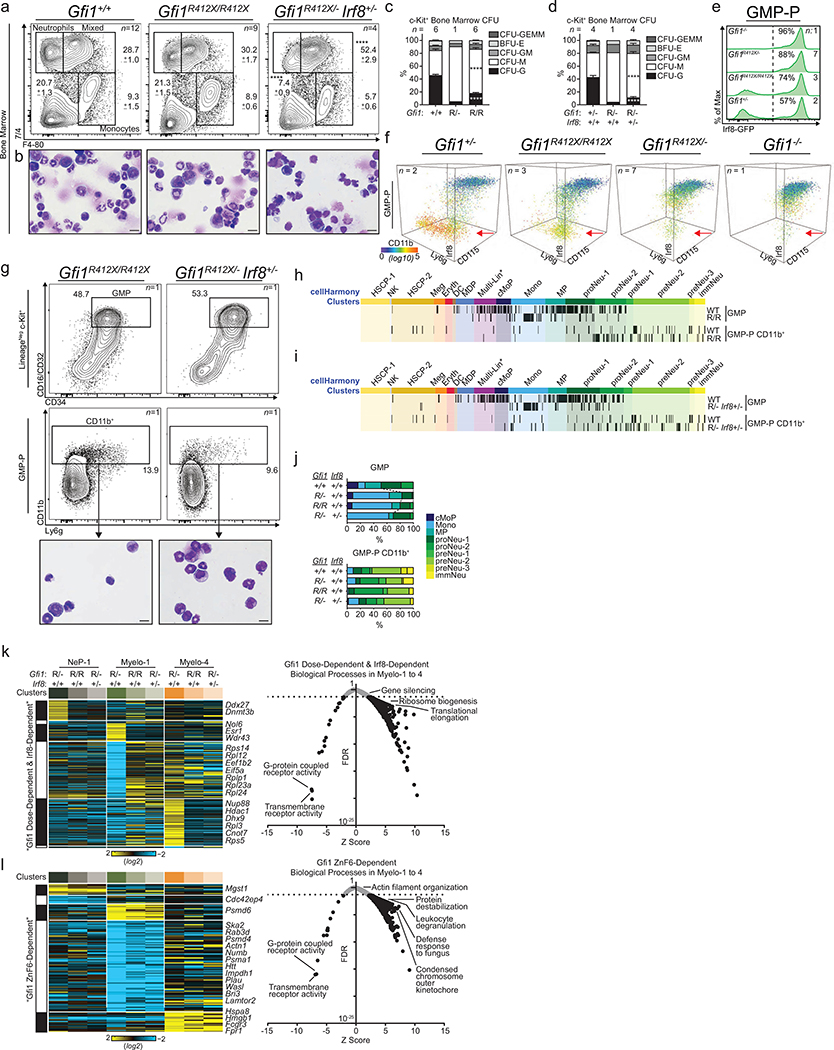
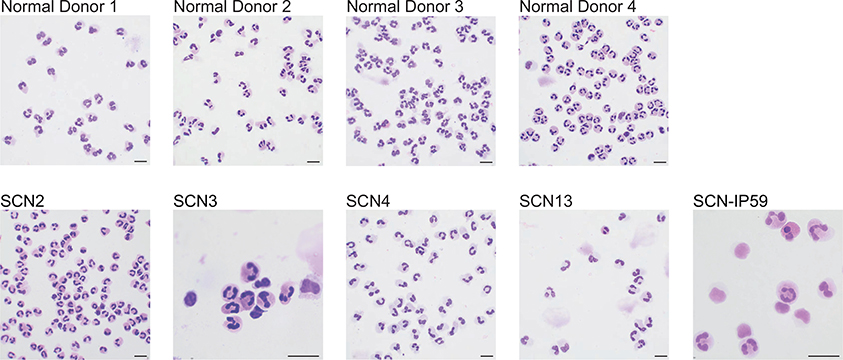
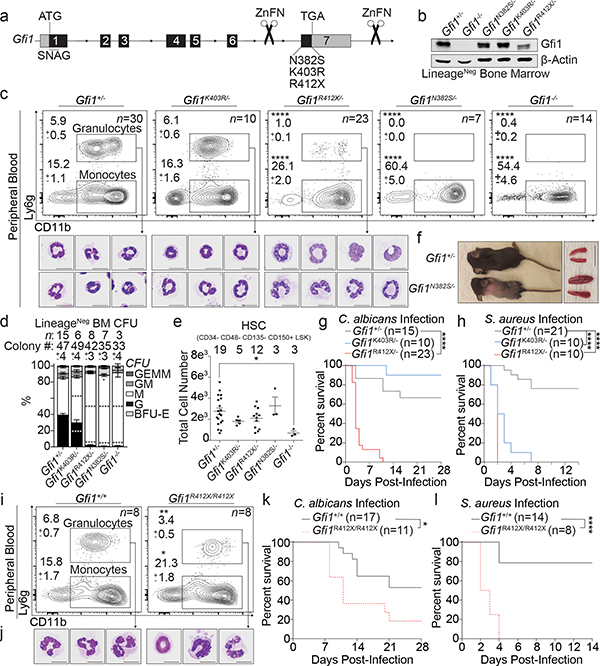
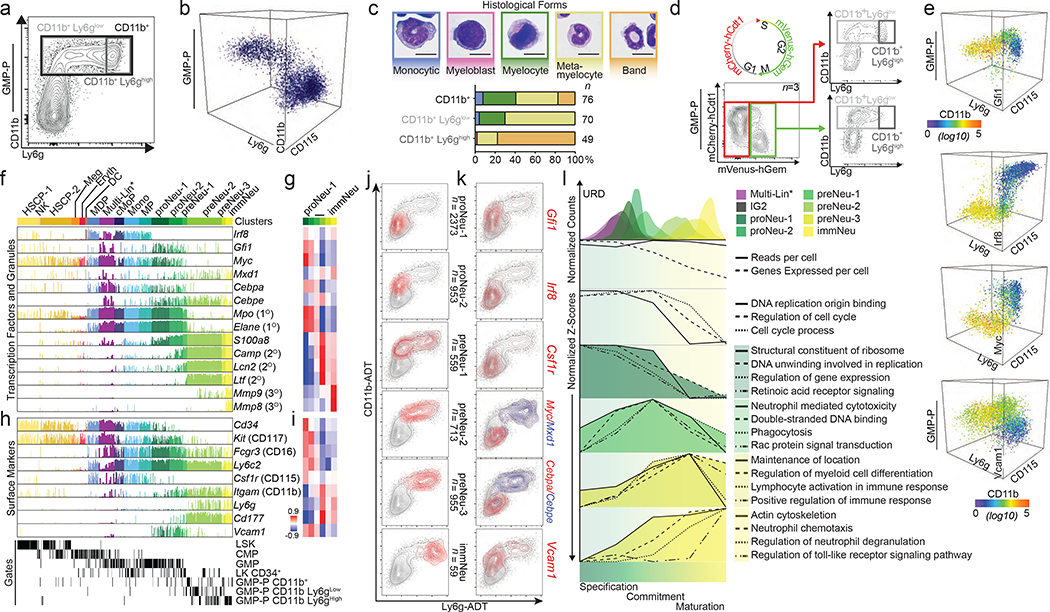
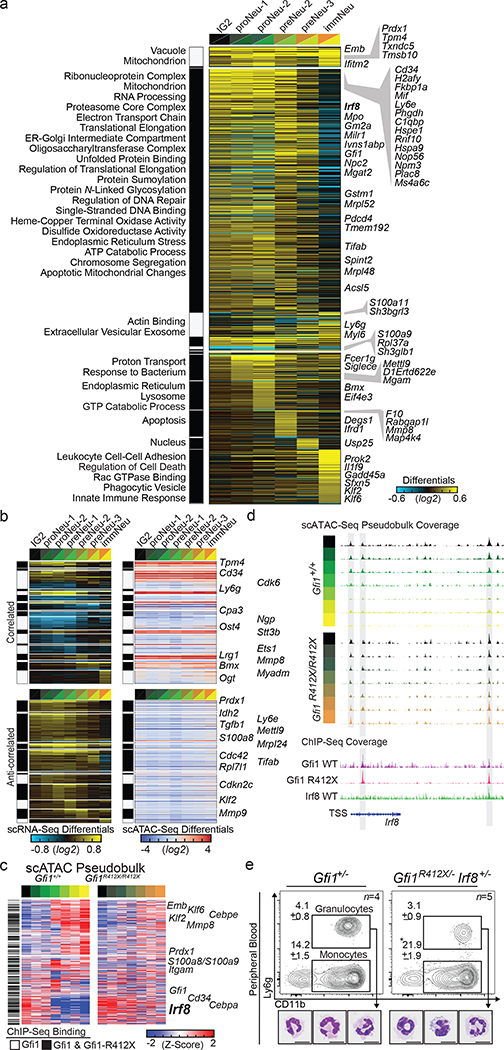
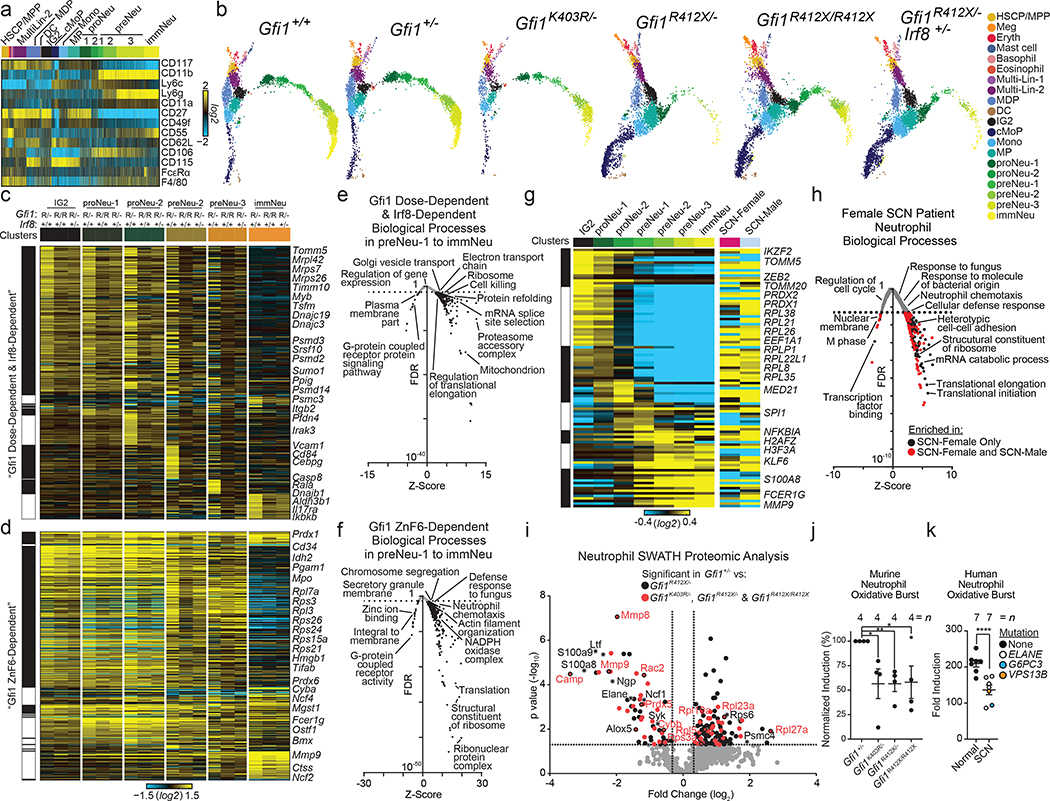
Advances in genetics and sequencing have identified a plethora of disease-associated and disease-causing genetic alterations. To determine causality between genetics and disease, accurate models for molecular dissection are required; however, the rapid expansion of transcriptional populations identified through single-cell analyses presents a major challenge for accurate comparisons between mutant and wild-type cells. Here we generate mouse models of human severe congenital neutropenia (SCN) using patient-derived mutations in the GFI1 transcription factor. To determine the effects of SCN mutations, we generated single-cell references for granulopoietic genomic states with linked epitopes1, aligned mutant cells to their wild-type equivalents and identified differentially expressed genes and epigenetic loci. We find that GFI1-target genes are altered sequentially, as cells go through successive states of differentiation. These insights facilitated the genetic rescue of granulocytic specification but not post-commitment defects in innate immune effector function, and underscore the importance of evaluating the effects of mutations and therapy within each relevant cell state.


Conflict of interest statement

The authors declare the following competing interests: DEM is currently employed by Eli Lilly and Company and KLN is employed by BioLegend Inc. The remaining authors declare no competing interests.

Figures

Extended Data Figure 1.
Extended Data Figure 1.. Functional assessment of SCN patient-derived GFI1 variants and generation of Gfi1 ZnF-mutant mice.
a, Representative FACS plots of lentiviral transduced LSK cells isolated from adult Irf8-eGFP transgenic mice with the %Irf8-eGFPhigh indicated. b, Graphical summary of FACS analysis of lentiviral transduced LSK cells isolated from adult Irf8-eGFP transgenic mice (top) with locations of the variants mapped to the GFI1 protein (bottom). EV; empty vector, *P2A; mutation not found in patients, italics; other variants detected in the same patient, bold; also found in patients diagnosed with a malignancy, ATG; start codon, TGA; stop codon, gray blocks; characterized protein domains, SNAG; Snail/Gfi1 family domain, SUMO; sumoylation domain, ZnF; zinc-finger. c, Schematic of the Gfi1 locus annotated with relevant features. Line with small arrows; intronic regions, numbered blocks; exons, black blocks; coding regions, gray blocks; noncoding regions, ATG; start codon, TGA; stop codon, SNAG; Snail/Gfi1 family domain-encoding region, ZFN; zinc-finger nucleases, large arrows; noncoding region used for genotyping. d-f, Schematic of the nucleotide changes made to the coding region and 3’ UTR to introduce the d, d’ N382S, e, e’ K403R, and f, f’ R412X mutations. g, Representative genotyping of the ZnF-mutant mice with or without restriction enzyme digestion. h, Representation of Sanger sequencing analysis of cDNA from adult whole bone marrow. Targeted wild-type nucleotides are underlined, mutated nucleotides are in bold, and red nucleotides indicate the location of the stop codon. i, Immunoblot analysis of two R412X founder lines using adult murine LineageNeg bone marrow lysates. j, Graphical summary of FACS analysis of neonatal murine peripheral blood. k, Total cell counts per mL of neonatal peripheral blood as determined by FACS. l, Representative RNAscope images (left) and transcript quantitation (right) of the indicated transcripts in primary human CD34+ cells. The number of cells scored (left) and the number of donors tested (right) is indicated. m, Representative elecropherogram plots from Sanger sequencing of GFI1 RT-PCR products derived from iPSC. The arrow indicates the nucleotide substitution made to introduce the R412X mutation. n, Representative FACS plots of iPSC cells at the end of the 10-day hematopoietic differentiation protocol. o, Representative cytospin images of iPSC-derived neutrophils. Data in a, b, and l are representative of three biological replicates, data in j and k are representative of individual biological replicates, and is plotted as mean in a or as mean ± s.e.m in b, j, k, and l. * p<0.05, ** p<0.01, *** p < 0.001, **** p < 0.0001 as determined by two-tailed t-test. Data in i displays two biological replicates for each founder line. Data in m-o are representative of two independent experiments. Scale bars in l represent 2 μm and 10 μm in o.
Extended Data Figure 2.
Extended Data Figure 2.. Characterization of Gfi1 ZnF-mutant mice at steady-state.
a, Graphical representation of FACS analysis of adult murine peripheral blood. b, FACS plots and graphical representation of FACS analysis of adult murine peripheral blood. c, Graphical summary of colony-forming-unit (CFU) assays performed on adult LineageNeg bone marrow cells from two different founder lines. G; granulocyte, M; monocyte, GM; granulocyte-monocyte, BFU-E; burst-forming-unit erythroid, GEMM; granulocyte, erythrocyte, monocyte, megakaryocyte. d, Total cell counts of adult murine whole bone marrow harvested from two femurs and tibias per mouse. e, FACS plots and quantitation of adult murine bone marrow populations. f, Representative cytospins of adult murine whole bone marrow. Data in f are representative of three biological replicates, and the scale bar represents 10 μm. Data in a-e are displayed as mean ± s.e.m. * p < 0.05, ** p < 0.01, *** p < 0.001, and **** p < 0.0001 as determined by two-tailed t-test.
Extended Data Figure 3.
Extended Data Figure 3.. Inflammatory-cytokine-independent emergency granulopoiesis and high G-CSF levels in Gfi1 ZnF-mutant mice at steady-state and functional analysis of Gfi1 ZnF-mutants.
a, FACS plots and quantitation of adult murine LineageNeg, c-Kit+, Sca-1+ bone marrow cells. b, Quantitation of adult peripheral blood cytokine levels at steady-state by cytokine array. c, Quantitation of individual adult peripheral blood cytokine levels at steady-state by Luminex analysis. d, Survival analysis of lethally irradiated BoyJ recipients of adult whole bone marrow from adult Gfi1-mutant donors. e, Graphical representation of FACS analysis of peripheral blood chimerism in transplant recipients from d at 4 months post-transplant. f-g, Graphical representations of the total number of colonies in murine organs harvested at the indicated time points (see arrowheads in Fig. 1g, h) after infection with f, an LD50 dose of C. albicans or g, 5 × 10⁷ CFU of S. aureus. h, Immunoblot analysis of adult murine LineageNeg bone marrow lysates. Data in a-c and e-g are displayed as mean ± s.e.m. * p < 0.05, ** p < 0.01, *** p < 0.001, **** p < 0.0001 as determined by two-tailed t-test in a-c and e-g. ** p < 0.01 as determined by two-sided Mantel-Cox test in d. Data in h are representative of 3 independent experiments.
Extended Data Figure 4.
Extended Data Figure 4.. FACS and Fluidigm-based analysis of steady-state terminal granulopoiesis.
a, FACS plots demonstrating the gating strategy used for sorting. The populations sorted for scRNA-Seq are indicated in shades of grey with accompanying cytospins. b, Violin plots of the gene and read-level metrics for each of the indicated libraries. Dashed lines indicate mean, lower, and upper quartiles. Sample size (n = # cells) displayed (top). c, Heatmap of gene expression defined by ICGS (Fluidigm C1, excluding cell-cycle genes) in scRNA-Seq data (n = 516 cells). Each column represents a single cell and each row represents a single gene. ICGS clusters are annotated (top). HSCP-1, haematopoietic stem cell progenitor; NK, natural killer T-cell progenitor; HSCP-2; Meg, megakaryocytic; Eryth, erythrocytic; DC, dentritic cell; MDP, monocyte dendritic cell progenitor; Multi-Lin*, multi-lineage primed; cMoP, common monocyte progenitor; Mono, monocytic; MP, monocyte-committed progenitors; proNeu-1, neutrophil progenitor, proNeu-2; preNeu-1, neutrophil precursor, preNeu-2, preNeu-3; immNeu, immature neutrophil. d, Joint UMAP plot of scRNA-Seq data from c separated according to archival () and new Fludigm captures. e, Bar chart of the heatmap in c displaying the incidence and amplitude of selected genes. f, Heatmap of correlation between gene expression and each displayed cluster as generated by MarkerFinder (AltAnalyze software). g, FACS plots comparing expression of Ly6g with the indicated surface marker. FMO; fluorescence minus one control. h, Heatmap of cell cycle gene expression in ICGS-defined clusters in scRNA-Seq data (n = 509 cells). Each column represents a single cell and each row represents a single gene. Gene expression clusters were generated in AltAnalyze and the ICGS clusters are annotated (top). FACS gates are annotated (bottom). LSK, LineageNeg c-Kit+ Sca-1+; CMP, common myeloid progenitor; GMP, granulocyte monocyte progenitor; LK CD34+, LineageNeg c-Kit+ Sca-1Neg CD34+; GMP-P CD11b+, granulocyte monocyte progenitor and precursor, GMP-P CD11b+ Ly6glow, GMP-P CD11b+ Ly6ghigh. Key genes are indicated (right). i, Scatter plot representation of scRNA-Seq data from h comparing the gene expression of G1 to S phase transition genes with G2 to M phase transition genes in each cell. Each point represents a single cell. j, Bar chart of the heatmap in h, displaying the incidence and amplitude of selected genes. k, Heatmap of correlation between gene expression and each displayed cluster as generated by MarkerFinder. l, Heatmap of enrichment for Gene Ontology biological processes enriched in the granulocytic clusters from the Fluidigm scRNA-Seq data from c with key processes indicated (right). m, Scatter plot representation of scRNA-Seq data from c where each point represents a single cell. Reads per cell indicate RSEM transcript aligned read counts for each cell library. Genes expressed per cell indicate the number of genes with a TPM>1 for each single-cell library. Data in a and g are representative of three biological replicates. Data in f and k display Pearson correlation values.
Extended Data Figure 5.
Extended Data Figure 5.. CITE-Seq analysis of steady-state terminal granulopoiesis.
a, FACS plots demonstrating the gating strategy used for sorting. The population sorted for scRNA-Seq is indicated in red. b, Heatmap of gene expression for cellHarmony assigned cell populations from CITE-Seq 10x Genomics captures (male and female mice, n = 11,132 cells) compared to ICGS-defined clusters from the Fluidigm scRNA-Seq data. De novo marker genes (MarkerFinder) for each assigned cluster from the 10x Genomics data are shown (top). Each column represents a single cell and each row represents a single gene. HSCP-1, haematopoietic stem cell progenitor; NK, natural killer T-cell progenitor; HSCP-2; Meg, megakaryocytic; Eryth, erythrocytic; DC, dentritic cell; MDP, monocyte dendritic cell progenitor; Multi-Lin*, multi-lineage primed; IG2, Irf8-expressing GMP subpopulation 2; cMoP, common monocyte progenitor; Mono, monocytic; MP, monocyte-committed progenitors; proNeu-1, neutrophil progenitor, proNeu-2; preNeu-1, neutrophil precursor, preNeu-2, preNeu-3; immNeu, immature neutrophil. The gender of the host mouse of each cellular barcode (bottom) and example MarkerFinder genes in common between Fluidigm and 10x Genomics data are indicated (right). c, Violin plots of the gene and read-level metrics for each of the indicated libraries. Dashed lines indicate mean, lower, and upper quartiles. Sample size (n = # cells) displayed (top). d, Lineage-priming scores for monocytic and granulocytic specification. Scatter plot displaying assigned scores for cellHarmony-assigned neutrophil progenitors (proNeu-2), monocytic progenitors (Mono), bi-potential monocytic-granuloctyic intermediates (IG2) and megakaryocyte progenitors (Meg) from b (see Online Methods). Each point represents a single cell. e, Heatmap of row normalized ADT UMI counts (log2, median substracted) for each corresponding cell from b. f, Heatmap of cell cycle gene expression displaying the same cells as b and the same genes as Extended Data Fig. 4h. g, Scatter plot representation of scRNA-Seq data from f comparing the gene expression of G1 to S phase transition genes with G2 to M phase transition genes in each cell. Each point represents a single cell. h, Bar chart of the heatmap in b, displaying the incidence and amplitude of selected genes. i, Heatmap of correlation between gene expression and each displayed cluster as generated by the MarkerFinder feature of AltAnalyze. j-k, Plots of CITE-Seq ADT UMIs where grey indicates all captured cells and j, red indicates cells classified by ICGS clusters or k, the top 1% of UMIs expressing the indicated gene. l, UMAP of 15,968 cell-barcodes colored according to cellHarmony assigned cell populations (10x genomics reference) where each dot represents a single cell. Minor contaminant populations (<30 cells per cluster) were excluded. m, Heatmap of row normalized CLR-transformed ADT counts of the indicated cell surface proteins (left) displayed as an average of all cells in the indicated clusters (top). n, Correlation plots between ADT UMI counts and the expression of genes (cellular barcode normalized UMI counts) encoding the corresponding proteins detected via CITE-Seq. Each dot represents a single cell. Linear trend lines for all cells with RNA expression >0 are indicated by dotted red lines with corresponding coefficients of determination displayed. Data in i displays Pearson correlation values.
Extended Data Figure 6.
Extended Data Figure 6.. Fluidigm-based transcriptional analysis of Gfi1R412X/- cells.
a, FACS plots of adult murine bone marrow (left) and representative cytospin of FACS-sorted adult murine bone marrow (right). The populations sorted for scRNA-Seq are indicated in red. b, Schematic summary of the cellHarmony algorithm. c, cellHarmony-assigned ICGS states of combined wild-type and Gfi1R412X/- Fluidigm scRNA-Seq data (n = 624 cells, excluding cell-cycle genes). Each tick mark represents data from a single cell. Gene expression clusters were generated in AltAnalyze and the ICGS clusters are annotated (top) (see Extended Data Fig. 4c) HSCP-1, haematopoietic stem cell progenitor; NK, natural killer T-cell progenitor; HSCP-2; Meg, megakaryocytic; Eryth, erythrocytic; DC, dentritic cell; MDP, monocyte dendritic cell progenitor; Multi-Lin*, multi-lineage primed; cMoP, common monocyte progenitor; Mono, monocytic; MP, monocyte-committed progenitors; proNeu-1, neutrophil progenitor, proNeu-2; preNeu-1, neutrophil precursor, preNeu-2, preNeu-3; immNeu, immature neutrophil. FACS gates are annotated (right). GMP, granulocyte monocyte progenitor; GMP-P CD11b+, granulocyte monocyte progenitor and precursor. d, Population distribution of Fluidigm scRNA-Seq data from Extended Data Fig. 6c and Extended Data Fig. 4c. e, cellHarmony heatmap of wild-type aligned Gfi1R412X/- cell gene expression as ordered in c (dotted lines). Each column represents a single cell and each row represents a single gene from Extended Data Fig. 4c. The FACS gates and ICGS clusters are annotated (top) and gene clusters are indicated (left). f, Bar chart of the heatmap in e, displaying the incidence and amplitude for selected genes. Arrows indicate differential expression of the adjacent gene, as compared to wild-type. g, Heatmap of MarkerFinder cell population-specific genes expression from the Fluidigm scRNA-Seq data (n = 191 cells) with enriched pathway associated genes (right) and statistically enriched Gene Ontology biological processes (left). h-i, Heatmap of h, wild-type-driven (same genes as in g) or i, de novo MarkerFinder genes for cellHarmony classified Gfi1R412X/- cell populations (n = 62 cells) annotated with enriched pathway associated genes (right) and statistically enriched Gene Ontology biological processes (left). j, Representation of the scRNA-Seq data from k displaying the fold change in gene expression in Gfi1R412X/- compared to wild-type cells in the indicated clusters with the number of genes up- or down-regulated displayed. Each point represents a single gene. k, Heatmap of Fluidigm differentially expressed Gfi1-target genes (excluding cell-cycle genes) where each column represents a single cell and each row represents a single gene, with key genes (right) and enriched biological processes (left) indicated. Cytospin data in a are representative of two biological replicates. Data in a are displayed as mean ± s.e.m. **** p < 0.0001 as determined by two-tailed t-test in a.
Extended Data Figure 7.
Extended Data Figure 7.. Population analysis of 10x Genomics-based scRNA-Seq data and label transfer from CITE-Seq transcriptome to scATAC-Seq cells.
a, Identification of additional cell populations from wild-type scRNA-Seq data (ICGS unsupervised analysis, male-female CITE-Seq datasets). UMAP projections of scRNA-Seq data where the cell barcodes within the outlined region (top) were analyzed for additional heterogeneity through a second ICGS analysis (bottom). b, Heatmaps of additional CITE-Seq captures with cell assignments from cellHarmony. cellHarmony classifications were derived using the refined cluster annotation assignments from Extended Data Fig. 6c and 7a. Each panel displays a scRNA-Seq heatmap of MarkerFinder genes from the cellHarmony reference (top), where each column represents a single cell and each row represents a single gene. Those cell barcodes captured from an independent FACS sort of Ly6ghigh/CD11bhigh GMP-P cells are indicated by a black bar (middle). Relative expression of median normalized ADTs (right) are shown in the bottom heatmaps. c, Assigned cell-population frequencies for Gfi1+/− and Gfi1R412X/- CITE-Seq (Modified GMP gate) cells datasets from cellHarmony. d, Heatmaps of differential ADT expression compared to Gfi1+/− for the indicated markers (right). e, tSNE plot of CITE-Seq transcriptome for the Gfi1+/+ sample. f, tSNE plot of scATAC-Seq for the Gfi1+/+ sample. g, tSNE plot of CITE-Seq transcriptome for the Gfi1R412X/R412X sample. h, tSNE plot of scATAC-Seq for the Gfi1R412X/R412X sample. i, Comparison of Seurat transferred CITE-Seq labels to unsupervised scATAC-Seq cell population prediction methods (SNAP-ATAC) for Gfi1+/+. Percentage of overlapping cells for all pairwise comparisons between SNAP-ATAC clusters to CITE-Seq clusters derived from Seurat label transfer. j, Comparison of Seurat transferred CITE-Seq labels to unsupervised scATAC-Seq cell population prediction methods (SNAP-ATAC) for Gfi1R412X/R412X. Percentage of overlapping cells for all pairwise comparisons between SNAP-ATAC clusters to CITE-Seq clusters derived from Seurat label transfer. k, Cell-cluster combined scATAC-Seq marker peaks associated with Gfi1+/+ CITE-Seq annotated cell populations (Seurat 3 label transfer using cicero gene activity scores). Each row is a cluster (left) and each column is a locus within 50 kb of a CITE-Seq marker gene for each cluster (bottom), where the colored bars represent the normalized read count coverage. l, Heatmaps of transcription factor (TF)-motif-enrichment probabilities (-log10) in accessible regions of Gfi1+/+ (blue) or Gfi1R412X/ R412X (red) cell populations (indicated left). Each row represents a TF motif from the Cisbp2 database (indicated right). Each dot in a and e-h represents a single cell barcode that is pseudo-colored for its ICGS predicted cluster.
Extended Data Figure 8.
Extended Data Figure 8.. In vitro DNA binding analysis and in vivo ChIP-Seq and scATAC-Seq analysis of Gfi1-R412X.
a-e, EMSA using nuclear extracts of 293T cells transfected with a GFI1, GFI1-R412X, or empty (EV) expression vector. Arrows indicate bound (shift) and free probe. All data represent one experiment. a-c, A probe containing a high affinity GFI1 binding site (R21) was incubated with a, a titration of nuclear extracts, b-c, a titration of cold competitors with (R21) or without (MutR21) a high affinity GFI1 binding site. d-e, Nuclear extracts were incubated with probes containing a GFI1 binding site taken from the d, Mmp8 or e, Cbx3 locus. These loci contain a GFI1 ChIP-Seq peak and the corresponding genes are differentially expressed in Gfi1R412X/- Fluidigm scRNA-Seq data. f, Heatmap of ChIP-Seq read coverage at Gfi1-specific peaks where each row represents one peak that was called in the wild-type and each column represents a DNA-base position of the peak centered on each Gfi1 called peak in the indicated ChIP samples. The cluster color (left) indicates loci bound by Gfi1 alone (white) or by Gfi1 and Gfi1-R412X (black). g-l, Schematics of the indicated genomic loci displaying scATAC-Seq pseudobulk accessibility in the color-coded clusters (top) or ChIP-Seq reads and called peaks (bottom), with differentially accessible regions bound by Gfi1 shaded.
Extended Data Figure 9.
Extended Data Figure 9.. Fluidigm-based transcriptional analysis of Gfi1R412X/- genetic rescues.
a, FACS plots and b, representative cytospins of adult murine bone marrow. c-d Graphical summary of colony-forming-unit (CFU) assays performed on c-Kit+ bone marrow cells. G; granulocyte, M; monocyte, GM; granulocyte-monocyte, BFU-E; burst-forming-unit erythroid, GEMM; granulocyte, erythrocyte, monocyte, megakaryocyte. e, FACS plots of murine bone marrow cells isolated from Irf8-eGFP transgenic mice with the mean %Irf8-GFPhigh indicated. f, 3D FACS plots of bone marrow isolated from adult Irf8-eGFP mice. Events are pseudocolored for CD11b expression and arrows indicate changes in the incidence of granulocytic populations. g, FACS plots and representative cytospins of adult murine bone marrow populations sorted for scRNA-Seq. h-i, cellHarmony-assigned Gfi1R412X/R412X and Gfi1R412X/-Irf8+/− cells to wild-type reference Fluidigm scRNA-Seq populations (h, n = 86 cells, i, n = 88 cells). Each tick mark represents a single cell library. ICGS clusters are annotated (top). HSCP-1, haematopoietic stem cell progenitor; NK, natural killer T-cell progenitor; HSCP-2; Meg, megakaryocytic; Eryth, erythrocytic; DC, dentritic cell; MDP, monocyte dendritic cell progenitor; Multi-Lin*, multi-lineage primed; cMoP, common monocyte progenitor; Mono, monocytic; MP, monocyte-committed progenitors; proNeu-1, neutrophil progenitor, proNeu-2; preNeu-1, neutrophil precursor, preNeu-2, preNeu-3; immNeu, immature neutrophil. FACS gates are annotated (right). GMP, granulocyte monocyte progenitor; GMP-P CD11b+; granulocyte monocyte progenitor and precursor. j, Population distribution of Fluidigm scRNA-Seq data from h, i, Extended Data Fig. 4c, and Extended Data Fig. 6c. j-k, Fluidigm scRNA-Seq heatmaps (left) of genes that are genetically repaired in each cluster, with key genes indicated. Adjacent plot (right) of enriched biological processes in the indicated clusters. Scale bars in b and g represent 10 μm. Cytospin data in b are representative of three biological replicates. Data in a, c, and d are displayed as mean ± s.e.m or mean in e. **** p < 0.0001 as determined by two-tailed t-test in a, c, and d.
Extended Data Figure 10.
Extended Data Figure 10.. G-CSF pushed SCN-patient neutrophils are morphologically normal but functionally defective.
Representative cytospins of purified human peripheral blood neutrophils. The data is representative of one experiment per donor. Scale bars in represent 10 μm.
Figure 1.
Figure 1.. Neutropenia-patient-derived mutations induce steady-state murine dysgranulopoiesis and broad immune defects.
a, Schematic of Gfi1 locus; locations of mutations introduced by genome editing. b, Immunoblot of adult murine LineageNeg bone marrow. c, FACS plots with percentages of total adult peripheral blood, and cytospins of FACS-sorted CD11b+ Ly6g+ cells. d, Colony-forming-unit (CFU) assays performed on LineageNeg bone marrow cells. G; granulocyte, M; monocyte, GM; granulocyte-monocyte, BFU-E; burst-forming-unit erythroid, GEMM; granulocyte, erythrocyte, monocyte, megakaryocyte. e, FACS analysis of adult murine bone marrow. HSC, hematopoietic stem cell; LSK, LineageNeg Sca-1+ c-Kit+. f, Representative images of adult mice and spleens. g-h, Survival of mice infected with g, an LD50 dose of Candida albicans or h, 5 × 10⁷ CFU of Staphylococcus aureus. Mouse numbers in parentheses. i, FACS plots and j, cytospins from R412X homozygotes. k-l, Survival of mice infected with k, an LD50 dose of C. albicans or l, 5 × 10⁷ CFU of S. aureus. Mouse numbers in parentheses. Data are displayed as mean ± s.e.m. from independent biological replicates in c-e, and i. Data in b represents 3 independent experiments. Images in f are representative of 2 littermate mice for each genotype. * p < 0.05, ** p < 0.01, and **** p < 0.0001 as determined by two-tailed t-test in c-e, and i or by two-sided Mantel-Cox test in g, h, k, and i. The scale bars represent 10 μm in c and j and 1 cm in f.
Figure 2.
Figure 2.. Cell states traversed during commitment to terminal granulopoiesis include a rare transitional state (bridging specification to commitment).
a, FACS plot with annotated gates used to sort cells for scRNA-Seq (see Extended Data Fig. 4a; granulocyte-monocyte-progenitor and precursor “GMP-P” gate). b, 3D FACS plot of GMP-P gate (see Extended Data Fig. 4a). c, Quantified histological forms of FACS-sorted cells (from gates in a). d, Schematic of fluorescent cell cycle reporter and representative FACS plots of GMP-P gate from Fucci2 transgenic mice. e, 3D FACS plots of bone marrow isolated from adult mice bearing Gfi1, Irf8 or Myc fluorescent-protein reporters, or Vcam1 expression. Events are pseudocolored for CD11b expression. f, Bar chart displaying incidence and amplitude for selected genes (Fluidigm C1; see Extended Data Fig. 4c)(n = 509 cells). ICGS clusters are annotated (top) FACS gates are annotated (bottom). g, Heatmap of correlation between gene expression and each displayed cluster (MarkerFinder). h, Bar chart displaying selected genes (same cells as in f). i, Heatmap of correlation between gene expression and each displayed cluster (MarkerFinder). j-k, Plots of ADT UMIs (10X 3’: see Extended Data Fig. 5b, e) where grey indicates all captured cells: j, red identifies cells within ICGS clusters (right). k, red or blue indicates the top 1% of cells expressing the indicated gene(s). l, URD pseudotime analysis (of data in Extended Data Fig. 5b), and transcriptional features, or normalized Z-scores of enriched biological processes (of data in Extended Data Fig. 4c). Data are representative of three independent biological replicates in a, b, d, and e. Data in c represents cumulative total cell numbers from one experiment using cells pooled from 3 male mice. Data in g and i display Pearson correlation values. LSK, LineageNeg c-Kit+ Sca-1+; CMP, common myeloid progenitor; LK CD34+, LineageNeg c-Kit+ Sca-1Neg CD34+.
Figure 3.
Figure 3.. A single mutation in a lineage-determining transcription factor differentially impacts target gene expression in distinct cell states.
a, cellHarmony differential expression heatmap. scRNA-Seq libraries from Gfi1R412X/- and Gfi1+/− mice were analyzed (10X 3’ mod-GMP gate and Ly6ghigh GMP-P gate), then restricted to Gfi1 ChIP-Seq targets (841 out of 1462 total), and genes commonly deregulated across 10x and Fluidigm platforms are displayed (right)(see Extended Data Fig. 6k). Each row represents a single gene, each column the fold difference, and enriched Gene Ontology terms (left). b, Differential cicero gene activity scores correlated (top) or anticorrelated (bottom) with scRNA-Seq differentially expressed genes (from panel a). c, Heatmaps of scATAC-Seq pseudo-bulk data from Gfi1 and Gfi1-R412X bound loci (black bars on left, and see Extended Data Fig. 8e). ICGS clusters (top). Each row is a gene locus (right). d, Schematic of the Irf8 locus displaying scATAC-Seq pseudobulk accessibility with regions bound by Gfi1 shaded (top). ChIP-Seq reads (bottom). ICGS clusters (left). e, FACS plots and representative cytospins of FACS-sorted CD11b+ Ly6g+ cells from adult murine peripheral blood. In e, data are displayed as mean ± s.e.m. from independent biological replicates; * p < 0.05 as determined by two-tailed t-test, and scale bars represent 10 μm.
Figure 4.
Figure 4.. Rescuing specification does not repair innate immune effector functions that are programmed after commitment.
a, Heatmap of median-normalized values of antibody-dependent tags (ADT) from CITE-Seq of sorted wild-type mod-GMP-gate cells. b, Joint UMAP projection of CITE-Seq from the indicated genotypes, each dot represents one cell, and cluster identity is color coded (cellHarmony) to highlight genetic repair (Gfi1R412X/R412X and Gfi1R412X/-Irf8+/−)(also see Extended Data Fig. 7b). c-d, Heatmap of gene expression that is c, genetically repaired or d, not genetically repaired in each cluster (top), with representative genes indicated (right). e-f, Enriched Gene Ontology from e, genetically repaired genes (in c), or f, genes not genetically repaired (in d). g, Heatmap of genes that are differentially expressed in SCN-patient neutrophils (right), and their dynamic expression across murine wild-type clusters is shown (left). h, Enriched biological processes (from genes in g)(Grey dots; control versus female. Red dots: changes conserved to control versus male). i, Volcano plot displaying SWATH proteomics data. (Black dots: differential proteins between Gfi1R412X/- and Gfi1+/− neutrophils. Red dots: change conserved in Gfi1R412X/-, Gfi1K403R/- and Gfi1R412X/R412X neutrophils. j-k, Oxidative burst in purified neutrophils from j, murine bone marrow or k, human peripheral blood. Data in j and k are represented as mean ± s.e.m. from independent biological replicates. * p < 0.05, ** p < 0.01, **** p < 0.0001 as determined by two-tailed t-test for j and k.

References

    1. Stoeckius M et al. Simultaneous epitope and transcriptome measurement in single cells. Nat Methods 14, 865–868, doi:10.1038/nmeth.4380 (2017). - DOI - PMC - PubMed
    1. Gilbert SF Developmental Biology, 6th edition. (Sinauer Associates, 2000).
    1. An interactive online viewer of murine hematopoietic gene expression, <http://www.altanalyze.org/ICGS/Neutrophil/Viewer.php> (
    1. DePasquale EAK et al. cellHarmony: cell-level matching and holistic comparison of single-cell transcriptomes. Nucleic Acids Res, doi:10.1093/nar/gkz789 (2019). - DOI - PMC - PubMed
    1. Stuart T et al. Comprehensive Integration of Single-Cell Data. Cell 177, 1888–1902.e1821, doi:10.1016/j.cell.2019.05.031 (2019). - DOI - PMC - PubMed

Publication types

MeSH terms