. 2020 Jun;582(7810):119-123.
doi: 10.1038/s41586-020-2244-6. Epub 2020 Apr 29.

Convergent genes shape budding yeast pericentromeres

Affiliations

Convergent genes shape budding yeast pericentromeres

Flora Paldi et al. Nature. 2020 Jun.

Abstract

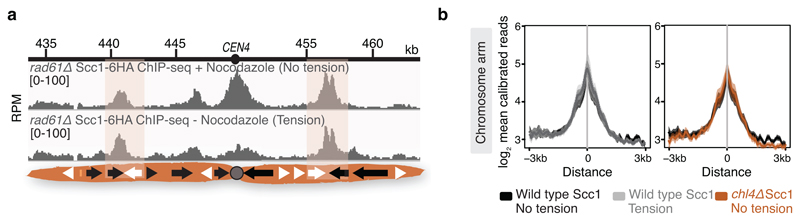
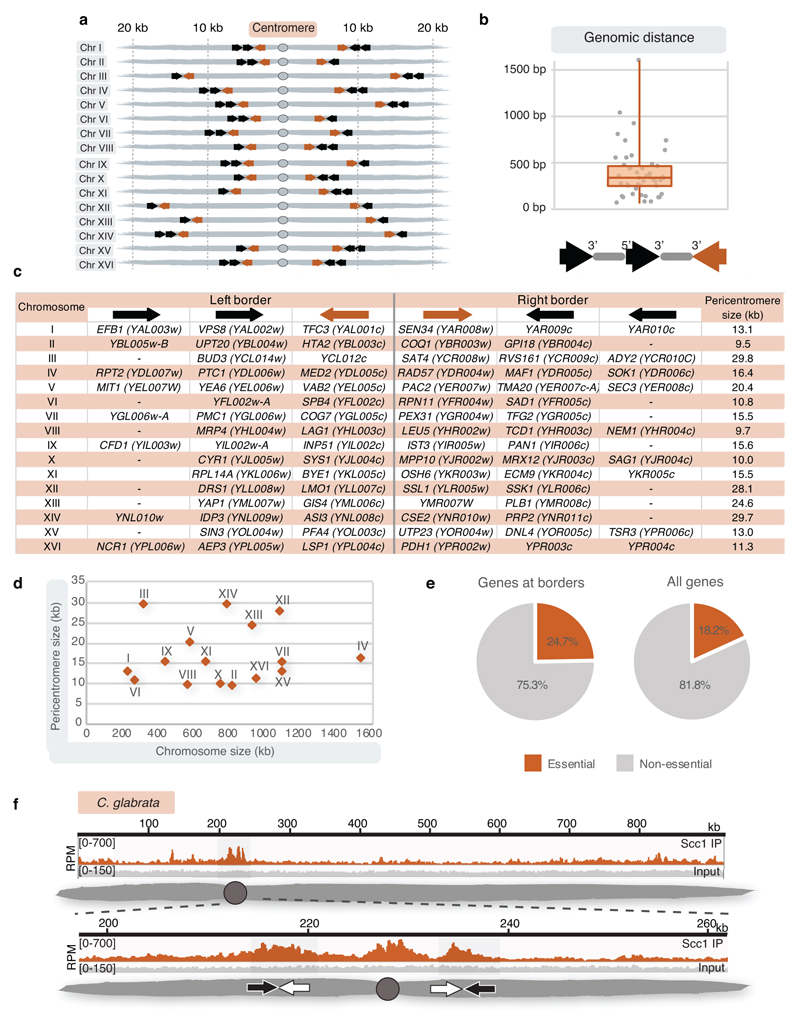
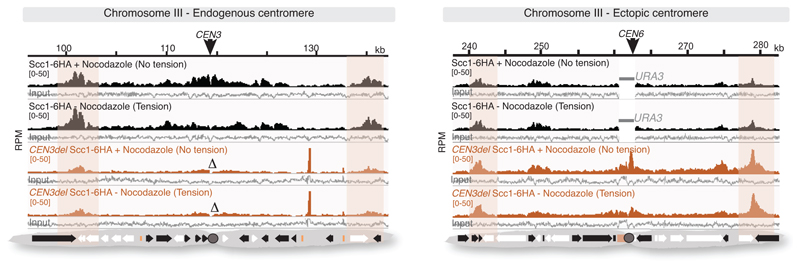
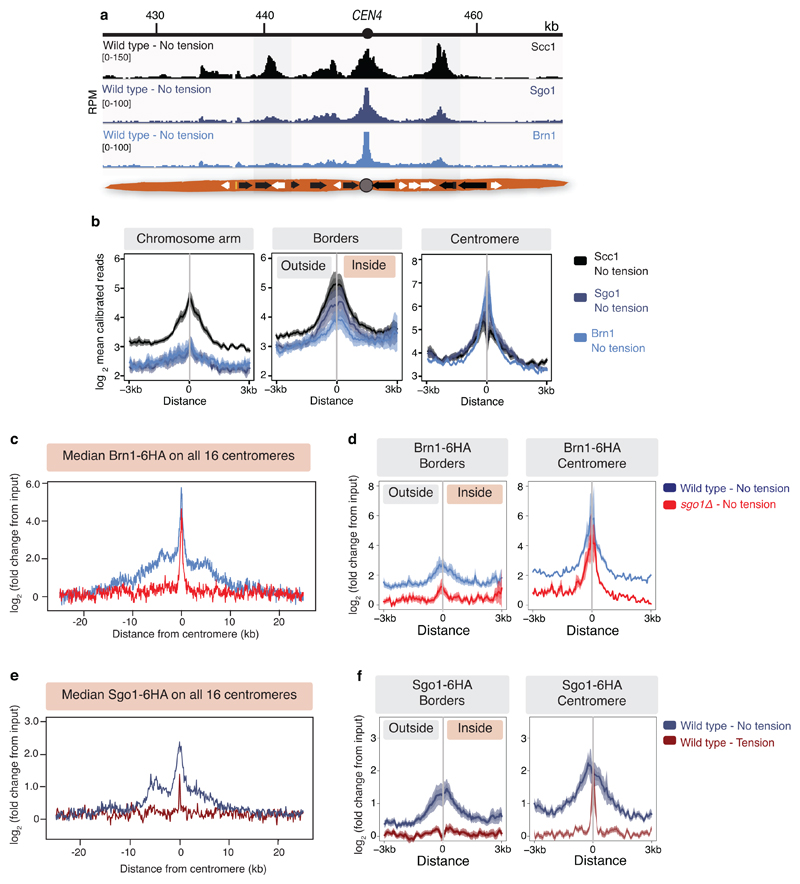
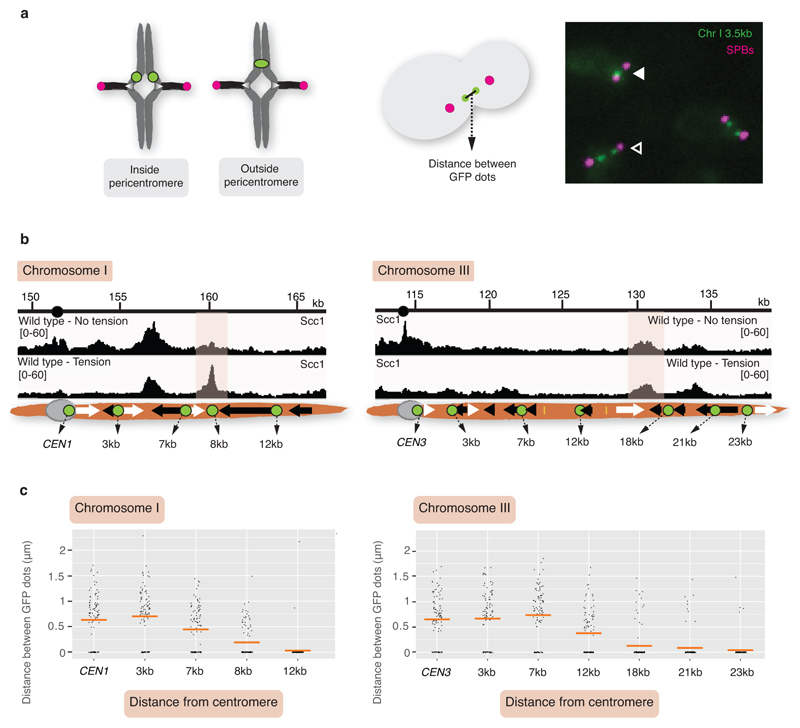
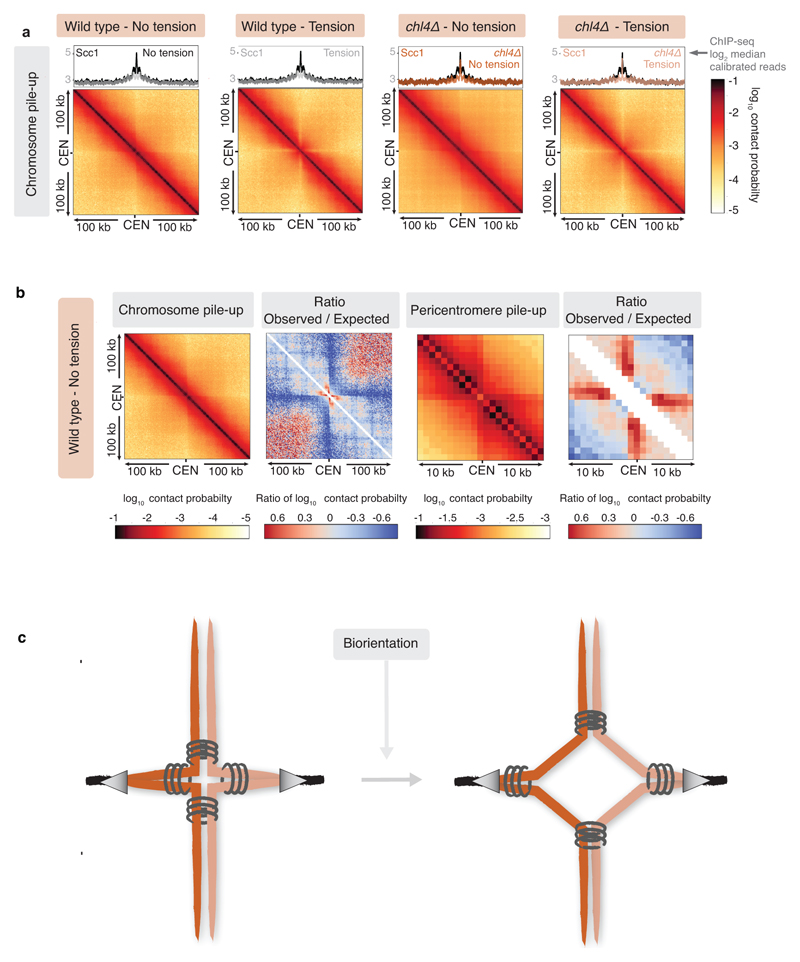
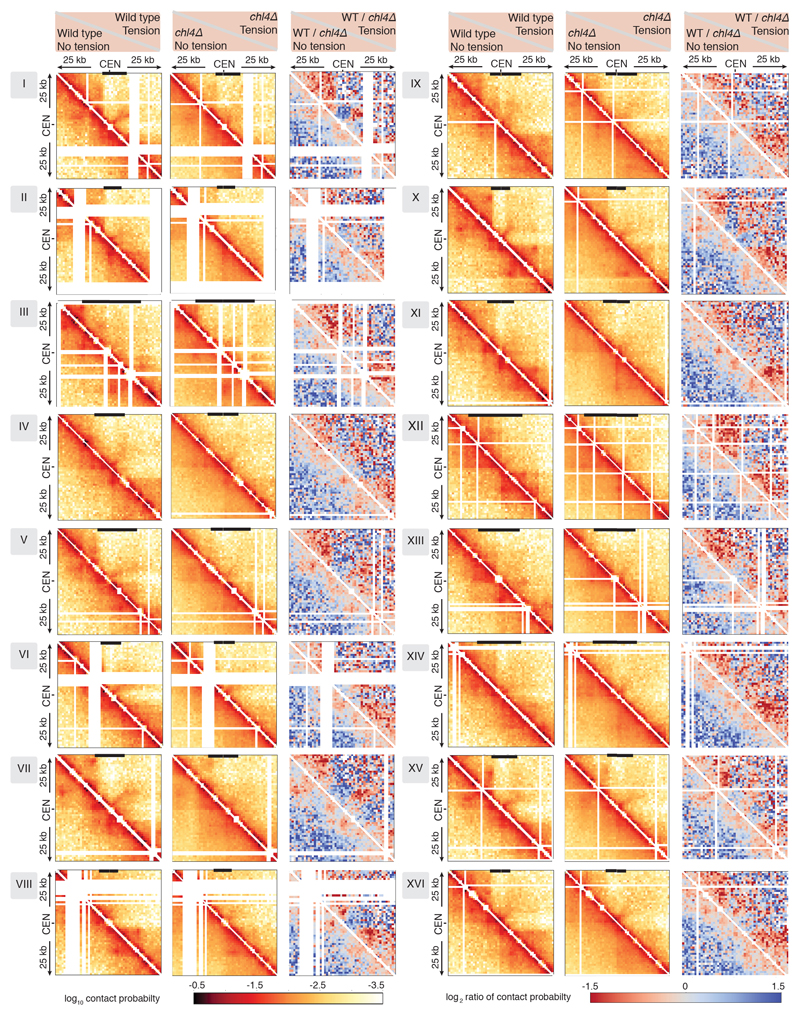
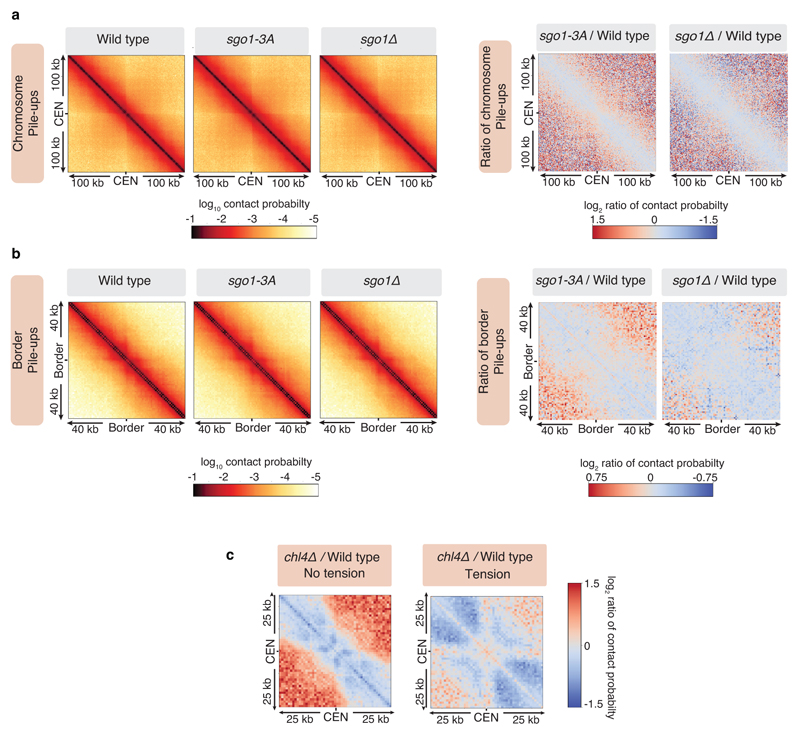
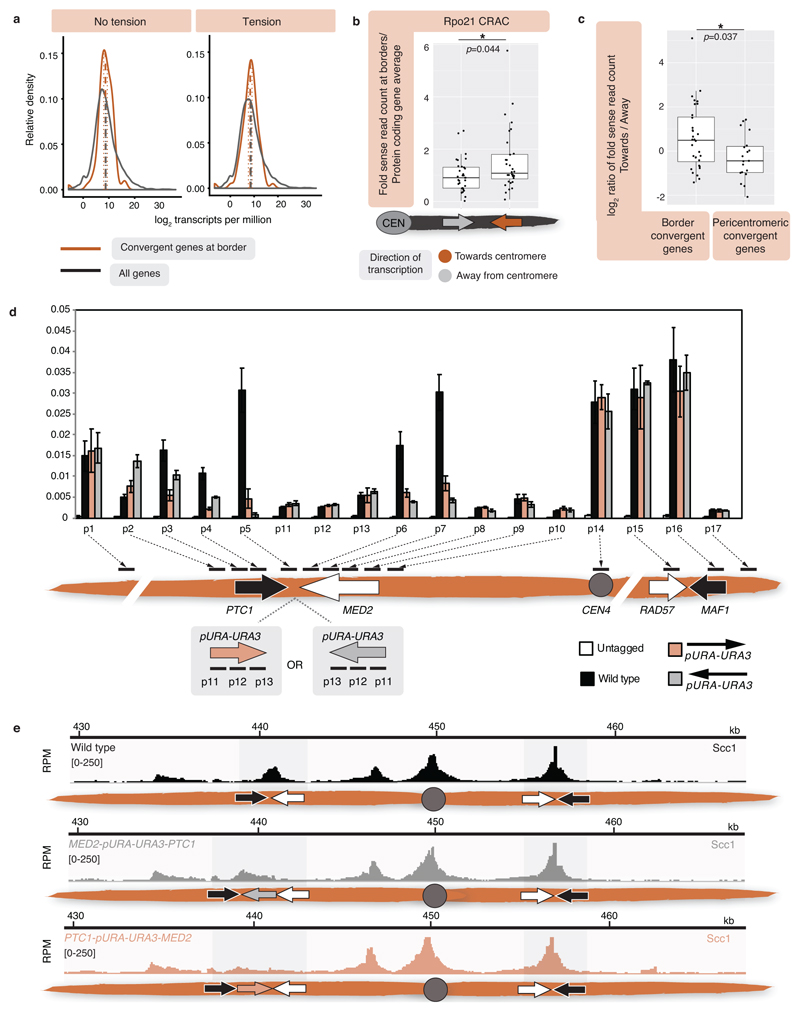
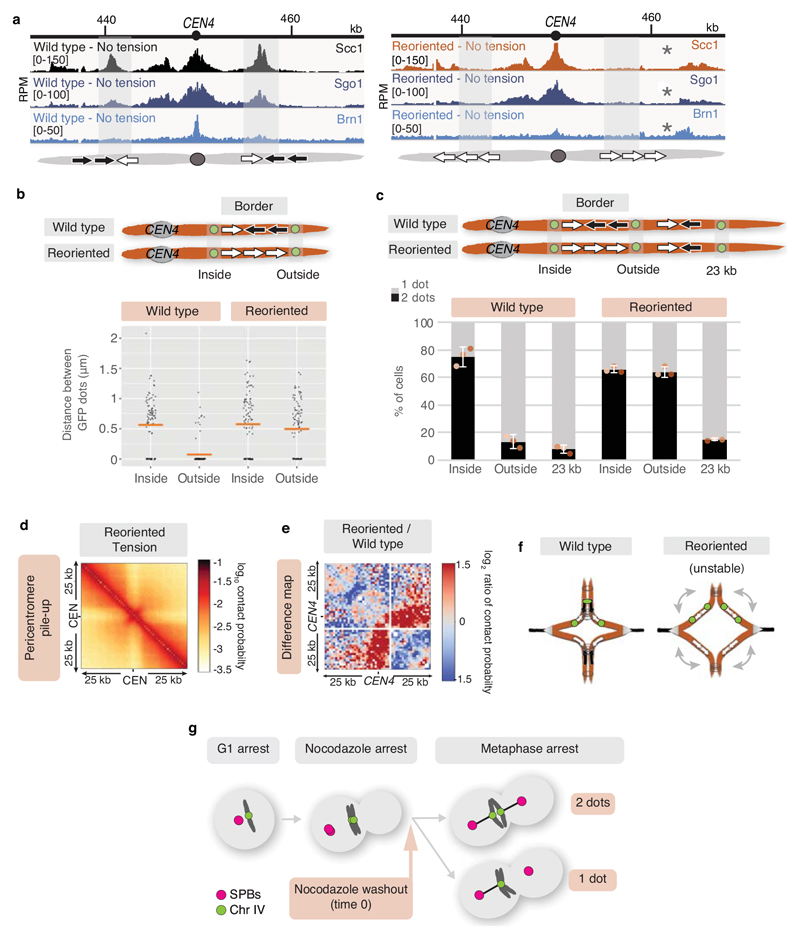
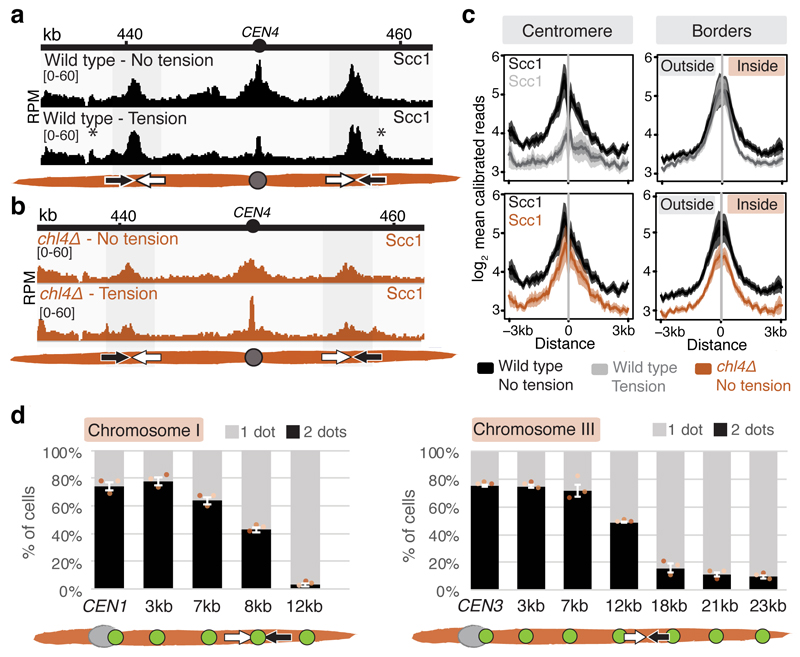
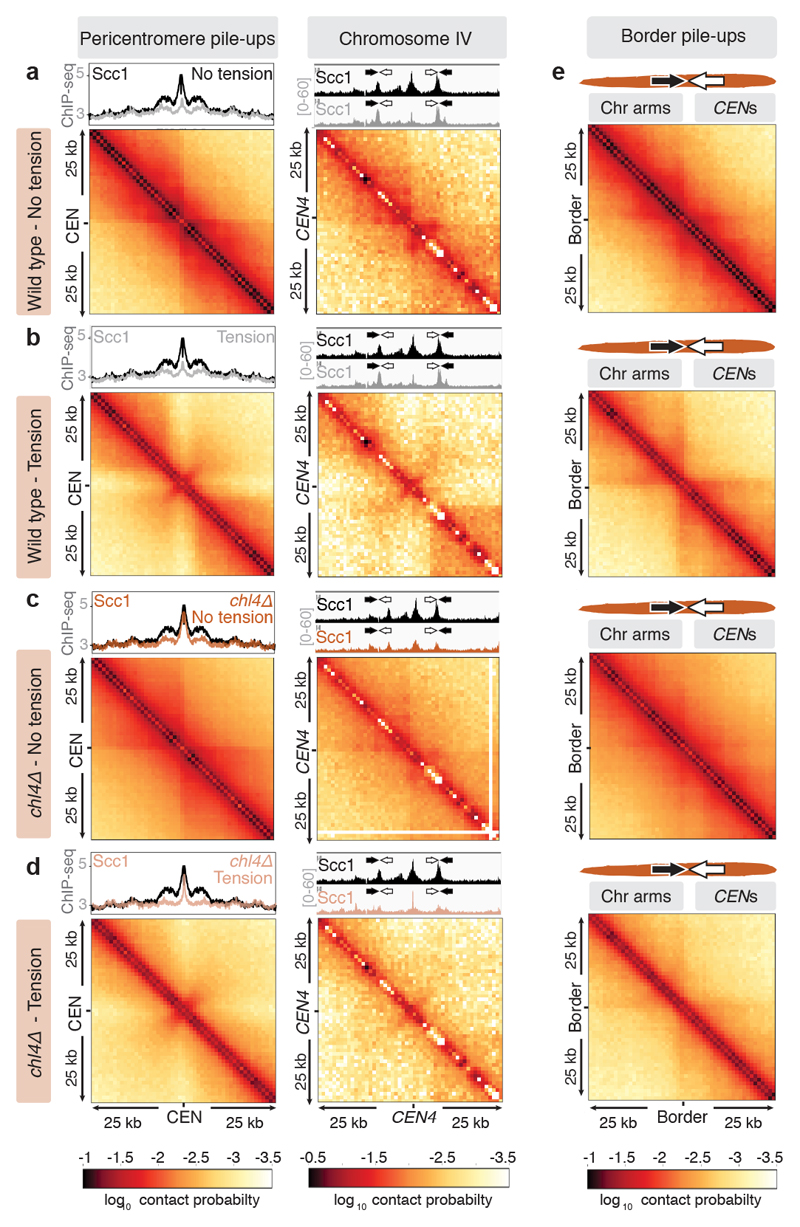
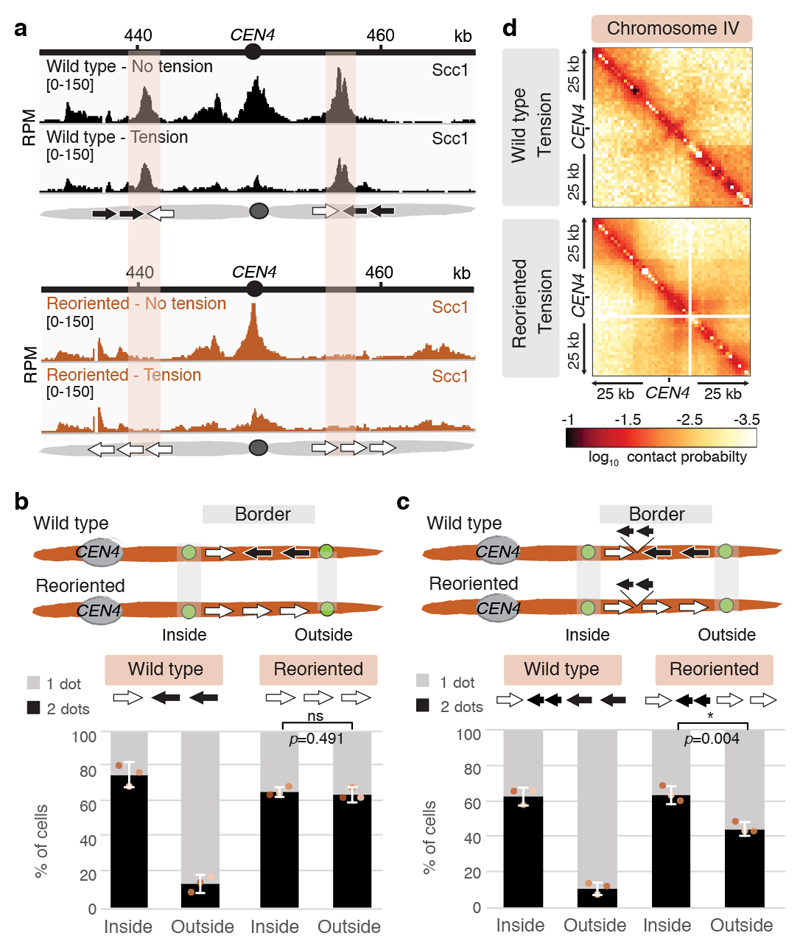
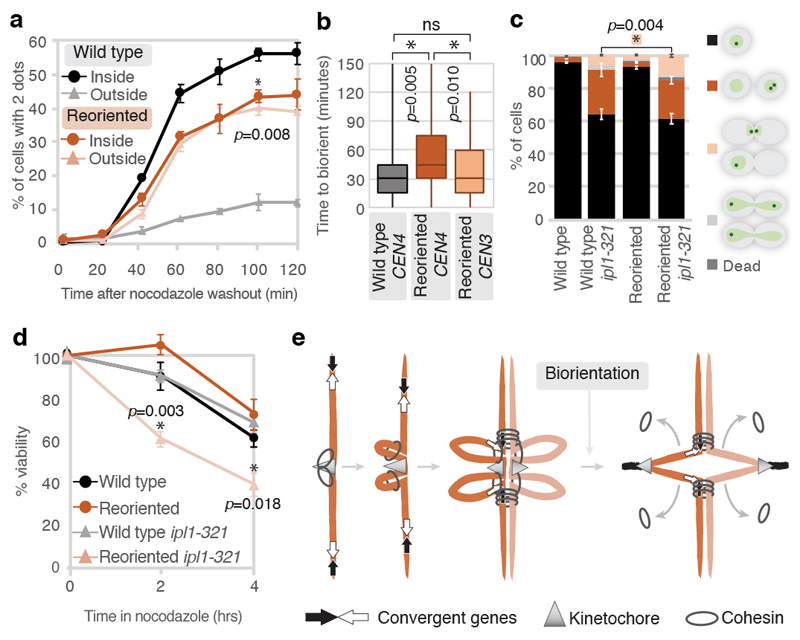
The three-dimensional architecture of the genome governs its maintenance, expression and transmission. The cohesin protein complex organizes the genome by topologically linking distant loci, and is highly enriched in specialized chromosomal domains surrounding centromeres, called pericentromeres1-6. Here we report the three-dimensional structure of pericentromeres in budding yeast (Saccharomyces cerevisiae) and establish the relationship between genome organization and function. We find that convergent genes mark pericentromere borders and, together with core centromeres, define their structure and function by positioning cohesin. Centromeres load cohesin, and convergent genes at pericentromere borders trap it. Each side of the pericentromere is organized into a looped conformation, with border convergent genes at the base. Microtubule attachment extends a single pericentromere loop, size-limited by convergent genes at its borders. Reorienting genes at borders into a tandem configuration repositions cohesin, enlarges the pericentromere and impairs chromosome biorientation during mitosis. Thus, the linear arrangement of transcriptional units together with targeted cohesin loading shapes pericentromeres into a structure that is competent for chromosome segregation. Our results reveal the architecture of the chromosomal region within which kinetochores are embedded, as well as the restructuring caused by microtubule attachment. Furthermore, we establish a direct, causal relationship between the three-dimensional genome organization of a specific chromosomal domain and cellular function.


Conflict of interest statement

Competing interests The authors declare no competing interests.

Figures

Extended Data Fig. 1
Extended Data Fig. 1. Tension-dependent cohesin removal at metaphase is restricted to the pericentromere and occurs independently of Wpl1/Rad61.
a, Scc1-6HA calibrated ChIP-Seq profiles for the pericentromeric region of chromosome IV are shown for rad61Δ cells arrested in metaphase, in the absence and presence of spindle tension (n=1). b, Mean calibrated ChIP reads (solid line), standard error (dark shading) and 95% confidence interval (light shading) at a pericentromere-proximal cohesin site on each chromosome arm (n=32 sites) for wild type and chl4Δ, either in the presence or absence of tension.
Extended Data Fig. 2
Extended Data Fig. 2. Overview of border gene organization and pericentromere size.
a, Schematic shows the positions of convergent gene pairs flanking centromeres. Grey ovals represent the centromere, convergent gene pairs at the borders are indicated by arrows. b, Genomic distance between the 3’ ends of convergent genes at borders, as well as 3’ and 5’ ends of the two genes transcribed towards centromeres, indicated by grey lines between arrows that denote genes (n=49). Centre line, median; box limits, second and third quartile; whiskers, first and fourth quartile. c, Table of convergent genes identified at pericentromere borders for each chromosome, along with the corresponding pericentromere size. Borders were defined as the innermost cohesin peak near the centromere that persisted in the presence of tension. d, Pericentromere size determined in c plotted against chromosome size. e, Percentage of genes essential for growth on rich glucose media among genes at borders and among all genes. f, Scc1 ChIP-Seq in asynchronous Candida glabrata cells, showing chromosome F from.
Extended Data Fig. 3
Extended Data Fig. 3. An ectopic centromere establishes new borders at convergent genes on a chromosome arm.
Cohesin (Scc1) ChIP-Seq profiles for the region surrounding the endogenous centromere on chromosome III (left panel) and for a ~50 kb region of chromosome III surrounding the neo-centromeric arm site (right panel) are shown (n=1). Regions of tension-insensitive cohesin peaks at convergent sites flanking the endogenous and ectopic centromeres are highlighted.
Extended Data Fig. 4
Extended Data Fig. 4. Shugoshin and condensin localise to pericentromere borders.
a, Representative cohesin (Scc1), shugoshin (Sgo1) and condensin (Brn1) enrichment in metaphase-arrested cells in the presence of nocodazole in the pericentromeric region of chromosome IV (n=2, immunoprecipitation was performed using proteins tagged with different epitopes in the two biological replicates). b, Plots show median calibrated ChIP reads (solid line), standard error (dark shading) and 95% confidence interval (light shading) at all 32 borders and 16 centromeres. For comparison, similar plots for the next convergent gene site on each chromosome arm are shown. c-d, Condensin associates with pericentromere borders in a Sgo1-dependent manner in cells arrested in metaphase in the absence of tension. c, ChIP-Seq data used was previously published in. Median condensin (Brn1) signal across a 50kb region surrounding all 16 centromeres. d, Mean Brn1 signal centred around all 32 borders (left panel) or 16 centromeres (right panel). Sgo1 is removed from the borders, but not core centromeres, in response to spindle tension (solid line – median, dark shading – standard error, light shading – 95% confidence interval). e, Median Sgo1 enrichment by ChIP-Seq plotted over a 50kb region surrounding all 16 centromeres in metaphase-arrested cells in the presence or absence of tension. f, Mean Sgo1 signal centred around all 32 borders (left panel) or 16 centromeres (right panel) (solid line – median, dark shading – standard error, light shading – 95% confidence interval).
Extended Data Fig. 5
Extended Data Fig. 5. Pericentromere borders resist sister chromatid separation under tension.
a, Assay to measure separation of loci on sister chromatids in metaphase arrested cells. Cells carry tetO/TetR-GFP foci integrated at various positions, Spc42-tdTomato foci to mark spindle pole bodies and are arrested in metaphase by Cdc20 depletion. Left schematic shows expected separation of GFP foci positioned inside and outside pericentromere loci. Green dots, tetO/TetR-GFP foci, Red dots, spindle pole bodies. Representative image is shown to the right (n=3 biological replicates). White and black arrows mark cells with a single GFP focus or split foci, respectively. b, Position of GFP foci and corresponding calibrated Scc1-6HA ChIP-Seq profiles (n=3) are shown for chromosome I and III. c, Cells carrying tetO/TetR-GFP foci integrated at various positions were arrested in metaphase and distance between GFP dots were measured in 100 cells. Horizontal lines indicate mean.
Extended Data Fig. 6
Extended Data Fig. 6. C-looping and alternative model for pericentromeric chromosome conformation adapted from.
a, Pile-ups (bin size 1kb) of cis contacts 100 kb surrounding all 16 centromeres for wild type and chl4Δ cells in the absence or presence of spindle tension. b, Pile-ups of cis contacts 100kb surrounding centromeres (left panel), ratio of expected/observed signal (second panel), pericentromere pile-up (third panel, 10kb surrounding centromeres) and its ratio of expected/observed signal (right panel) is shown for wild type cells in the absence of spindle tension (n=16). c, Model for centromere-flanking pericentromeric chromatin forming an intramolecular loop in which cohesin bridges the two sides of the pericentromere flanking the centromere, whereas chromosome arms are paired intermolecularly between sister chromatids, resulting in a cruciform chromosome conformation.
Extended Data Fig. 7
Extended Data Fig. 7. Changes in pericentromere structure on individual chromosomes in response to tension and in the absence of pericentromeric cohesin.
Hi-C contact maps (1kb bin) over a 50kb region surrounding all centromeres in wild type (left panels) cells without tension (bottom half of heatmap) and with tension (top half of heatmap), and in chl4Δ (middle panels) without tension (bottom half) and with tension (top half) (n=1). Right panels show log2 ratio between wild type and chl4Δ, without tension (bottom half) and with tension (top half). The extent of the pericentromere for each chromosome is marked by black bars on top of the contact maps.
Extended Data Fig. 8
Extended Data Fig. 8. Pericentromere structure depends on pericentromeric cohesin rather than condensin.
Hi-C analysis of sgo1-3A and sgo1Δ in metaphase-arrested cells in the absence of tension reveals similar patterns to wild type. Data for wild type was reproduced from Fig. 3a for comparison. a, Pile-ups (bin size 1kb) of cis contacts surrounding all 16 centromeres in absence of spindle tension for the indicated strains (left three panels) or log2 ratio maps between wild type and sgo1-3A or sgo1Δ (right two panels) detect little change. b, Pile-ups (bin size 1kb) and log2 ratio maps of cis contacts surrounding all 32 borders. c, Log2 ratio between 25 kb pile-ups centered on the centromere in wild type and chl4Δ cells, in the absence (left) and presence (right) of tension (n=16).
Extended Data Fig. 9
Extended Data Fig. 9. Transcription at pericentromere borders influences cohesin position.
a, Genes at pericentromere borders are moderately transcribed on average. Relative RNA density for convergent border gene pairs compared to all genes is shown for no tension and tension conditions (n=1). RNA-Seq for wild type cells arrested in metaphase in the presence or absence of tension. Dashed lines indicate mean, dotted line mark 95% confidence interval. b, Boxplot of transcription levels of genes at pericentromere borders based on RNA polymerase II (Rpo21) Cross-linking and analysis of cDNA (CRAC) from. Rpo21 CRAC sense read counts of genes at borders were normalized to the protein coding gene average and genes at pericentromere borders were grouped by their relative orientation to centromeres. Data points correspond to the mean of three biological repeats. Centre line, median; box limits, second and third quartile; whiskers, first and fourth quartile (non-normal distribution, Shapiro-Wilk; *, p<0.05, two-sided Mann-Whitney test). c, Boxplot of relative transcription levels of genes transcribed towards and away from centromeres, at pericentromere borders and at non-border convergent genes inside pericentromeres as in b. d, e, Insertion of a URA3 cassette between a convergent gene pair shifts the localization of cohesin in the direction of transcription. URA3 was integrated in either orientation between the convergent gene pairs at the left pericentromere border on chromosome IV and cohesin (Scc1) ChIP-qPCR (n=3, bars show mean ±s.e.m.) using primers at the indicated positions (d) and ChIP-Seq (n=1) (e) was performed.
Extended Data Fig. 10
Extended Data Fig. 10. Gene reorientation at borders impacts pericentromeric protein localization, sister chromatid separation and chromosome conformation.
a, Cohesin (Scc1), shugoshin (Sgo1) and condensin (Brn1) enrichment in metaphase-arrested cells in the presence of nocodazole in the pericentromeric region of wild type and reoriented chromosome IV is shown (n=2, immunoprecipitation was performed using proteins tagged with different epitopes in the two replicates). Asterisks indicate new peaks in reoriented strain. b, Distance between GFP foci does not change following gene reorientation. 100 cells were measured, horizontal lines indicate mean. c, The region of separation upon gene reorientation does not extend beyond the next convergent gene pair. Strains with tetO arrays integrated at the indicated positions were arrested in metaphase and the percentage of cells with 2 GFP foci was determined. For each biological replicate (data points, n=3), 200 cells were scored, data are mean ±s.e.m. d, Pile-up of cis contacts across all 16 pericentromeres in reoriented strain, in the presence of spindle tension. e, Log2 ratio map of Hi-C signal in pericentromere IV in wild type and reoriented strains (n=1). f, Model for pericentromere expansion and disorganisation in the absence of convergent genes. g, Schematic of sister kinetochore biorientation following spindle re-polymerisation. Cells carrying the indicated chromosomal GFP labels, Spc42-tdTomato and pMET-CDC20 were released from G1 into a metaphase arrest by depletion of Cdc20 in the presence of nocodazole. Nocadazole was washed out while maintaining metaphase arrest and the percentage of cells with 2 GFP foci was scored over time.
Fig. 1
Fig. 1. Convergent genes mark pericentromere borders.
Representative cohesin (Scc1) enrichment in wild type (n=3) (a) and chl4Δ (n=2) (b), arrested in metaphase in no tension or tension condition. Pericentromere borders are shaded in grey, black and white arrows indicate convergent genes at borders, asterisk indicates additional cohesin peak under tension. c, Mean calibrated ChIP-Seq reads (solid line), standard error (dark shading) and 95% confidence interval (light shading) at all 32 borders and 16 centromeres. d, Separation of tetO/TetR-GFP markers at indicated distances from CEN1 (left panel) or CEN3 (right panel) in metaphase. For each biological replicate (data points, n=3), 200 cells were scored. Bars show mean ±s.e.m.
Fig. 2
Fig. 2. The pericentromere is a multi-looped structure in mitosis which extends to an open V shape under tension.
Hi-C of wild type and chl4Δ arrested in metaphase. a, b, c, d, Pile-ups (bin size 1kb) of cis contacts 25 kb surrounding all 16 centromeres (left panels), and contact maps for pericentromere IV (right panels) are shown for wild type and chl4Δ in the absence (a, c) or presence (b, d) of tension. Median calibrated Scc1 ChIP-Seq signal around all 16 centromeres, or for chromosome IV is shown above. Arrows denote border convergent genes. e, Pile-ups (1kb bins) of cis contacts (25 kb) surrounding the 32 pericentromere borders are shown.
Fig. 3
Fig. 3. Gene orientation determines pericentromere size.
Border convergent genes on chromosome IV were reversed to tandem orientation (“reoriented”). a, Representative cohesin enrichment in wild type and reoriented strains (n=2). Shading indicates wild type pericentromere border position. Black and white arrows in schematics indicate genes transcribed towards and away from the centromere, respectively. b, Separation of tetO/TetR-GFP markers at the indicated positions in metaphase. c, Separation of tetO/TetR-GFP markers after insertion of two short model genes downstream of the first border genes on both sides of pericentromere IV, in wild type and reoriented strains. In b and c, for each biological replicate (data points, n=3), 200 cells were scored. Bars show mean ±s.e.m.; unpaired two-tailed t-test, * p<0.05, ns p>0.05. d, Hi-C maps of pericentromere IV (n=1).
Fig. 4
Fig. 4. Gene orientation affects biorientation efficiency and cell viability.
a, Sister kinetochore biorientation following spindle reassembly. Percentage of cells with separated GFP foci (n=200 at each timepoint), mean of 3 biological replicates ±s.e.m. is shown; unpaired two-tailed t-test, * p<0.05. b, Biorientation time (from SPB separation until centromere-linked GFP dot splitting) in live cells. Centre line, median; box limits, second and third quartile; whiskers, first and fourth quartiles for 120 cells split equally across two biological replicates; two-sided Mann-Whitney test, *, p<0.05. c, Categorization of 500 cells based on morphology and GFP foci number following partial ipl1-321 inactivation. Data show mean of 3 biological replicates ±s.e.m.; unpaired two-tailed t-test, * p<0.05. d, Cell viability following nocodazole treatment after plating 1,000 cells at each timepoint. Data are mean of 3 biological replicates ±s.e.m.; unpaired two-tailed t-test, *, p<0.05 (p-values refer to wild type ipl1-321 vs. reoriented ipl1-321). e, Model of pericentromere structure. Cohesin loaded at kinetochores extrudes a chromatin loop on either side of the centromere until halted by convergent genes at pericentromere borders. When biorientation extends pericentromeric chromatin outwards, intra-sister chromatid cohesin at the base of loops is passively removed from chromosomes, while inter-sister chromatid cohesin is trapped at borders, converting centromere-flanking cis-loops to a V-shaped structure.

References

    1. Rowley MJ, Corces VG. Organizational principles of 3D genome architecture. Nature reviews. 2018;19:789–800. - PMC - PubMed
    1. Ng TM, Waples WG, Lavoie BD, Biggins S. Pericentromeric sister chromatid cohesion promotes kinetochore biorientation. Mol Biol Cell. 2009;20:3818–3827. - PMC - PubMed
    1. Weber SA, et al. The kinetochore is an enhancer of pericentric cohesin binding. PLoS biology. 2004;2:E260. - PMC - PubMed
    1. Fernius J, et al. Cohesin-dependent association of scc2/4 with the centromere initiates pericentromeric cohesion establishment. Curr Biol. 2013;23:599–606. - PMC - PubMed
    1. Fernius J, Marston AL. Establishment of cohesion at the pericentromere by the Ctf19 kinetochore subcomplex and the replication fork-associated factor, Csm3. PLoS Genet. 2009;5:e1000629. - PMC - PubMed

Publication types

Substances