. 2020 Jun;582(7810):115-118.
doi: 10.1038/s41586-020-2232-x. Epub 2020 Apr 29.

LEM2 phase separation promotes ESCRT-mediated nuclear envelope reformation

Affiliations

LEM2 phase separation promotes ESCRT-mediated nuclear envelope reformation

Alexander von Appen et al. Nature. 2020 Jun.

Abstract

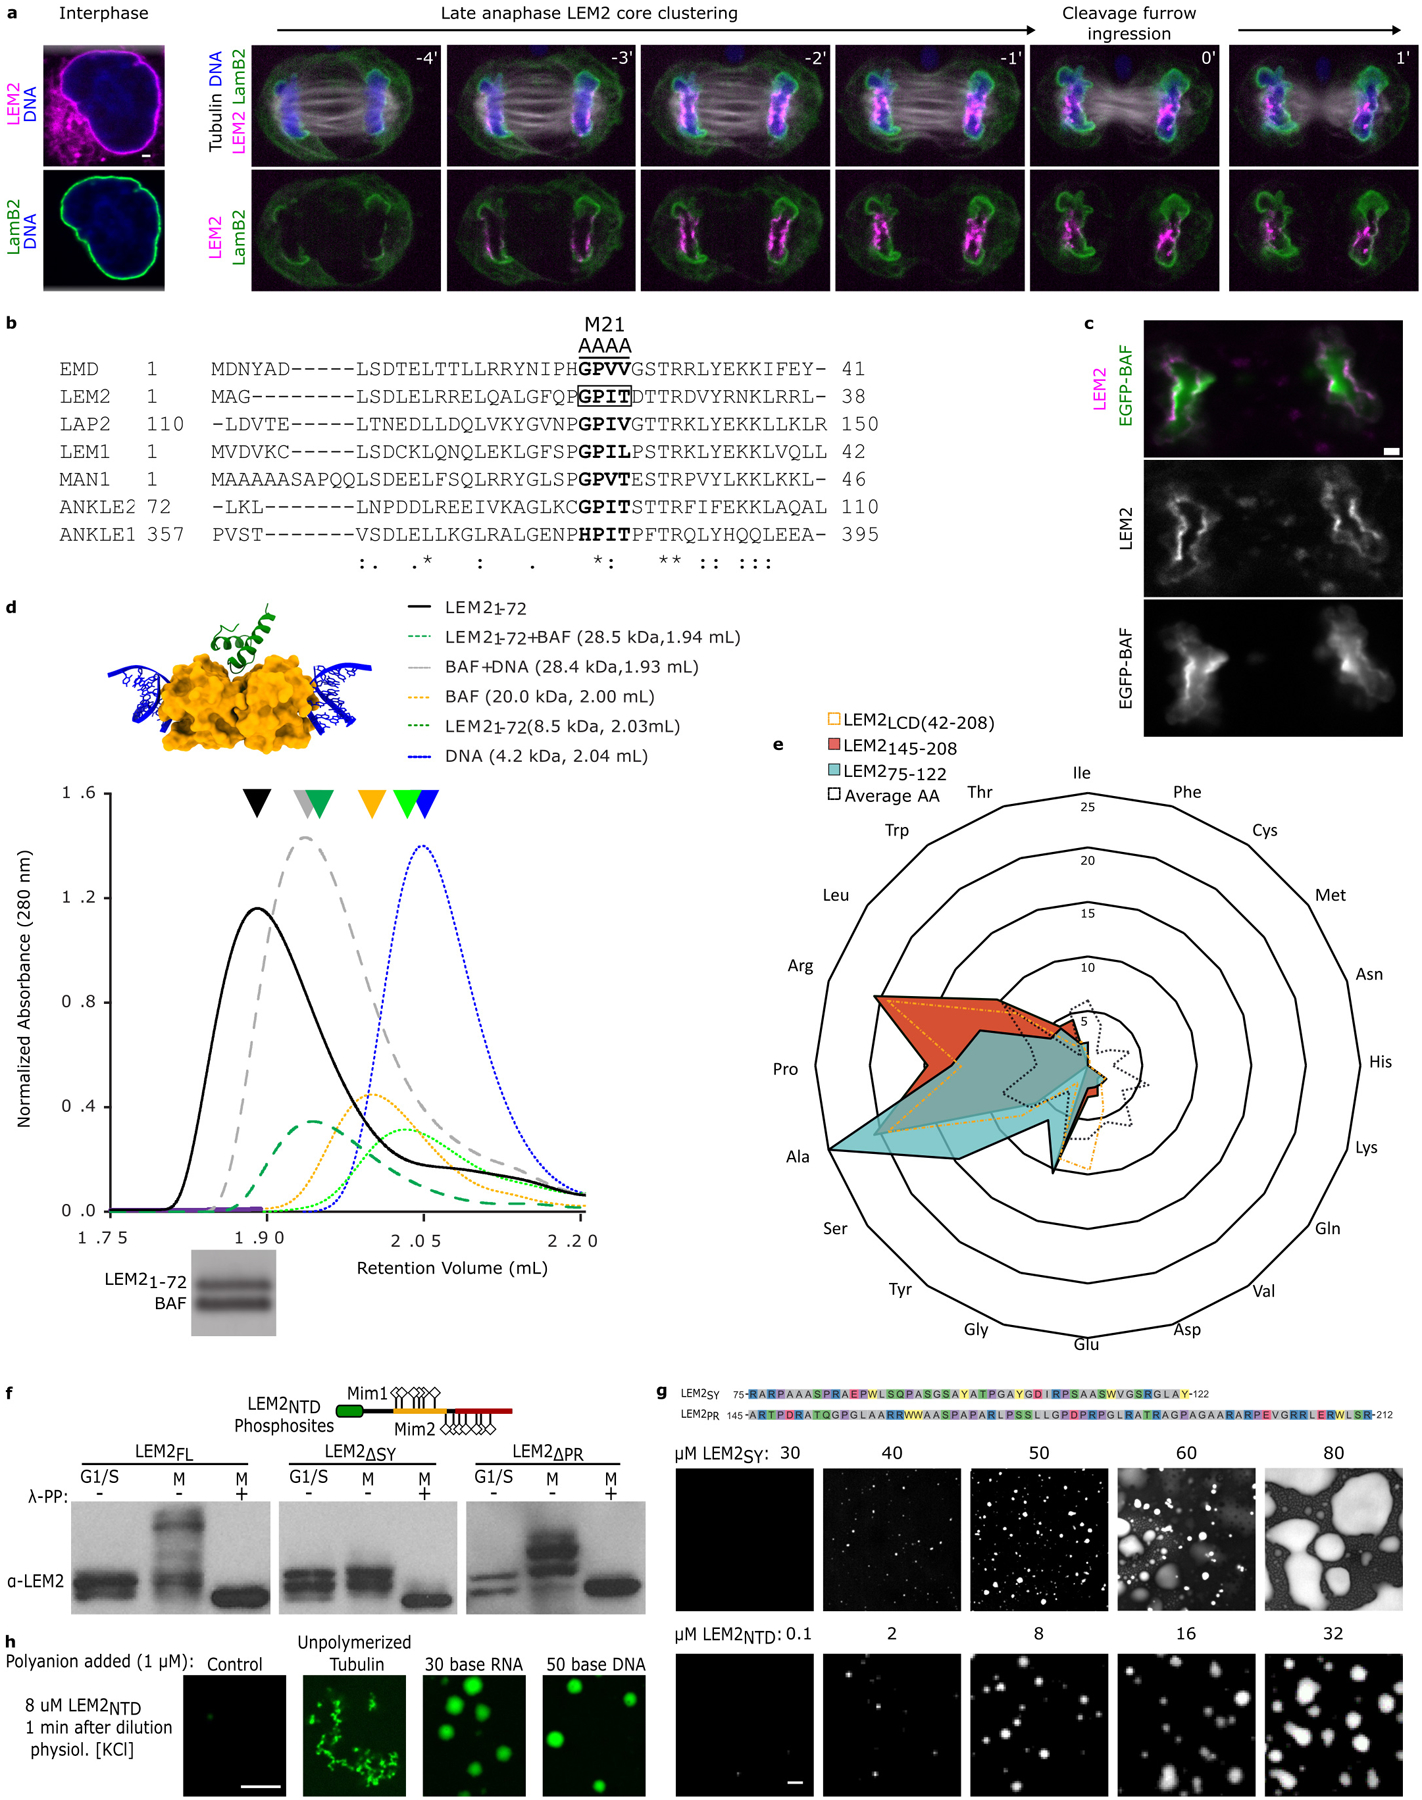
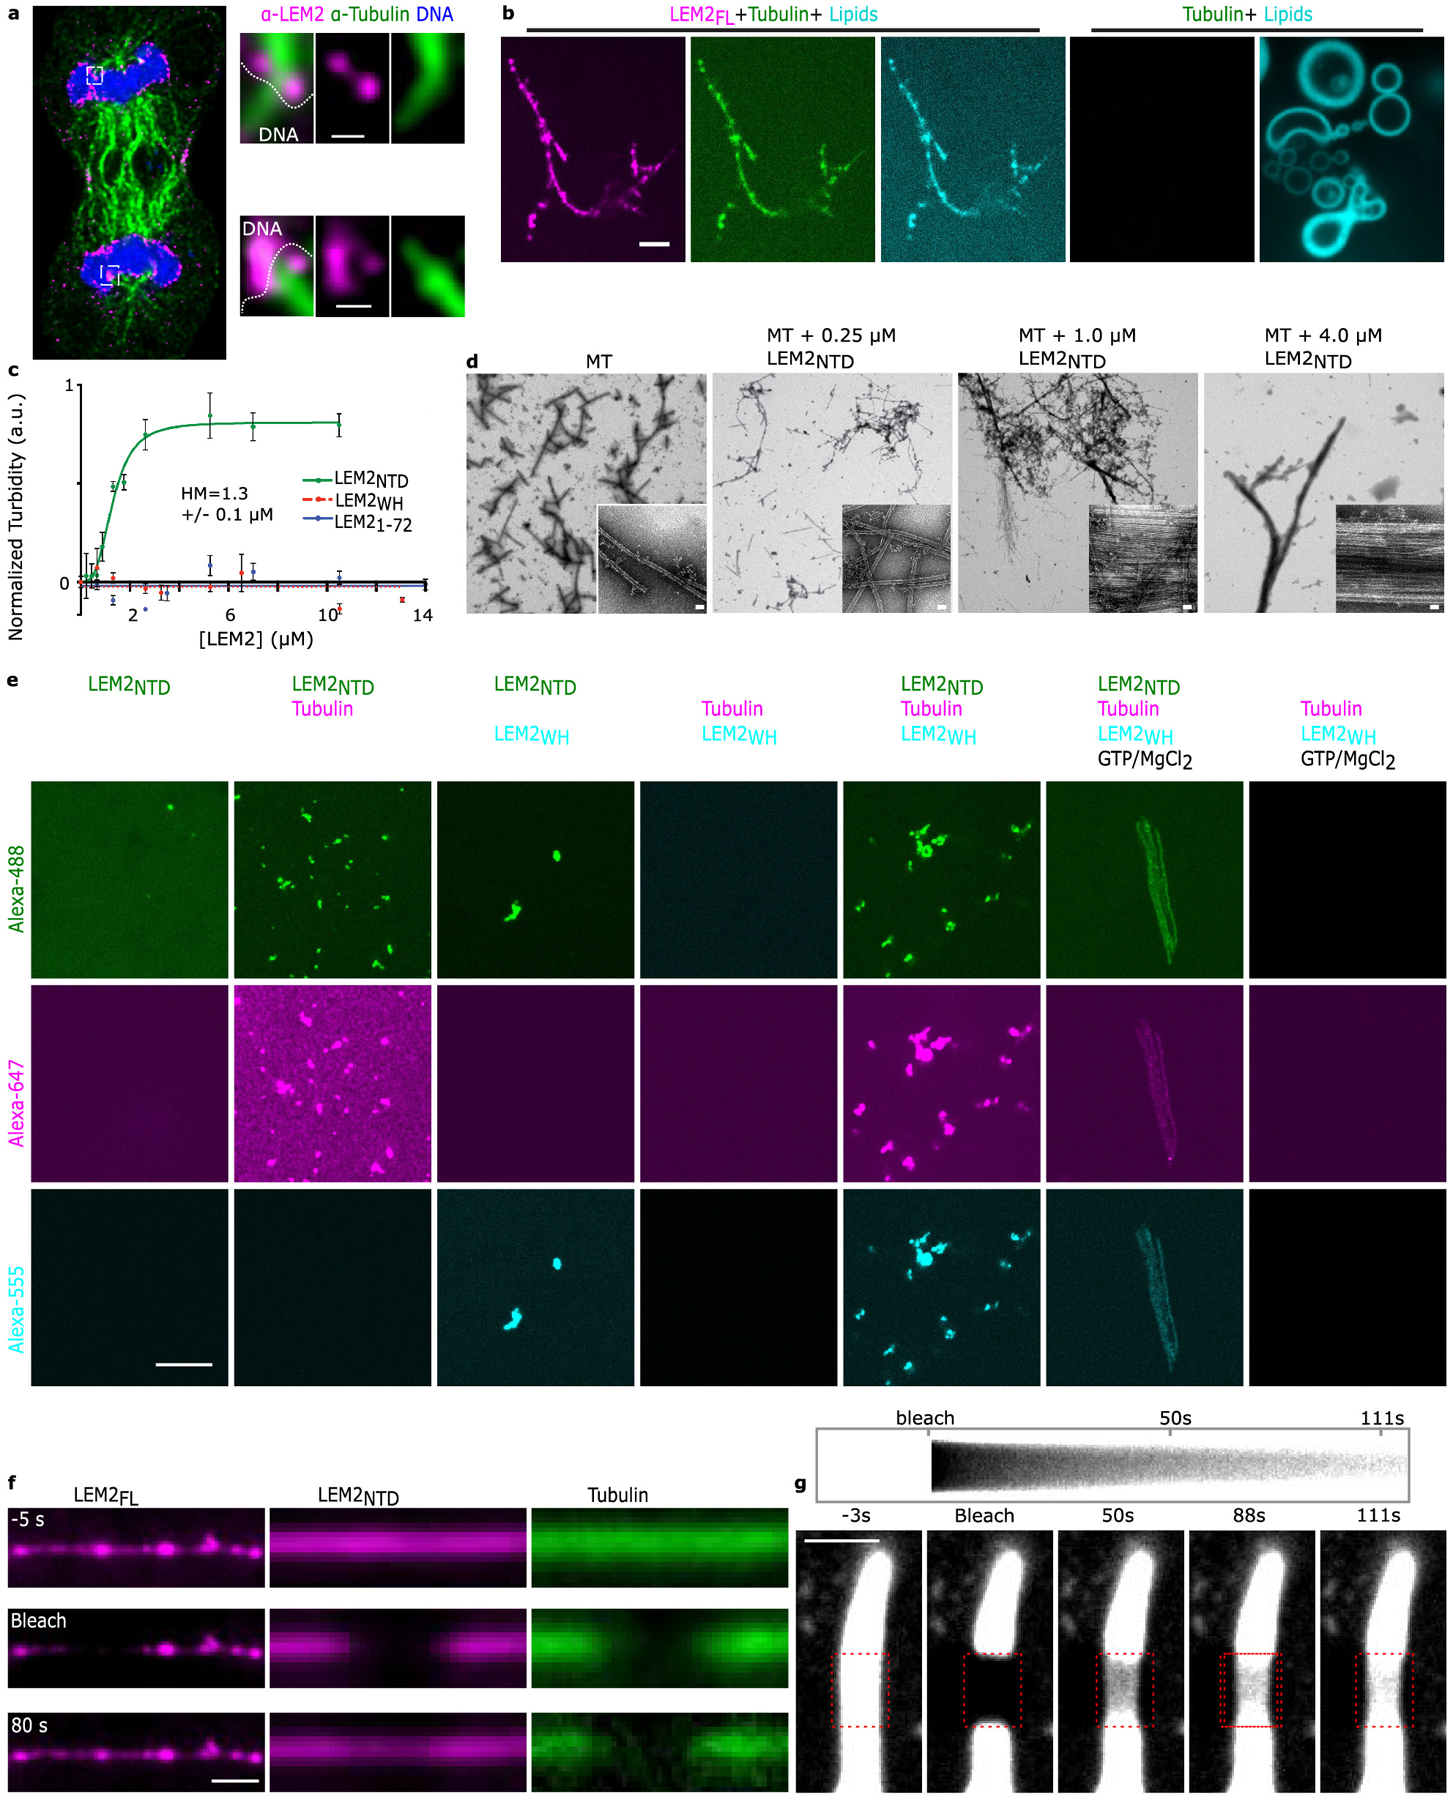
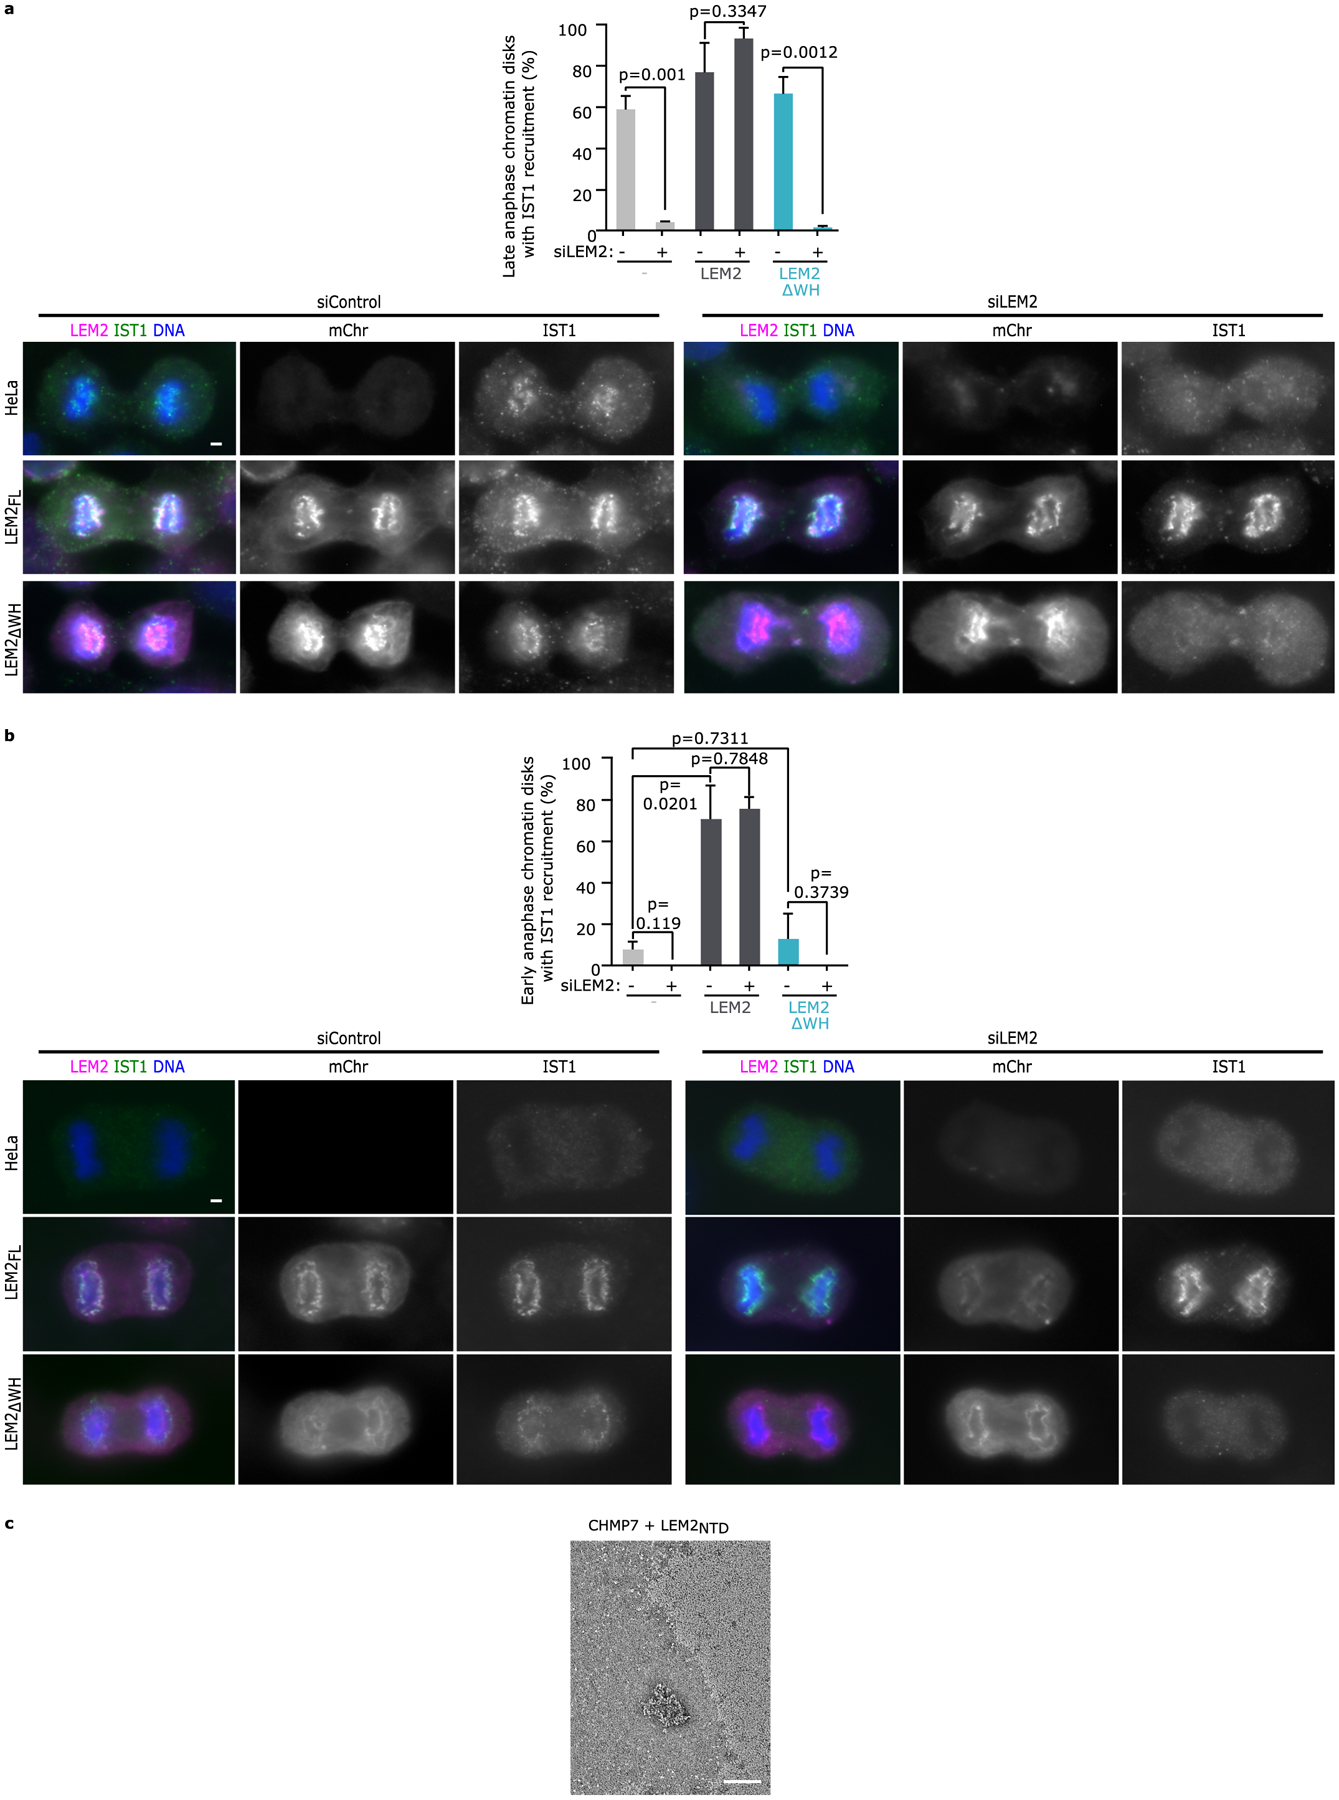
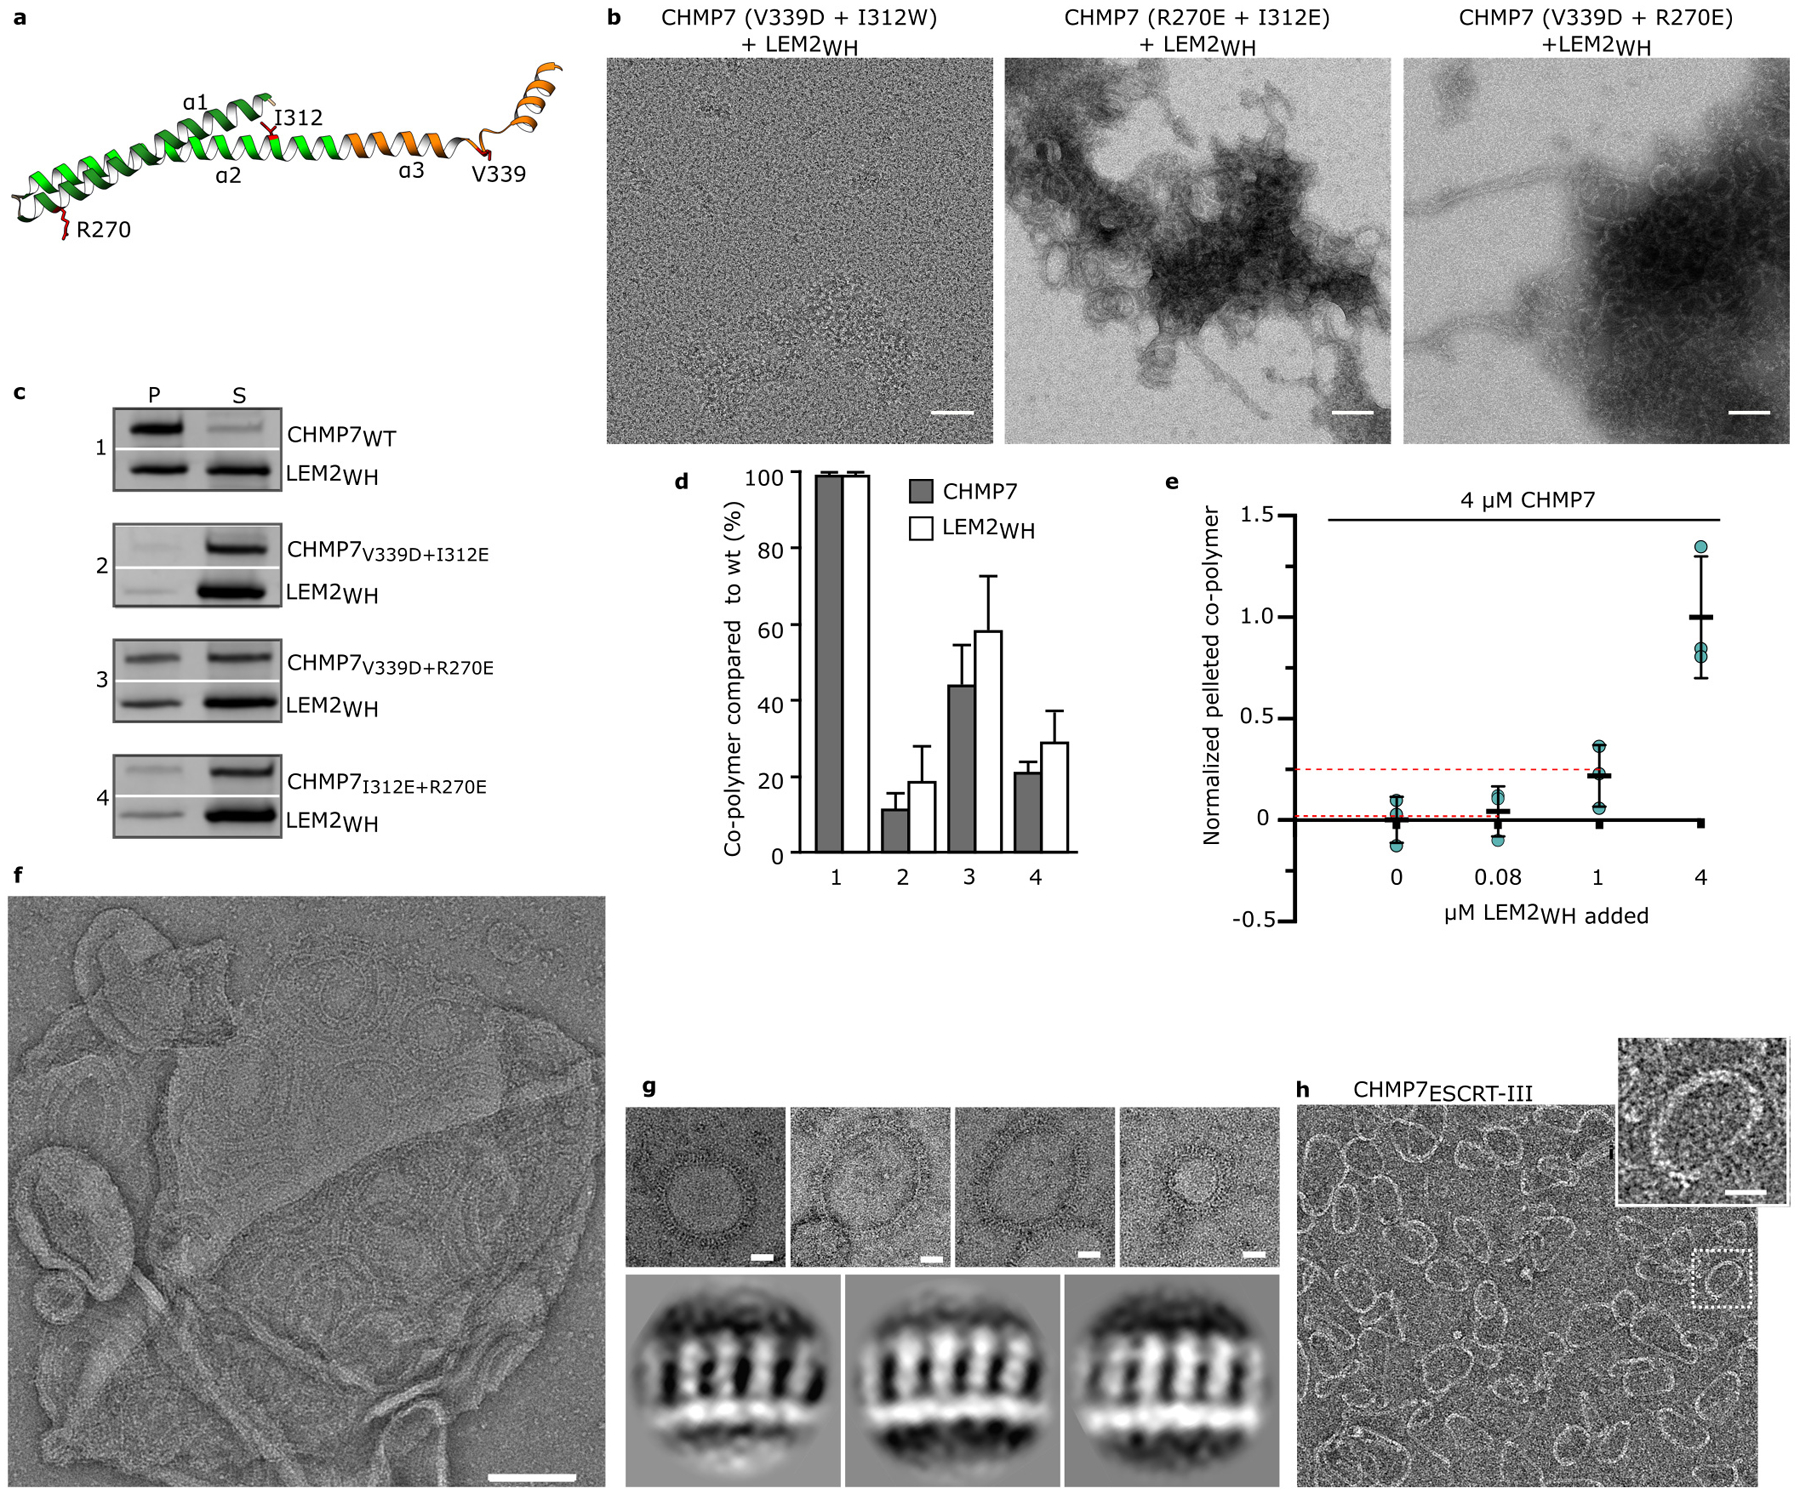
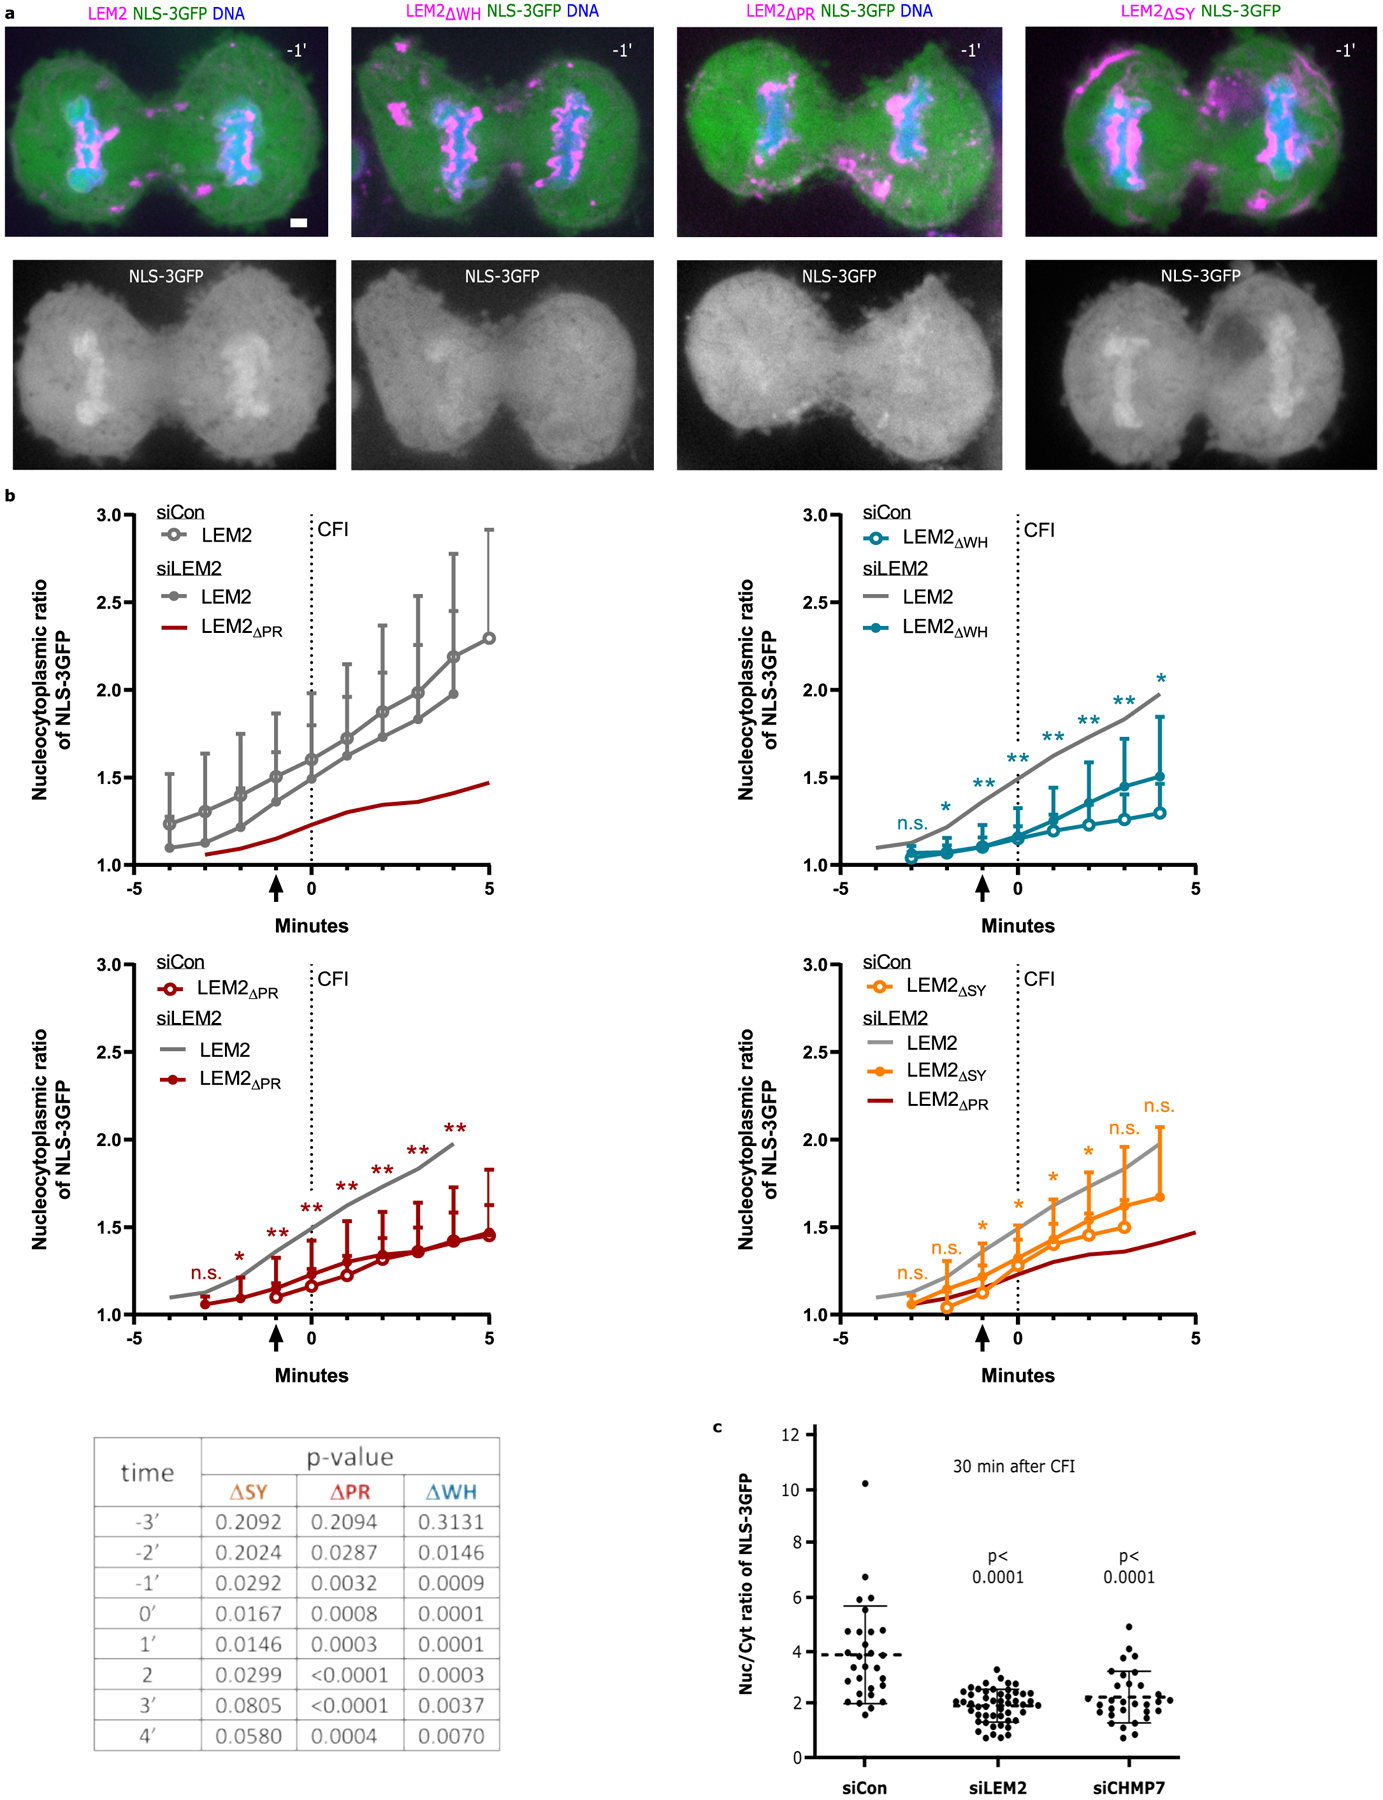
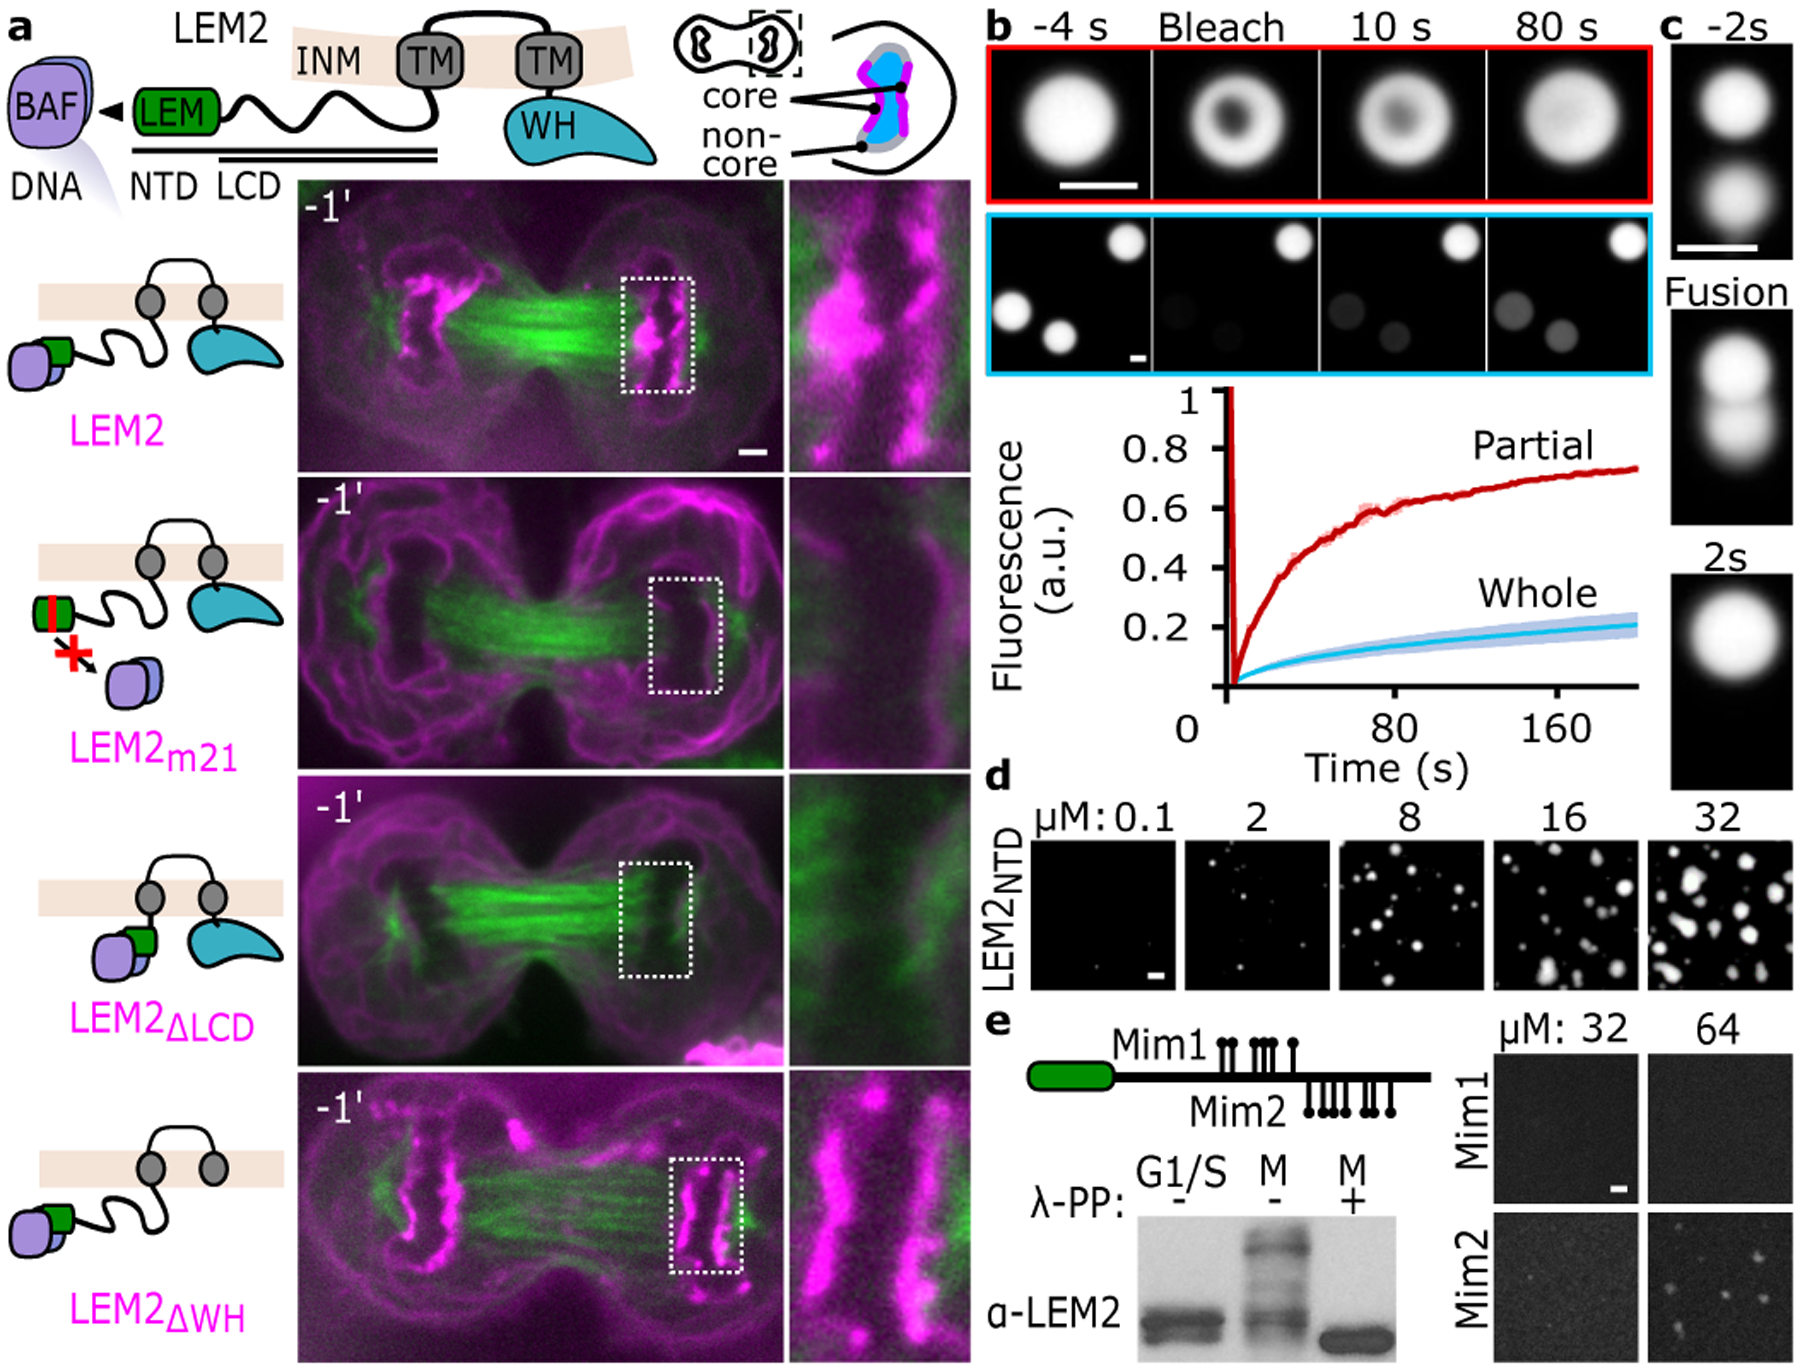
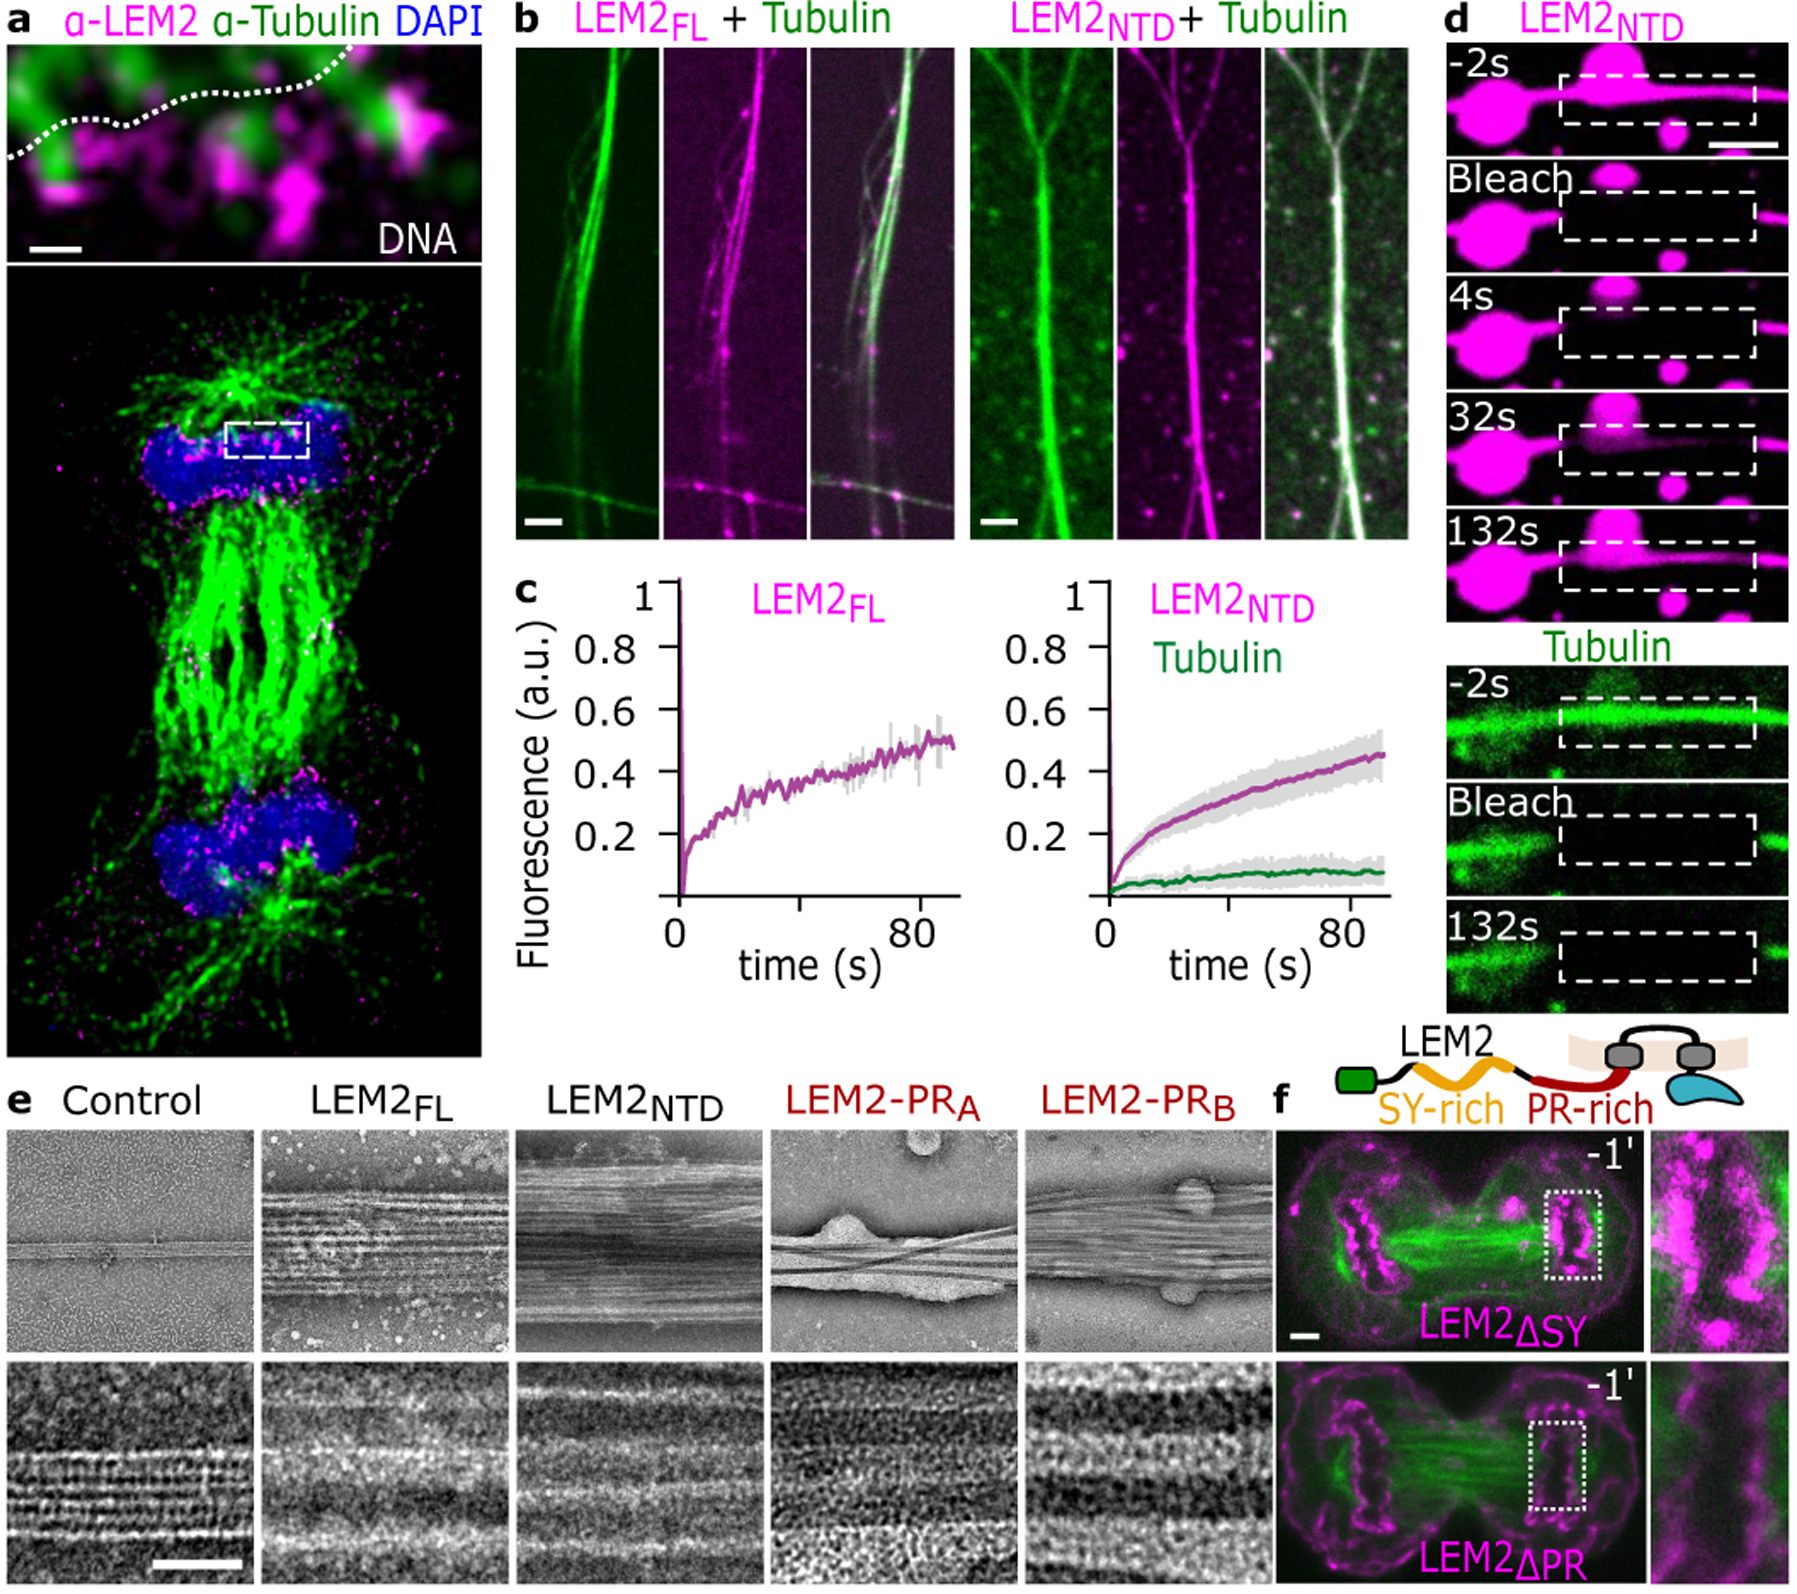
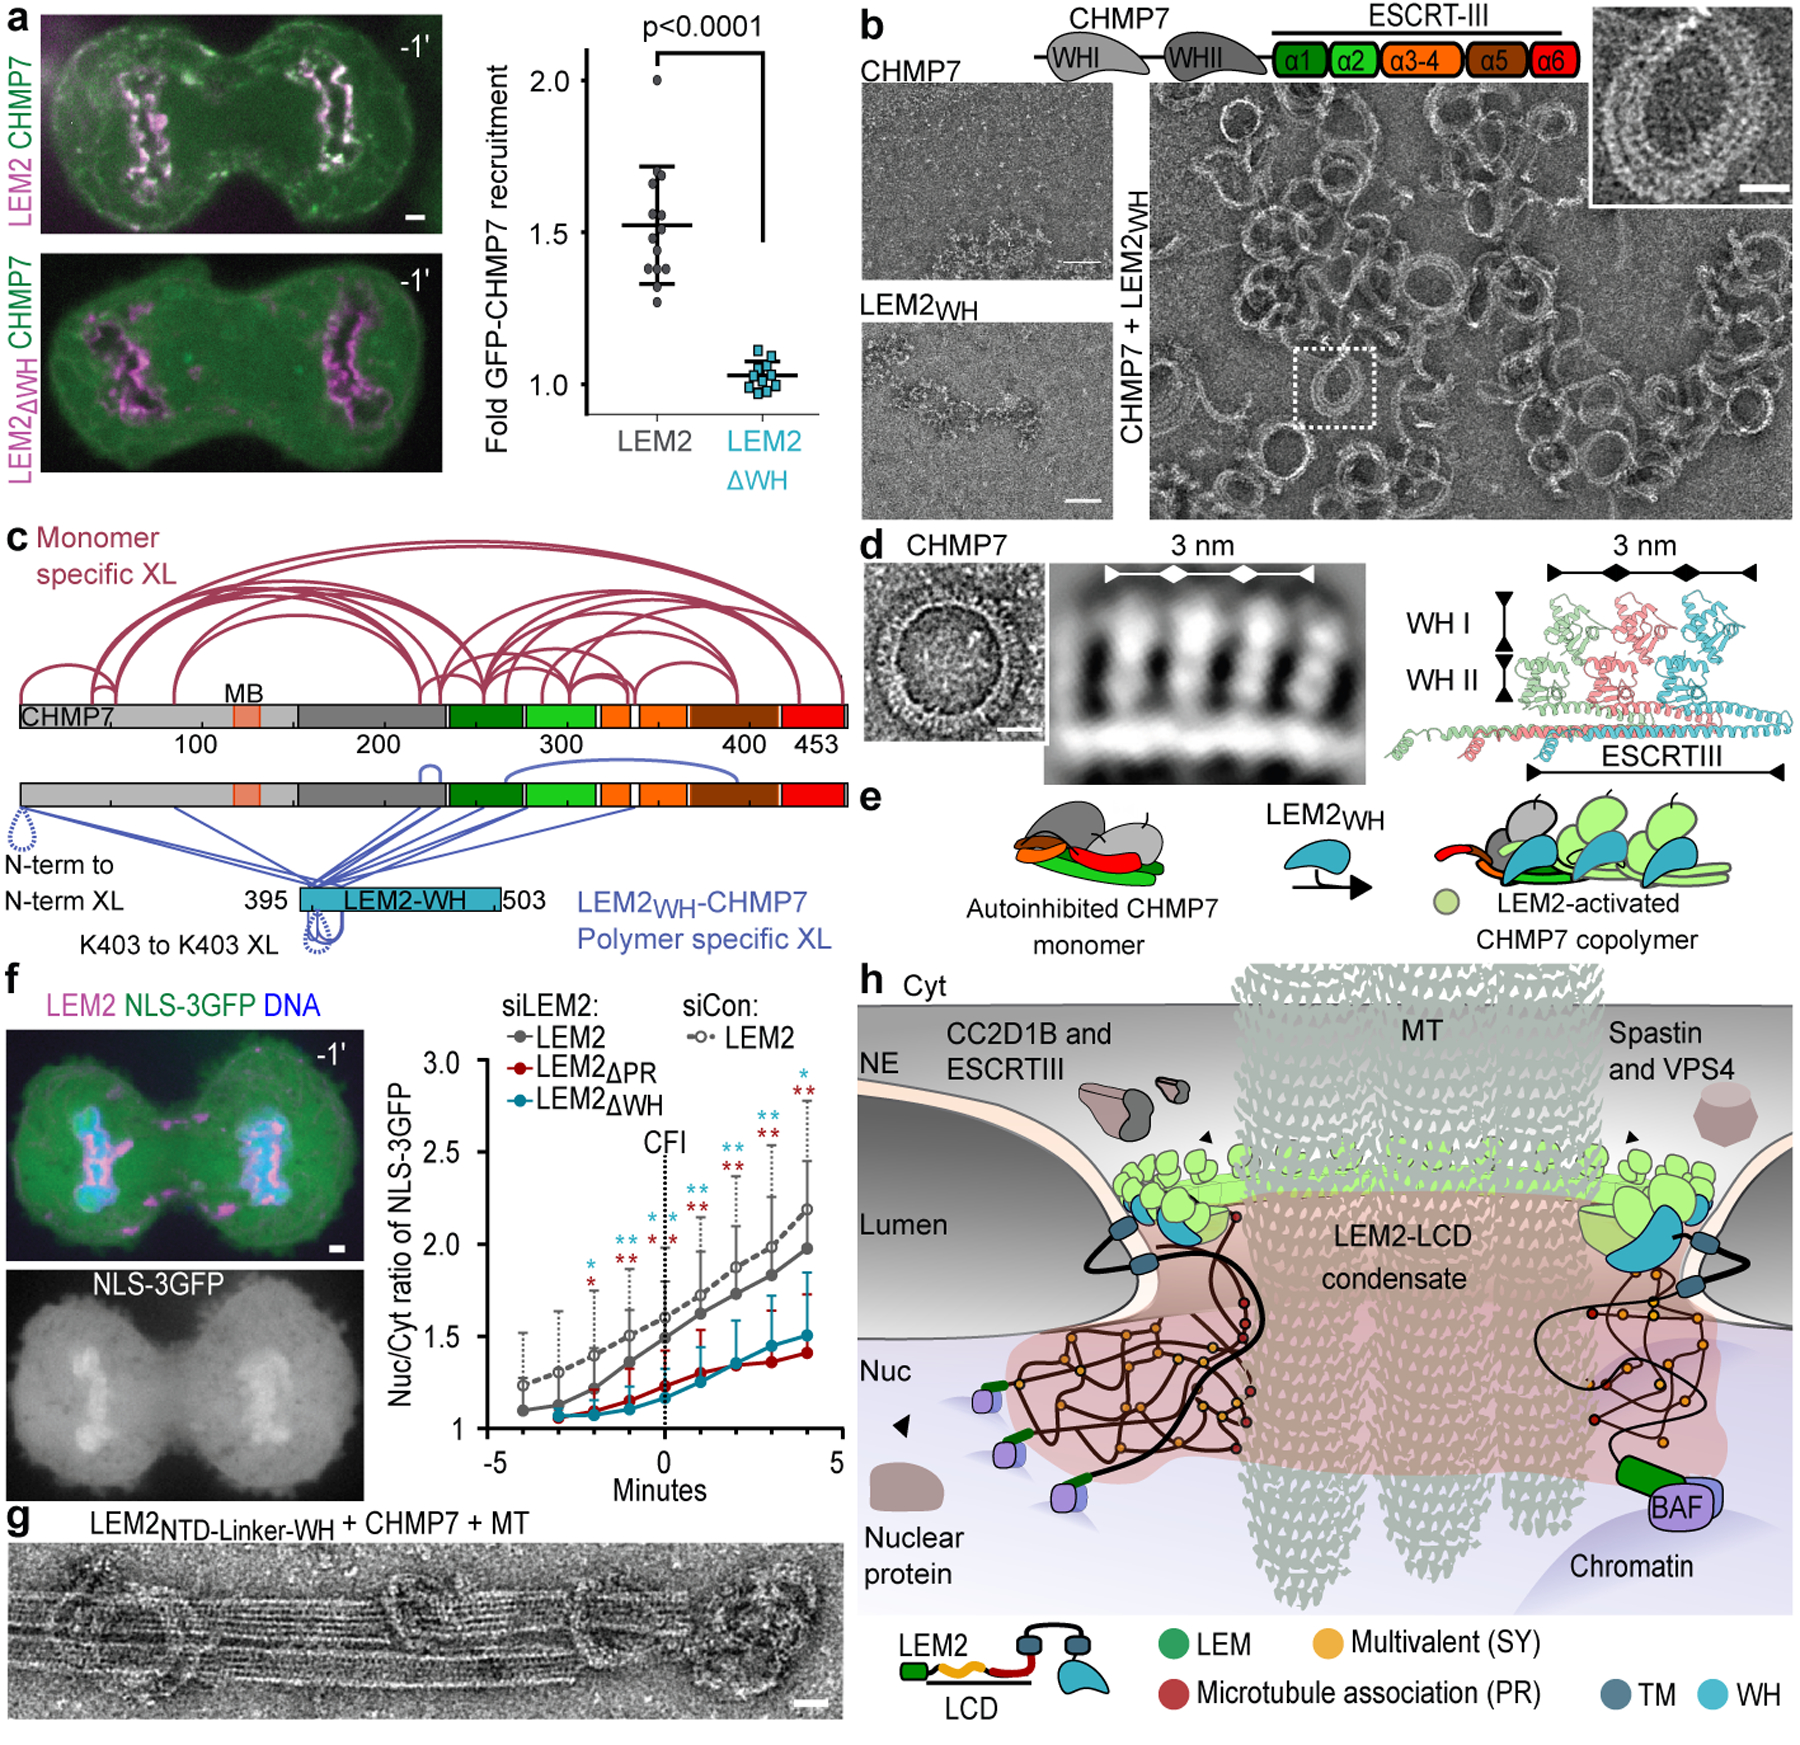
During cell division, remodelling of the nuclear envelope enables chromosome segregation by the mitotic spindle1. The reformation of sealed nuclei requires ESCRTs (endosomal sorting complexes required for transport) and LEM2, a transmembrane ESCRT adaptor2-4. Here we show how the ability of LEM2 to condense on microtubules governs the activation of ESCRTs and coordinated spindle disassembly. The LEM motif of LEM2 binds BAF, conferring on LEM2 an affinity for chromatin5,6, while an adjacent low-complexity domain (LCD) promotes LEM2 phase separation. A proline-arginine-rich sequence within the LCD binds to microtubules and targets condensation of LEM2 to spindle microtubules that traverse the nascent nuclear envelope. Furthermore, the winged-helix domain of LEM2 activates the ESCRT-II/ESCRT-III hybrid protein CHMP7 to form co-oligomeric rings. Disruption of these events in human cells prevented the recruitment of downstream ESCRTs, compromised spindle disassembly, and led to defects in nuclear integrity and DNA damage. We propose that during nuclear reassembly LEM2 condenses into a liquid-like phase and coassembles with CHMP7 to form a macromolecular O-ring seal at the confluence between membranes, chromatin and the spindle. The properties of LEM2 described here, and the homologous architectures of related inner nuclear membrane proteins7,8, suggest that phase separation may contribute to other critical envelope functions, including interphase repair8-13 and chromatin organization14-17.


Conflict of interest statement

Competing interests: The authors declare no conflict of interest.

Figures

Extended Data Fig. 1 |
Extended Data Fig. 1 |. The N-terminus of LEM2 possesses a canonical BAF-binding LEM domain and a low complexity domain (LCD).
a, Live-cell imaging of GFP-Lamin B2 and LEM2-mChr; DNA is stained with NucBlue and tubulin detected with SiR-tubulin. Time 0 refers to complete cleavage furrow ingression. Representative of 10 or more cells imaged across at least 3 biological replicates. b, Multiple sequence alignment of LEM domains across LEM family proteins, highlighting a conserved four-amino acid sequence that, when mutated in Emerin (EMDm24), disrupts BAF binding. The position of an analogous mutation in LEM2 (LEM2m21) is indicated. Scale bar 2 μm c, HeLa cells stably expressing LEM2-mCherry and EGFP-BAF live-imaged during anaphase. Representative of 10 or more cells imaged across at least 3 biological replicates for both fixed and live-cell imaging. Scale 10 μm. d, Top: A homology model for LEM21–72 -BAF-DNA complex, based on PDB:2BZF and PDB:2ODG,. Middle: Absorbance at 280 nm as a function of retention volume (mL) from analytical size exclusion chromatography. Retention volumes for major peaks (arrowheads) and predicted molecular weights for protein or protein-DNA complexes are listed. Bottom: SDS-PAGE of major peak for LEM21–72+BAF+DNA sample. Representative of 3 technical replicates. For gel source data, see Supplementary Fig. 1. e, LEM2’s LCD percent amino acid composition, and the compositions of two subregions, compared to an average amino acid composition. f, Schematic of LEMNTD with amino acid substitutions (S, T, or Y to D) relative to SY-rich (yellow) and PR-rich (rust) regions, in LEM2NTD Mim1 and Mim2 constructs. LEM2 immunoblot assessing the migration pattern of full length, also shown in Fig. 1e, and mutant LEM2-mChr constructs following separation by Phos-tag SDS-PAGE. Cell lysates were prepared from G1/S- and prometaphase- arrested cells expressing the indicated exogenous LEM2; lysates treated with lambda phosphatase (λ-PP) are indicated. Representative data from 2 biological replicates, with 1 and 3 technical replicates per biological replicate. For immunoblot source data, see Supplementary Fig. 1. g, Amino acid sequence of the peptide corresponding to LEM2’s SY-rich and PR-rich regions. Concentration-dependent droplet formation by the LEM2SY peptide, juxtaposed with similar data collected for full LEM2NTD as in Fig 1d. Representative of 3 technical replicates. h, Fluorescence microscopy of purified LEM2NTD with indicated molecular anions. Image representative of 2 technical replicates. Scale 2 μm.
Extended Data Fig. 2 |
Extended Data Fig. 2 |. LEM2 wets the surface of microtubules with a liquid-like coat.
a, Additional example of STED imaging of endogenous LEM2 localization during late anaphase. Scale 150 nm. Representative of data from 4 cells. b, Fluorescence imaging of indicated combinations of LEM2FL-Alexa488 (magenta), Tubulin-Alexa647 (green), and lipids labeled with PE-rhodamine (cyan). Scale 2 μm. Representative of 2 technical replicates. c, Light scattering at 340 nm (turbidity) of MT bundling by indicated LEM2 constructs. Half maximal concentration of LEM2NTD is 1.303 μM +/− 0.1 μM. Quantification of mean +/− SEM for n=3 independent samples. d, Negative stain EM of MTs alone or MTs with indicated concentrations of LEM2NTD, corresponding to the concentrations measured by light scattering. Images representative of at least 6, scale 25 nm. e, Fluorescence microscopy of LEM2NTD Alexa488 in combination with Tubulin-Alexa647, LEM2WH-Alexa555, and GTP/MgCl2, as indicated. Scale 10 μm. Images are representative of at least 3. f, Example images for FRAP of LEM2FL- and LEM2NTD-coated MT bundles, representative of 5 independent samples (LEM2FL) or 17 independent samples (LEM2NTD). g, Top: Kymograph across bleached region. Bottom: FRAP of LEM2NTD-coated MT bundle. Images show fluorescent LEM2NTD channel. Scale 2 μm. Representative of 8 technical replicates.
Extended Data Fig. 3 |
Extended Data Fig. 3 |. LEM2-LCD bundles microtubules in vitro through a regulated MT-binding domain.
a, Amino acid sequences of 6 LEM2 peptides tiling the LCD. LEM2145–165 is LEM2-PRA, and LEM2188–212 is LEM2-PRB. b, Light scattering at 340 nm (turbidity) of MT bundling by indicated LEM2 peptides. Half maximal concentration of LEM2188–212 (LEM2-PRB) equals 85.11 μM. For LEM2188–212, data plotted are mean +/− SEM for n=3 technical replicates. LEM240–60, LEM261–81, LEM2123–144, LEM2166–187, did not bundle. c, Negative stain EM of MTs alone or MTs with indicated concentrations of LEM2188–212, corresponding to turbidity reactions. Scale 25 nm. For each condition, images are representatives of 7. d, Live cell imaging of indicated LEM2ΔSY-mChr and LEM2ΔPR-mChr deletion constructs (magenta) and GFP-tubulin (green). Time 0 refers to time of complete cleavage furrow ingression. Scale 2 μm. Images are representative of 3 independent experiments. e, Negative stain EM of MTs co-incubated indicated phosphomimetic proteins. Scale 25 nm. Images are representative of 2 technical replicates. f, Light scattering at 340 nm (turbidity) of MT bundling by phosphomimetic LEM2 constructs. Vertical lines are half max and shading are standard error; LEM2NTD (green) half max 1.303 μM; error 1.144 to 1.493 μM, LEM2Mim1 (red) half max 2.824 μM; error 2.283 to 3.397μM, LEM2Mim2 (blue) half max 8.442 μM, error 7.511 to 10.06 μM. Data plotted are mean +/− SEM from 3 technical replicates.
Extended Data Fig. 4 |
Extended Data Fig. 4 |. LEM2 WH domain is required for IST1 recruitment to the nascent NE and mediates polymer formation with CHMP7.
a, Top: Quantification of robust IST1 recruitment to chromatin disks in late anaphase, as assessed by blind scoring. Mean +/− SEM determined from 3 independent experiments. (siControl parental: n=80, 58, 106; siLEM2–2 parental: n=78, 50, 58; siControl LEM2-mChr: n=46, 42, 62; siLEM2–2 LEM2-mChr: n=78, 51, 62; siControl LEM2ΔWH-mChr: n=138, 52, 42; siLEM2–2 LEM2ΔWH-mChr: n=112, 48, 51). Two-tailed unpaired t-test was used to determine p-values. No multiple comparisons. Bottom: Representative images by widefield showing localization of endogenous IST1 in late anaphase cells depleted of endogenous LEM2 and expressing the indicated siRNA resistant LEM2-mChr constructs. Scale 2 μm. b, Top: Quantification of the percent of early anaphase disks with robust IST1 recruitment, as assessed by blind scoring. Mean +/− SEM determined from 3 independent experiments (siControl parental: n=38, 16, 20; siLEM2–2 parental: n=24, 10, 25; siControl LEM2-mChr: n=50, 20, 24; siLEM2–2 LEM2-mChr: n=38, 14, 8; siControl LEM2ΔWH-mChr: n=44, 16, 20; siLEM2–2 LEM2ΔWH-mChr: n=20, 4, 14). Two-tailed unpaired t-test was used to determine p-values. No multiple comparisons. Bottom: Representative images by widefield showing localization of endogenous IST1 in early anaphase cells depleted of endogenous LEM2 and expressing the indicated siRNA resistant LEM2-mChr constructs. Scale 2 μm. c, Negative stain EM corresponding to the CHMP7 polymerization assay showing no polymerization for the control condition CHMP7+LEM2NTD. Representative of 2 technical replicates.
Extended Data Fig. 5 |
Extended Data Fig. 5 |. Homology modeling and crosslinking-mass spectrometry (XL-MS) consistent with a WH domain-swap mechanism for CHMP7 activation by LEM2.
a, Workflow of lysine-lysine hybrid peptide mapping using XL-MS. BS3 cross-links surface accessible Lys residues with Cα-Cα distances <~3nm. b, Homology models for the winged helix (WH) domains of CHMP7 and LEM2 from reference structures described in Supplementary Table 2. WH1 of CHMP7 contains a membrane binding region indicated as a loop. c, Homology models of the CHMP7 ESCRT-III-fold in open and closed conformations. Alpha helices 1–2 (green), 3–4 (orange). d, Distance restraints identified from XL-MS analysis of the CHMP7 monomer were mapped to open and closed homology models. Cα-Cα distances > 3 nm are considered violations. Satisfied restraints are shown in blue, and violated restraints are shown in red. The open ESCRT-III conformation was rejected. e, Top: A crystallographic interface between VPS25 and an ESCRT-III helix serves as template for the XL-MS informed homology model of the CHMP7 WH2 interaction with the CHMP7 ESCRT-III domain. For details on template structures see Supplementary Table 2. Middle and bottom: All cross-links are satisfied when mapped to the closed CHMP7-ESCRT-III model (middle and lower panel) and agree with domain connectivity. A subset of cross-links was not satisfied when mapping WH1 instead to the same interface (data not shown). f, Left: Distance restraints identified from XL-MS analysis of CHMP7 monomer mapped to conformation of polymerized CHMP7 consistent with 2D class averages. Violated restraints suggest a hinge region between CHMP7 WH1 and WH2 that allows its WH1 to move closer to the ESCRTIII core (black arrow). Right: Violated restraints to WH2 are indicated.
Extended Data Fig. 6 |
Extended Data Fig. 6 |. Activated CHMP7 forms polymeric rings via its ESCRT-III domain, exposing its tandem WH domains.
a, CHMP7 point mutations are indicated in an open ESCRT-III-fold, representing polymerized CHMP7. b, Negative stain EM of His6-SUMO-LEM2WH co-incubated with CHMP7 mutants. Scale bars are 50 nm. Images representative of 3 technical replicates. c, SDS-PAGE of pellet (P) or supernatant (S) following centrifugation of LEM2WH incubated with wild type or mutant CHMP7. For gel source data, see Supplementary Figure 1. d, Quantification of pelleted protein after SDS-PAGE and Coomassie blue staining for mutant versus wild type proteins. Mean +/− SD quantified from n=3 independent experiments. e, SDS-PAGE based relative quantification of polymerized and pelleted CHMP7 with different ratios of LEM2WH present. Red lines indicate expected fraction of CHMP7 in the pelleted polymer, assuming 1:1 stoichiometric polymer. Mean +/− SD quantified from n=3 independent experiments. For gel source data, see Supplementary Figure 1. f, Negative stain EM of CHMP7 polymers on a liposome. Scale 100 nm. g, Top, negative stain EM of membrane-induced CHMP7 polymers used for 2D averaging. Scale 20 nm. Bottom, representative 2D-class averages from manually particles from polymers shown at top. f and g representative of 5 technical replicates. h, Negative stain EM of CHMP7ESCRT-III (AA: 229–453). Representative of 3 technical replicates. Scale 20 nm.
Extended Data Fig. 7 |
Extended Data Fig. 7 |. LEM2 promotes early nuclear compartmentalization via cooperation between its LCD and WH domains.
a, Example images of cells treated with siLEM2 and expressing NLS-3GFP in combination with siRNA resistant LEM2 constructs corresponding to the quantification graphs shown in b and main text Fig. 3f. DNA was labeled using NucBlue. Time 0 refers to the time of complete cleavage furrow ingression. Scale bar 2 μm. b, Mean nuclear/cytoplasmic ratio of NLS-3GFP fluorescence over time in cells treated with the indicated siRNAs and expressing the indicated siRNA resistant constructs. Cells imaged at 15s intervals though 1min increments are plotted. Data was collected across at least 3 biological replicates and the mean +/− SD are plotted (siCon LEM2-mChr; n=26; siLEM2–2 LEM2-mChr: n=44; siCon LEM2ΔSY-mChr: n=20; siLEM2–2 LEM2ΔSY-mChr: n=24; siCon LEM2ΔPR-mChr: n=20; siLEM2–2 LEM2ΔPR-mChr: n=20; siCon LEM2ΔWH-mChr: n=24; siLEM2–2 LEM2ΔWH-mChr: n=16). Two-tailed unpaired t-test was used to determine p-values comparing deletion mutant lines to the full length LEM2 line under endogenous LEM2 depletion conditions at each timepoint. No multiple comparisons. Asterisk code graphed for clarity (*P < 0.05; **P < 0.005) while exact are p-values reported in the table shown at the bottom. c, Quantification of nuclear/cytoplasmic ratio of NLS-3GFP approximately 30 minutes after complete cleavage furrow ingression in parental HeLa cells treated with the indicated siRNAs. Data was collected across 3 biological replicates and plotted as mean +/− SD (siControl: n=11, 12, 6; siLEM2–2: n=18, 18, 14; siCHMP7: n=11, 6, 14). Two-tailed unpaired t-test was used to determine p-values. No multiple comparisons.
Extended Data Fig. 8 |
Extended Data Fig. 8 |. Loss of LEM2 functions leads to DNA damage and abnormal nuclear morphologies.
a, Live-cell imaging of GFP-tubulin and H2B-mChr in siRNA treated cells. Images representative of 2 biological replicates and quantified in b. Time 0 refers to the time of complete cleavage furrow ingression. Scale 2 μm. b, Left: Orthogonal view of the tubulin phenotype following LEM2 depletion co-stained for the NE protein SUN2. Images representative of 3 biological replicates. Scale 5 μm. Right: The mean percent of telophase cells with nuclear tubulin defects, lined with inner nuclear membrane (as assessed by immunofluorescence of Lamin B2). Data plotted are mean +/− SEM from 3 biological replicates (siControl: n=75, 35, 37; siLEM2–1: n=72, 35, 37; siLEM2–2: n=45, 34, 34). Two-tailed unpaired t-test was used to determine p-values. No multiple comparisons. c, Left: Example images of 53BP1 localization by immunofluorescence in telophase U2OS cells following siRNA treatment, as quantified on the right. Scale 5μm. Right: Quantification of the percent of telophase cells with ≥5 53BP1 nuclear foci. Mean +/− SEM percent of telophase cells with ≥5 53BP1 foci determined from 3 biological replicates (siControl: n=56, 52, 44; siLEM2–1: n=64, 56, 26; siLEM2–2: n=74, 50, 40). Two-tailed unpaired t-test was used to determine p-values. No multiple comparisons. Bottom: immunoblot confirming depletion of endogenous LEM2 in U2OS cells, using siRNA oligos previously validated in other human cell lines, including HeLa (immunoblot source data shown in Supplementary Fig. 1),. d, Negative stain EM of indicated combinations of MT, LEM2NTD-linker-WH, and CHMP7FL. Scale 25 nm. Images representative of 2 technical replicates. e, Example images of cells expressing the indicated siRNA-resistant constructs and treated with the indicated siRNAs. LEM2-mChr in magenta, DAPI-stained DNA in blue, and tubulin immunofluorescence in green. Cells were arrested in S-phase and then allowed to progress through one round of division, resulting in an interphase population of cells that just exited mitosis. We observed an increased number of highly irregular nuclei in cells expressing either LEM2ΔPR-mChr or LEM2ΔWH-mChr compared to cells expressing full-length LEM2 or even those depleted of LEM2. Notably, deformed nuclei were commonly associated with microtubule disorganization and aberrant accumulation of LEM2ΔPR-mChr and LEM2ΔWH-mChr. Representative nuclear, tubulin, and LEM2 phenotypes and the correspondence to nuclear circularity score is shown. Nuclear borders and circularity scores annotated in tubulin channel. Scale 5μm. These findings suggest that interfering with cooperation between LEM2’s microtubule-interacting and ESCRT-binding domains alters nuclear morphology, indicating that both activities are necessary, but neither is sufficient for NE reformation. Moreover, the presence of one activity without the other is detrimental to nuclear morphology. f, Quantification of nuclear circularity in interphase parental HeLa cells and cells expressing the indicated siRNA-resistant LEM2 constructs, treated with the indicated siRNAs. Data plotted are mean +/− SEM from 3 biological replicates (siControl parental: n=105, 46, 80; siLEM2–2 parental: n=102, 116, 59; siControl LEM2-mChr: n=153, 53, 122; siLEM2–2 LEM2-mChr: n=84, 81, 105; siControl LEM2ΔSY-mChr: n=123, 68, 144; siLEM2–2 LEM2ΔSY-mChr: n=93, 95, 105; siControl LEM2ΔPR-mChr: n=149, 123, 58; siLEM2–2 LEM2ΔPR-mChr: n=49, 31, 42; siControl LEM2ΔWH-mChr: n=116, 96, 94; siLEM2–2 LEM2ΔWH-mChr: n=85, 32, 68). Two-tailed unpaired t-test was used to determine p-values comparing circularity scores less than 0.6 (indicated by blue) between the indicated treatments. No multiple comparisons. g, Immunoblot showing relative levels of the siRNA-resistant constructs fused with mCherry in parallel with endogenous LEM2. Representative of 2 technical replicates. For immunoblot source data, see Supplementary Fig. 1.
Fig. 1 |
Fig. 1 |. LEM2 targeting to the NE core at anaphase chromatin disks depends on BAF binding and a LCD capable of forming liquid-like droplets.
a, Top, cartoon of LEM2 sequence motifs and cellular localization. Transmembrane (TM). Bottom, live cell imaging of GFP-tubulin alongside LEM2-mChr constructs. Time 0 is time of complete cleavage furrow ingression (CFI). Representative of results from 3 biological replicates, except the ΔLCD image is representative of 2 biological replicates. b, Partial and whole droplet fluorescence recovery after photobleaching (FRAP). Mean +/− standard deviation (SD) of n=3 independent samples. c, Real-time fluorescence imaging of LEM2NTD-droplet fusion. Images representative of 2 independent experiments. d, Concentration-dependent droplet formation of purified LEM2NTD. Representative of 3 independent experiments. e, Top, schematic indicating sites of LEM2NTD phosphomimetic mutations in two constructs (Mim1, Mim2). Bottom, LEM2 immunoblot assessing the migration pattern of full-length LEM2-mChr following separation by Phos-tag SDS-PAGE; lysates treated with lambda phosphatase (λ-PP) as indicated. Representative of 2 biological replicates, with 1 and 3 technical replicates per biological replicate. For immunoblot source data, see Supplementary Fig. 1. Right, fluorescence imaging of purified LEM2NTD-phosphomimetic constructs (Mim1, Mim2). Images representative of 2 technical replicates. Scale 2 μm (a-e).
Fig. 2 |
Fig. 2 |. LEM2 concentrates around spindle MTs and its LCD forms a liquid-like coating around microtubules.
a, STED imaging of endogenous LEM2 in late anaphase. Scale 150 nm. Representative of data from 4 cells. b, Fluorescence imaging of full-length LEM2 (LEM2FL) and MTs. Representative of 2 technical replicates. Fluorescence imaging of LEM2NTD and MTs. Representative of 10 technical replicates. c, FRAP analysis of LEM2FL- and LEM2NTD-coated MT bundles. Data plotted are mean +/− SEM for n=5 independent samples (LEM2FL) or n=17 independent samples (LEM2NTD). d, FRAP analysis of a LEM2NTD-coated MT bundle. Images representative of 2 independent examples. e, Electron micrographs of MT alone or with indicated portions of purified LEM2. LEM2-PRA AA:145–165, LEM2-PRB AA:188–213. Representative of 3 technical replicates. Scale 25 nm. f, Top, schematic architecture of LEM2 highlighting the SY-rich and PR-rich regions. Bottom, live cell imaging of indicated LEM2-mChr deletion constructs and GFP-tubulin. Time 0 refers to time of complete CFI. Representative of 3 biological replicates. Scale 2 μm (b, d, f).
Fig. 3 |
Fig. 3 |. LEM2 coassembles with CHMP7 to form an O-ring that facilitates early nuclear sealing.
a, Live cell imaging of GFP-CHMP7 and LEM2-mChr versus LEM2ΔWH-mChr (left). Localization was quantified across 4 biological replicates (LEM2-mChr: n=14; LEM2ΔWH-mChr: n=12). Data plotted are mean +/− SD and p-value determined with two-tailed unpaired t-test. b, Top, CHMP7 domain schematic. Bottom, EM of indicated components. Representative of 3 technical replicates. c, XL-MS. BS3 crosslinks enriched more than 4-fold mapped onto the primary structure: monomeric CHMP7 (red) or LEM2WH-CHMP7 polymer (blue). MB, membrane binding. d, Left, EM of polymerized ring of full-length CHMP, image representative of 5 technical replicates, and 2D class average of polymerized CHMP7. Right, homology model of polymeric CHMP7. e, Cartoon of LEM2-mediated CHMP7 activation. f, Left: Representative image of NLS-3GFP localization in cells treated with siRNA and expressing LEM2-mChr. DNA labeled with NucBlue. Time 0 refers to time of complete CFI. Right: Mean ratio of nuclear/cytoplasmic NLS-3GFP throughout late anaphase. Data plotted are mean +/− SD across at least 3 biological replicates (siCon LEM2-LEM2-mChr: n=26; siLEM2–2 LEM2-mChr: n=44; siLEM2–2 LEM2ΔPR-mChr: n=20; siLEM2–2 LEM2ΔWH-mChr: n=16 cells). P-values determined with two-tailed unpaired t-test at each timepoint, comparing full length to each mutant constructs. *P < 0.05; **P < 0.005. No multiple comparisons. Exact p-values in Extended Data Fig. 7b. g, EM of indicated components. Scale 25 nm. Representative of 2 technical replicates. h, Model: The LEM2-CHMP7 macromolecular O-ring.

References

    1. Ungricht R & Kutay U Mechanisms and functions of nuclear envelope remodelling. Nat Rev Mol Cell Biol 18, 229–245, doi:10.1038/nrm.2016.153 (2017). - DOI - PubMed
    1. Vietri M et al. Spastin and ESCRT-III coordinate mitotic spindle disassembly and nuclear envelope sealing. Nature 522, 231–235, doi:10.1038/nature14408 (2015). - DOI - PubMed
    1. Olmos Y, Hodgson L, Mantell J, Verkade P & Carlton JG ESCRT-III controls nuclear envelope reformation. Nature 522, 236–239, doi:10.1038/nature14503 (2015). - DOI - PMC - PubMed
    1. Gu M et al. LEM2 recruits CHMP7 for ESCRT-mediated nuclear envelope closure in fission yeast and human cells. Proc Natl Acad Sci U S A 114, E2166–E2175, doi:10.1073/pnas.1613916114 (2017). - DOI - PMC - PubMed
    1. Haraguchi T et al. BAF is required for emerin assembly into the reforming nuclear envelope. J Cell Sci 114, 4575–4585 (2001). - PubMed

Publication types