. 2020 Jun;582(7810):129-133.
doi: 10.1038/s41586-020-2309-6. Epub 2020 May 20.

Structure and mechanism of the mitochondrial Ca2+ uniporter holocomplex

Affiliations

Structure and mechanism of the mitochondrial Ca2+ uniporter holocomplex

Minrui Fan et al. Nature. 2020 Jun.

Abstract

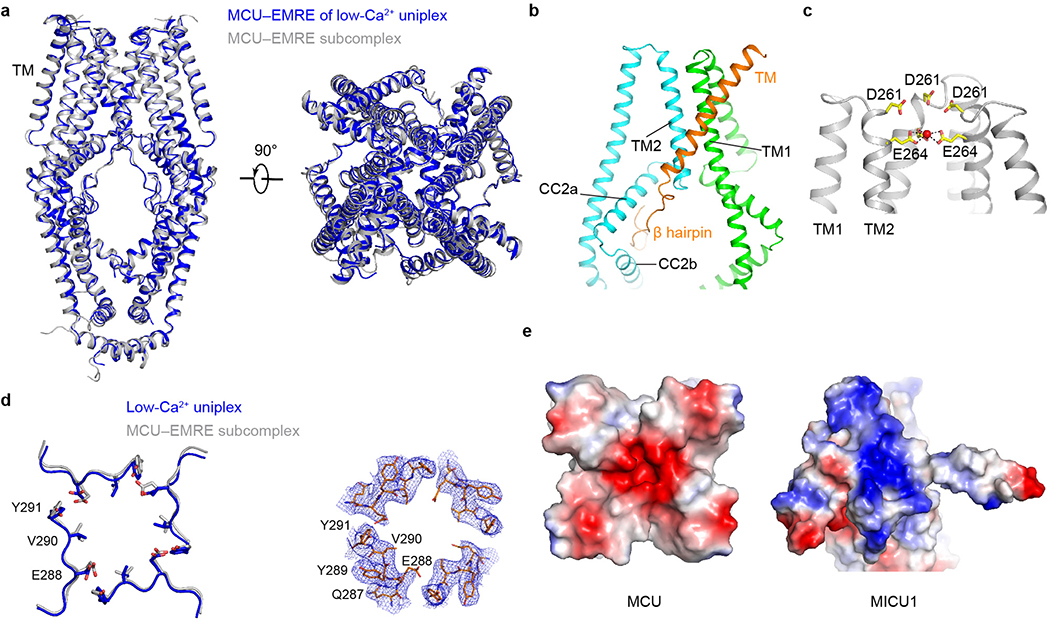
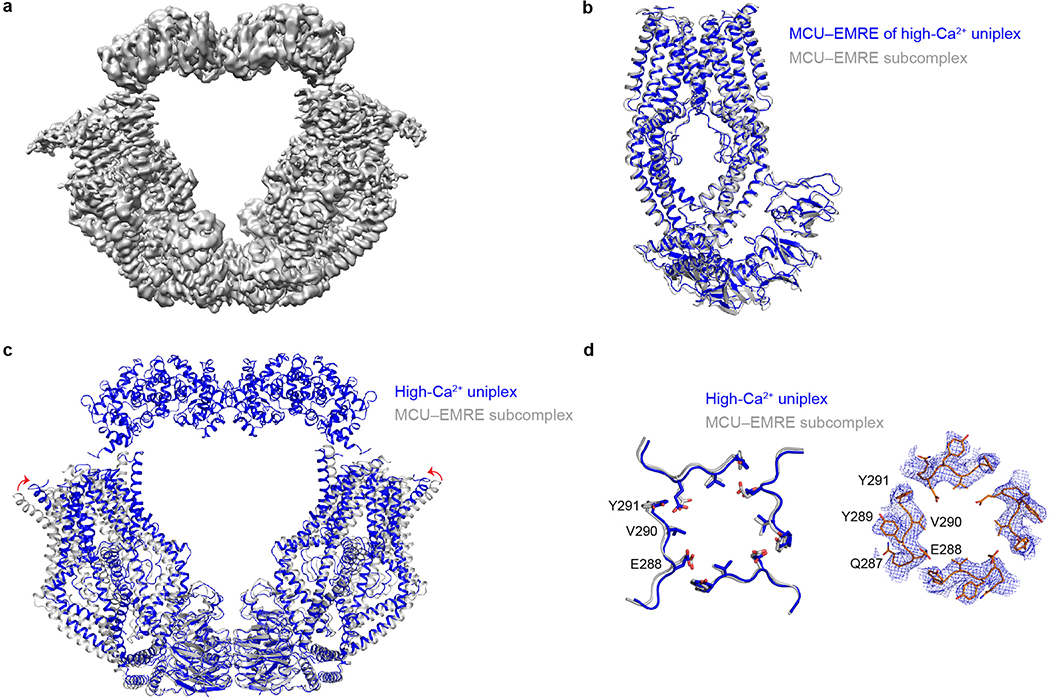
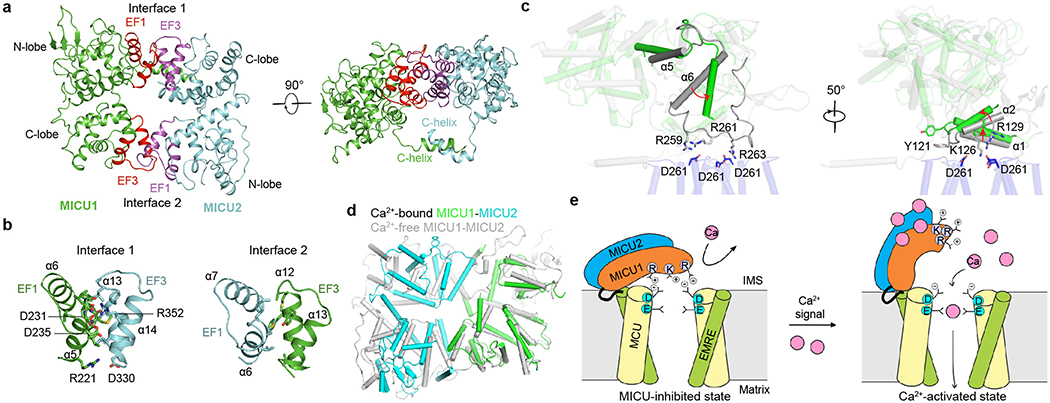
Mitochondria take up Ca2+ through the mitochondrial calcium uniporter complex to regulate energy production, cytosolic Ca2+ signalling and cell death1,2. In mammals, the uniporter complex (uniplex) contains four core components: the pore-forming MCU protein, the gatekeepers MICU1 and MICU2, and an auxiliary subunit, EMRE, essential for Ca2+ transport3-8. To prevent detrimental Ca2+ overload, the activity of MCU must be tightly regulated by MICUs, which sense changes in cytosolic Ca2+ concentrations to switch MCU on and off9,10. Here we report cryo-electron microscopic structures of the human mitochondrial calcium uniporter holocomplex in inhibited and Ca2+-activated states. These structures define the architecture of this multicomponent Ca2+-uptake machinery and reveal the gating mechanism by which MICUs control uniporter activity. Our work provides a framework for understanding regulated Ca2+ uptake in mitochondria, and could suggest ways of modulating uniporter activity to treat diseases related to mitochondrial Ca2+ overload.


Conflict of interest statement

Competing interests: The authors declare no competing interests.

Figures

Extended Data Figure 1 |
Extended Data Figure 1 |. Biochemical characterization of the purified human uniplex and validation of the interfaces of low-Ca2+ uniplex.
a, Size-exclusion chromatography profile of the purified human uniplex. b, SDS-PAGE analysis of the purified human uniplex. The disulfide-linked MICU1-MICU2 heterodimer is labeled with an asterisk. Data in a and b are representative of five independent experiments with similar results. c, Effects of MCU-MICU1 interfacial mutations on complex stability. Flag-tagged MICU1 was immobilized to pull down 1D4-tagged WT-MCU co-expressed in MCU/EMRE/MICU1-KO cells. WCL: whole cell lysate. IP: eluted protein. KA, RA, and YA stand for K126A, R129A, and Y114A mutations, respectively. In a separate control CoIP experiment, Letm1-Flag was expressed alone in MCU/EMRE/MICU1-KO cells, which were solubilized and incubated with Flag beads. The eluent was then analyzed. Letm1 in WCL and IP was detected using anti-Flag and anti-Letm1 antibodies, respectively. Cytochrome C oxidase subunit 2 (COX2) serves as a control showing that MICU1 does not interact non-specifically with other mitochondrial inner-membrane proteins. MICU2 signals were obtained by targeting native proteins. EMRE blot was not performed as the EMRE gene was deleted in these cells. MICU1 mutants were properly folded as they still formed a complex with MICU2. d, Functional roles of MICU1’s C-terminal helix. In CoIP, WT-MCU, WT-MICU2, and Flag-tagged MICU1 constructs were expressed in MCU/EMRE/MICU1-KO cells, with MICU1 used to pull down other subunits. C-truncation (ΔC, residues 445 – 476 deleted) of MICU1 greatly weakens its interaction with MCU without affecting MICU2 binding. Tim23, a membrane-embedded component of the mitochondrial translocase of the inner membrane, was used to rule out non-specific binding. The bar chart summarizes the effect of MICU1 C-truncation on the gatekeeping function. WT or ΔC-MICU1 was expressed in MICU1-KO cells, and mitochondrial Ca2+ uptake in low-Ca2+ conditions (300 nM) was quantified using 45Ca2+ flux. Results are presented as mean +/− S.E.M. Numbers of independent repeats are provided inside parentheses. ΔC-MICU1 has a much weaker ability to gate MCU than WT-MICU1, as determined by two-tailed t-test (P=0.0098). Con: untransfected MICU1-KO cells. e, Roles of the MICU1-EMRE interaction in uniplex stability. The experiment assessed the complex stability of WT-MCU and the indicated MICU1 constructs in the presence of WT or C-truncated (residues 96 – 107 deleted) EMRE in low Ca2+ conditions. These three subunits were co-expressed in MCU/MICU1/EMRE-KO cells. C-truncation of EMRE or charge-reversal of MICU1’s KKKKR sequence to QEQEQ (EQ) greatly weakens MICU1 association with MCU. f, R352 contribution to MICU1–2 heterodimer formation. Complex formation between C463S-MICU1, which cannot form a disulfide MICU dimer, and WT- or R352E-MICU2 was examined in MICU1/MICU2-KO cells. The R352E mutation in MICU2 strongly perturbs dimerization with MICU1. Letm1, detected using anti-Letm1 antibody, serves as control for non-specific interactions. MCU and EMRE signals reflect native proteins. All CoIP experiments (c-f) were performed 4 times with similar results using independent biological samples. For gel source data, see Supplementary Fig. 1.
Extended Data Figure 2 |
Extended Data Figure 2 |. Single-particle cryo-EM analysis of the uniplex in low Ca2+ conditions.
a, Representative cryo-EM image of the purified uniplex in low Ca2+ conditions. b, 2D class averages of the uniplex. c, The workflow of classification and refinement. d, Angle distributions of the particles for the final reconstruction. e, Fourier shell correlation (FSC) of the final reconstruction as a function of resolution. Red: gold-standard FSC curve, FSC=0.143; Blue: FSC = 0.5; Orange: FSC curve between the final model and half map 1; Green: FSC curve between the final model and half map 2. f, Local resolution of the map calculated by BlocRes.
Extended Data Figure 3 |
Extended Data Figure 3 |. Representative cryo-EM density maps of the uniplex in low-Ca2+ and high-Ca2+ conditions.
a-b, Cryo-EM density maps of MCU (a) and its selectivity filter (b) of low-Ca2+ uniplex. The putative cation is shown as a red sphere. c, Cryo-EM density map of EMRE of low-Ca2+ uniplex. d-e, Cryo-EM density of the α-helices in MICU1 (d) and MICU2 (e) of low-Ca2+ uniplex. f, Cryo-EM density maps of lipids bound to the MCU TM region of low-Ca2+ uniplex. g-j, Cryo-EM density maps of MCU (g), EMRE (h), MICU1 (i), and MICU2 (j) of high-Ca2+ uniplex.
Extended Data Figure 4 |
Extended Data Figure 4 |. Single-particle cryo-EM analysis of the uniplex in high-Ca2+ conditions.
a, Representative cryo-EM image of the uniplex in high-Ca2+ conditions. b, 2D class averages of the uniplex. c, The workflow of classification and refinement. d, Angle distributions of the particles for the final reconstruction. e, The final reconstruction FSC as a function of resolution. Red: gold-standard FSC curve, FSC=0.143; Blue: FSC=0.5; Orange: FSC curve between the final model and half map 1; Green: FSC curve between the final model and half map 2. f, Local resolution of the map calculated using BlocRes.
Extended Data Figure 5 |
Extended Data Figure 5 |. Structural comparison of low-Ca2+ uniplex and the MCU-EMRE subcomplex.
a, Structural superposition of the MCU-EMRE part of low-Ca2+ uniplex (blue) and the MCU-EMRE subcomplex (grey). b, Interactions between MCU and EMRE in the uniplex. Two MCU subunits are coloured green and cyan, and one EMRE is coloured orange. c, The selectivity filter of MCU in the uniplex. The side chains of D261 and E264 are shown as sticks. The putative cation is shown as a red sphere. d, Comparison of the luminal gate of MCU in the uniplex (blue) and the MCU-EMRE subcomplex (grey). The cryo-EM density of the uniplex luminal gate is shown on the right. e, Surface representation of MCU-MICU1 interface, coloured according to electrostatic potential (red, negative; blue, positive).
Extended Data Figure 6 |
Extended Data Figure 6 |. Structural comparison of high-Ca2+ uniplex and the MCU-EMRE subcomplex.
a, Cryo-EM map of high-Ca2+ uniplex. b, Superposition of one copy of high-Ca2+ uniplex and MCU-EMRE subcomplex. The MICU1 and MICU2 parts of the uniplex are omitted for clarity. The uniplex and the MCU-EMRE subcomplex are coloured in blue and grey, respectively. c, Superposition of dimeric high-Ca2+ uniplex and MCU-EMRE subcomplex. d, Comparison of the luminal gate of MCU in high-Ca2+ uniplex (blue) and the MCU-EMRE subcomplex (grey). The cryo-EM density of the uniplex luminal gate is shown on the right.
Extended Data Figure 7 |
Extended Data Figure 7 |. Validation of the interface of high-Ca2+ uniplex and functional roles of uniplex dimer interfaces.
a, The effect of Ca2+ elevation and EMRE C-truncation on MICU1’s association with the uniplex. 1D4-tagged WT-MCU was used to precipitate WT-MICU1 and indicated EMRE constructs in high- or low-Ca2+ conditions. All three subunits were expressed in MCU/MICU1/EMRE-KO cells. The Letm1 control was performed as described in Extended Data Figure 1c, with a 1D4-tagged, rather than Flag-tagged, version of Letm1. Letm1 in WCL or IP was detected with anti-1D4 or -Letm1 antibodies, respectively. Four independent experiments were performed yielding similar results. b, Roles of MICU1’s polybasic sequence in MICU1 binding to the MCU-EMRE tetramer. The image compares the stability of WT-MCU complexed with WT or the KKKKR to QEQEQ mutant (EQ) of MICU1 in low or high Ca2+. WT-MCU/EMRE and MICU1 constructs were expressed in MCU/MICU1/EMRE-KO cells. Four independent repeats were performed leading to similar results. c, Size-exclusion chromatography profiles of the purified human uniplex containing WT- or D123R-MCU. Inset shows the SDS-PAGE gel analysis of the uniplex. The data are representative of three independent experiments with similar results. d, Size-exclusion chromatography profiles of the purified human uniplex containing WT- or mutant-MICU2. The uniplex was expressed in MICU2-KO HEK293 cells to eliminate the effect of endogenous MICU2. The experiment was performed twice independently with similar results. e-g, Functional roles of the uniporter’s dimer interfaces. A D123R-MCU mutant expressed in MCU-KO cells, or K121A- or R107E-R120E-K121E-D154R (tetra)-MICU2 mutants expressed in MICU2-KO cells were analyzed using a standard fluorophore-based mitochondrial Ca2+ uptake assay in 10 μM Ca2+ (e-f) or by 45Ca2+ flux in 300 nM Ca2+ (g). Numbers in parentheses indicate numbers of independent repeats. Arrowheads in e indicate addition of Ru360. Con: untransfected cells. In 45Ca2+ flux experiments, WT-MICU1 was co-expressed with WT or D123R-MCU in MCU-KO cells to ensure sufficient copies of MICU1 to gate MCU (1 μg MCU and 2 μg MICU1 DNA per well in 6-well plates). The tetra-MICU2 construct has lower expression levels despite using 3-fold more DNA in transient expression. h-j, Localization of the uniporter in the mitochondrial inner membrane of WT (h) or MICU2-KO (j) cells. Mitochondrial membrane fractions enriched in outer membrane, inner/outer membrane contact points (CP), or inner membrane (IMM) were separated in a sucrose gradient as described before. COX2, mitofilin, and VDAC were used as the markers for inner membrane (IMM), inner/outer membrane contact points (CP), or outer membrane, respectively. MCU was found to be more enriched in CP (h-i). This feature was not affected by MICU2-KO or expressing tetra-MICU2 in MICU2-KO cells (i-j). The sucrose gradient goes from 60% down to 30% from left to right. The bar chart in i presents the ratio of total Westerns signals in IMM (yellow box in h) over the signals in CP (cyan box in h). N=3 biologically independent experiments were performed, generating similar results (h,j), as summarized in the bar chart (i). Two-tailed t-test was performed with p values labeled on the bar chart. k-l, The effect of the D123R mutation on uniporter distribution. D123R- or WT-MCU was expressed in MCU-KO cells, and MCU localization was analyzed. D123R reduces biased distribution of MCU in CP. N=4 biologically independent experiments were performed, producing similar results (k), as summarized in the bar chart (l). Statistical analyses were done with two-tailed t-test. All bar charts (f,g,i,l) in this figure present data as mean +/− S.E.M. For gel source data, see Supplementary Fig. 1.
Extended Data Figure 8 |
Extended Data Figure 8 |. MICU1-MICU2 heterodimer in low-Ca2+ and high-Ca2+ conditions and sequence alignment of MICU2.
a, Structural comparison of canonical EF-hands 1 and 4 of MICU1 in low-Ca2+ uniplex with that known in Ca2+-free state and Ca2+-bound state. MICU1 of low-Ca2+ uniplex, Ca2+-free MICU1, and Ca2+-bound MICU1 are coloured in green, grey, and orange, respectively. b, Structural comparison of canonical EF-hands 1 and 4 of MICU2 in low-Ca2+ uniplex versus those known in the Ca2+-free and Ca2+-bound states. MICU2 of low-Ca2+ uniplex, Ca2+-free MICU2, and Ca2+-bound MICU2 are coloured in cyan, wheat, and yellow, respectively. c, Structural comparison of canonical EF-hands 1 and 4 of MICU1 in high-Ca2+ uniplex with that known in Ca2+-bound state and Ca2+-free state. MICU1 of high-Ca2+ uniplex, Ca2+-bound MICU1, and Ca2+-free MICU1 are coloured in lemon, orange, and grey, respectively. d, Structural comparison of canonical EF-hands 1 and 4 of MICU2 in high-Ca2+ uniplex versus those known in the Ca2+-bound and Ca2+-free states. MICU2 of high-Ca2+ uniplex, Ca2+-bound MICU2, and Ca2+-free MICU2 are coloured in blue, yellow, and wheat, respectively. e, Sequence alignment of MICU2 homologues from Homo sapiens (Hs), Mus musculus (Mm), Gallus gallus (Gg), Xenopus tropicalis (Xt), and Danio rerio (Dr). The residues participating in MICU1-MICU2 interactions are indicated with magenta circles.
Extended Data Figure 9 |
Extended Data Figure 9 |. Sequence alignment of MICU1 from different species.
Sequence alignment of MICU1 homologues from Homo sapiens (Hs), Gallus gallus (Gg), Danio rerio (Dr), Ciona intestinalis (Ci), Drosophila melanogaster (Dm), Caenorhabditis elegans (Ce), Arabidopsis thaliana (At), and Dictyostelium discoideum (Dd). The residues participating in MICU1-MICU2 interactions are indicated with magenta circles. The residues participating in MICU1-MCU interactions are indicated with blue circles.
Figure 1 |
Figure 1 |. Overall structure of the human uniplex in low-Ca2+ conditions.
a, Architecture of the uniplex. Cryo-EM map (left) and ribbon representation (middle) are viewed from membrane. On the right, uniplex (MCU-EMRE, surface; MICU1-MICU2, ribbon) is viewed from the top. b, Domain organization of MCU, EMRE, MICU1, and MICU2.
Figure 2 |
Figure 2 |. Interface between MICU1-MICU2 and MCU-EMRE in low-Ca2+ conditions.
a, Uniplex surface representation. CC and LHD domains of MCU and N-terminal part of EMRE are omitted for clarity. b, Uniplex subunit interfaces. MCU is shown as surface (blue). EMRE, MICU1, and MICU2 are shown as ribbons. Boxed panels show zoomed-in view of contact areas. c, Effects of MCU-MICU1 interfacial mutations on mitochondrial Ca2+ uptake in low Ca2+ (300 nM). Yellow bars compare WT, MICU1-KO (ΔMICU1), and MICU2-KO (ΔMICU2) cells. Green bars compare various MICU1 constructs in MICU1-KO cells. MICU1 expression was adjusted to similar levels as in Western images (Letm1: loading control; 3 independent experiments were performed with similar results). Data are presented as mean +/− S.E.M. Numbers in the parenthesis represent numbers of biologically independent experiments. Triple-RE: R259E-R261E-R263E. Two-tailed t-test was used to compare the ability of WT-MICU1 and MICU1 mutants to gate MCU (P values provided on the bar chart). For gel source data, see Supplementary Fig. 1.
Figure 3 |
Figure 3 |. Uniplex structure in high-Ca2+ conditions.
Overall structure of high-Ca2+ uniplex is shown in ribbon representation. Red sphere represents Ca2+.
Figure 4 |
Figure 4 |. Ca2+-induced MICU conformational changes and the mechanism of uniplex activation.
a, Overall structure of the MICU1-MICU2 heterodimer. The interfacial EF-hands of MICU1 and MICU2 are coloured in red and magenta, respectively. b, Interfaces between MICU1 and MICU2. c, Ca2+-induced conformational changes in MICU1 (grey, low-Ca2+; green, high-Ca2+) near its interface with MCU. d, Superposition of Ca2+-bound and Ca2+-free MICU1-MICU2 heterodimers. e, Molecular model of Ca2+ activation of the uniplex. Only two copies of MCU/EMRE in the tetramer are presented to reveal the Ca2+ pathway.

References

    1. Rizzuto R, De Stefani D, Raffaello A & Mammucari C Mitochondria as sensors and regulators of calcium signalling. Nat. Rev. Mol. Cell Biol 13, 566–578 (2012). - PubMed
    1. Giorgi C, Marchi S & Pinton P The machineries, regulation and cellular functions of mitochondrial calcium. Nat. Rev. Mol. Cell Biol 19, 713–730 (2018). - PubMed
    1. Kirichok Y, Krapivinsky G & Clapham DE The mitochondrial calcium uniporter is a highly selective ion channel. Nature 427, 360–364 (2004). - PubMed
    1. De Stefani D, Raffaello A, Teardo E, Szabo I & Rizzuto R A forty-kilodalton protein of the inner membrane is the mitochondrial calcium uniporter. Nature 476, 336–340 (2011). - PMC - PubMed
    1. Baughman JM et al. Integrative genomics identifies MCU as an essential component of the mitochondrial calcium uniporter. Nature 476, 341–345 (2011). - PMC - PubMed

Publication types

MeSH terms