

Repositioning of the global epicentre of non-optimal cholesterol
- PMID: 32494083
- PMCID: PMC7332422
- DOI: 10.1038/s41586-020-2338-1
Repositioning of the global epicentre of non-optimal cholesterol
Abstract
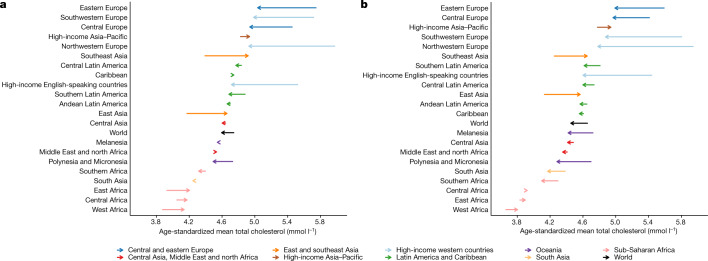
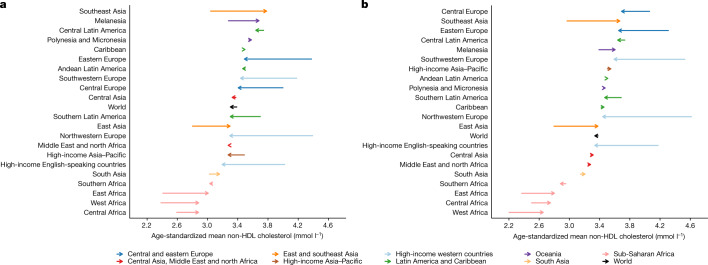
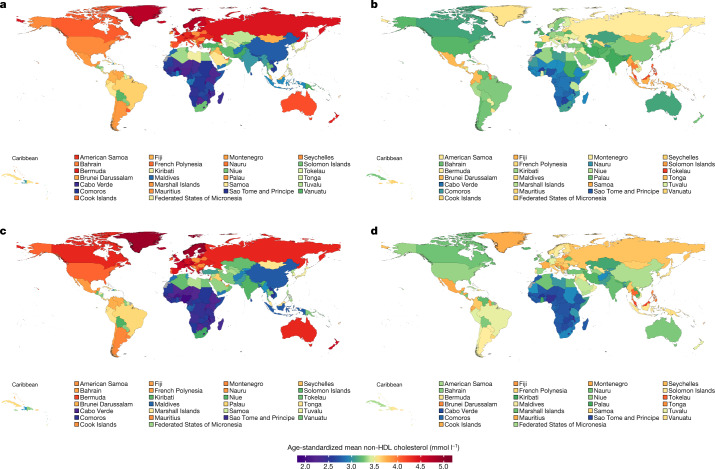
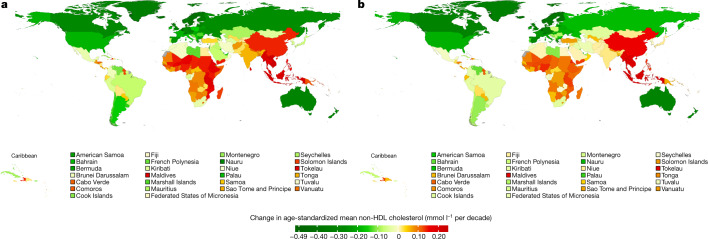
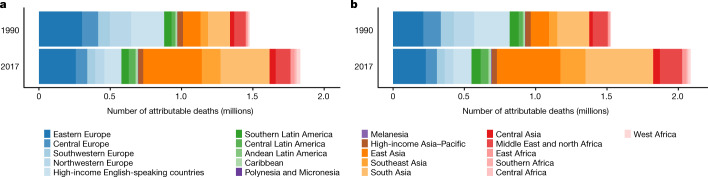
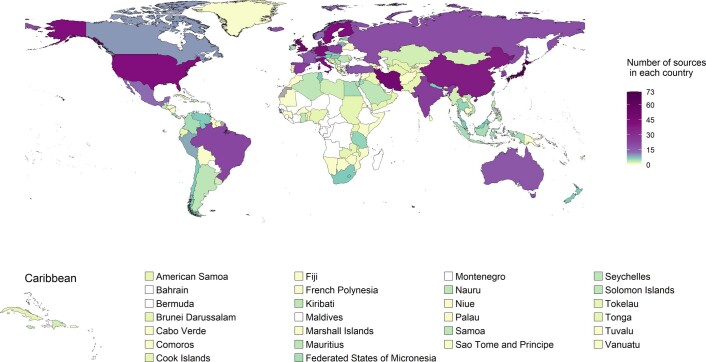
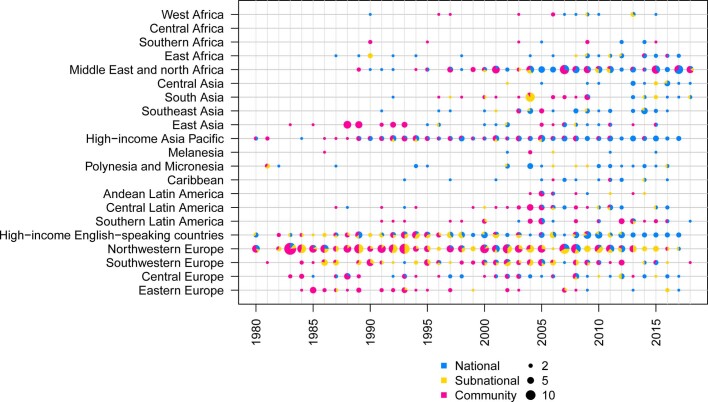
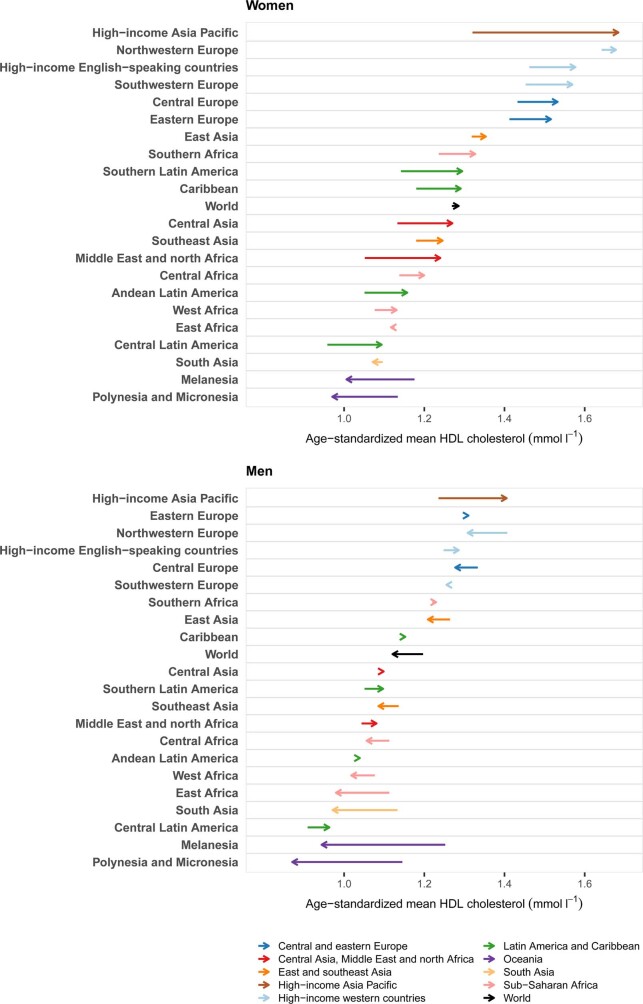
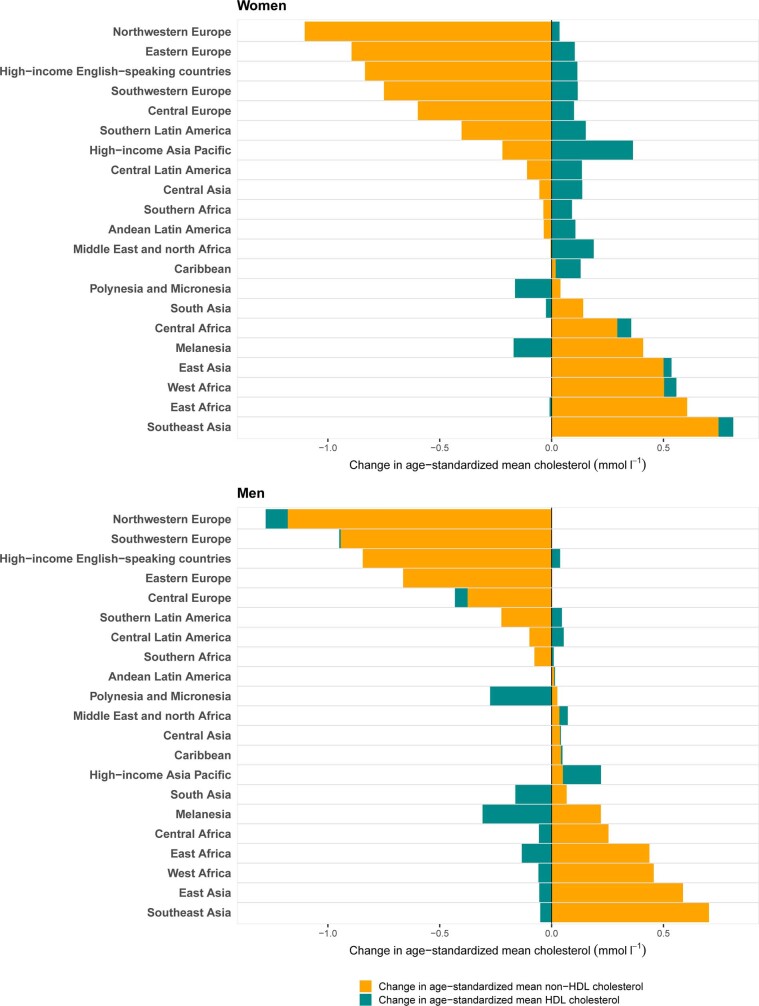
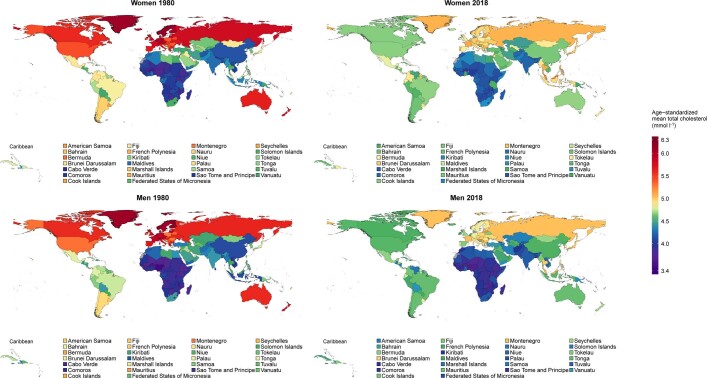
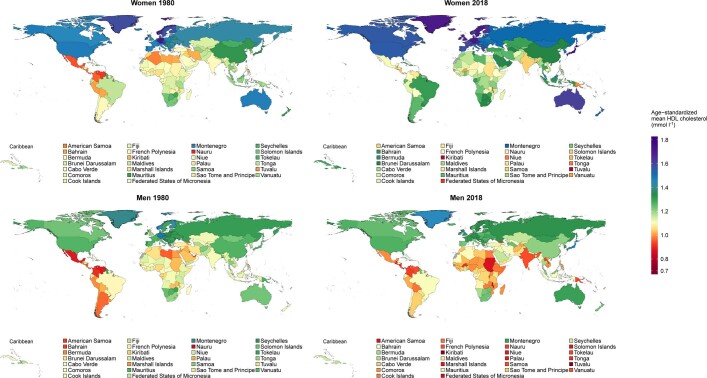
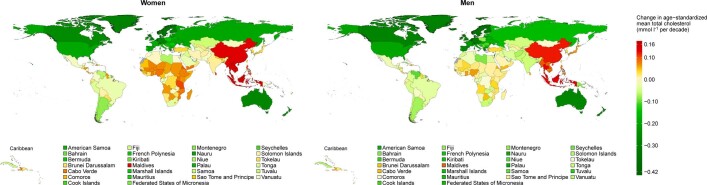
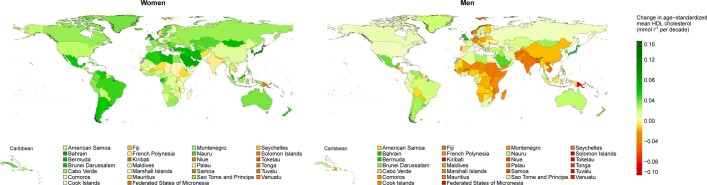
High blood cholesterol is typically considered a feature of wealthy western countries1,2. However, dietary and behavioural determinants of blood cholesterol are changing rapidly throughout the world3 and countries are using lipid-lowering medications at varying rates. These changes can have distinct effects on the levels of high-density lipoprotein (HDL) cholesterol and non-HDL cholesterol, which have different effects on human health4,5. However, the trends of HDL and non-HDL cholesterol levels over time have not been previously reported in a global analysis. Here we pooled 1,127 population-based studies that measured blood lipids in 102.6 million individuals aged 18 years and older to estimate trends from 1980 to 2018 in mean total, non-HDL and HDL cholesterol levels for 200 countries. Globally, there was little change in total or non-HDL cholesterol from 1980 to 2018. This was a net effect of increases in low- and middle-income countries, especially in east and southeast Asia, and decreases in high-income western countries, especially those in northwestern Europe, and in central and eastern Europe. As a result, countries with the highest level of non-HDL cholesterol-which is a marker of cardiovascular risk-changed from those in western Europe such as Belgium, Finland, Greenland, Iceland, Norway, Sweden, Switzerland and Malta in 1980 to those in Asia and the Pacific, such as Tokelau, Malaysia, The Philippines and Thailand. In 2017, high non-HDL cholesterol was responsible for an estimated 3.9 million (95% credible interval 3.7 million-4.2 million) worldwide deaths, half of which occurred in east, southeast and south Asia. The global repositioning of lipid-related risk, with non-optimal cholesterol shifting from a distinct feature of high-income countries in northwestern Europe, north America and Australasia to one that affects countries in east and southeast Asia and Oceania should motivate the use of population-based policies and personal interventions to improve nutrition and enhance access to treatment throughout the world.
Conflict of interest statement
M.E. reports a charitable grant from the AstraZeneca Young Health Programme, and personal fees from Prudential, Scor and Third Bridge, outside the submitted work. The other authors declare no competing interests.
Figures

References
Publication types
MeSH terms
Substances
Grants and funding
- K43 TW010698/TW/FIC NIH HHS/United States
- RG/19/4/34452/BHF_/British Heart Foundation/United Kingdom
- MC_UU_12011/2/MRC_/Medical Research Council/United Kingdom
- MC_U147585819/MRC_/Medical Research Council/United Kingdom
- MC_UU_00019/1/MRC_/Medical Research Council/United Kingdom
- MC_UP_A620_1014/MRC_/Medical Research Council/United Kingdom
- MC_UU_12011/3/MRC_/Medical Research Council/United Kingdom
- 203616/WT_/Wellcome Trust/United Kingdom
- RG/13/16/30528/BHF_/British Heart Foundation/United Kingdom
- MC_U147585824/MRC_/Medical Research Council/United Kingdom
- RE/18/4/34215/BHF_/British Heart Foundation/United Kingdom
- MC_UP_A620_1015/MRC_/Medical Research Council/United Kingdom
- MC_U147585827/MRC_/Medical Research Council/United Kingdom
- 101506/WT_/Wellcome Trust/United Kingdom
- MC_PC_MR/R018545/1/MRC_/Medical Research Council/United Kingdom
- G0901530/MRC_/Medical Research Council/United Kingdom
- 10/33/04/DH_/Department of Health/United Kingdom
- 203616/Z/16/Z/WT_/Wellcome Trust/United Kingdom
- MC_UU_12011/1/MRC_/Medical Research Council/United Kingdom
- G0400519/MRC_/Medical Research Council/United Kingdom
- G0400491/MRC_/Medical Research Council/United Kingdom
- MC_UP_A620_1016/MRC_/Medical Research Council/United Kingdom
LinkOut - more resources
Full Text Sources
Other Literature Sources
Medical
Research Materials
