. 2020 Apr 17;6(16):eaay5589.
doi: 10.1126/sciadv.aay5589. eCollection 2020 Apr.

Density waves in shear-thickening suspensions

Affiliations

Density waves in shear-thickening suspensions

Guillaume Ovarlez et al. Sci Adv. .

Abstract

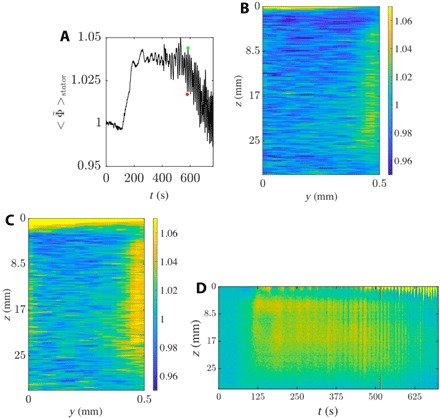
Shear thickening corresponds to an increase of the viscosity as a function of the shear rate. It is observed in many concentrated suspensions in nature and industry: water or oil saturated sediments, crystal-bearing magma, fresh concrete, silica suspensions, and cornstarch mixtures. Here, we reveal how shear-thickening suspensions flow, shedding light onto as yet non-understood complex dynamics reported in the literature. When shear thickening is important, we show the existence of density fluctuations that appear as periodic waves moving in the direction of flow and breaking azimuthal symmetry. They come with strong normal stress fluctuations of the same periodicity. The flow includes small areas of normal stresses of the order of tens of kilopascals and areas of normal stresses of the order of hundreds of pascals. These stress inhomogeneities could play an important role in the damage caused by thickening fluids in the industry.


Figures

Fig. 1
Fig. 1. PVC suspension (60%) in Dinch.
(A to D) Portions of the time traces of the macroscopic shear rate under constant shear stress. See section S1 for the signals over 1800 s. The applied shear stress in the peak hold stress experiments are: 270 Pa (A, black), 200 Pa (B, red), 133 Pa (C, cyan), and 50 Pa (D, green). In a Couette cell, the measured average shear rate and the period Trot of the motor are linked by 1Trot=Ro2Ri2Ro2+Ri2γ˙2π, where Ro is the stator radius and Ri is the rotor radius (Ro = Rie). In our case, this leads to Trot = 8.8 s for a macroscopic shear rate of 17 s−1 and to Trot = 11 s for a macroscopic shear rate of 13.5 s−1. Above the shear thickening transition, large oscillations are observed with a period roughly equal to 18 s for (A) to (C), i.e., two times that of the rotor period rotation (Trot= 8.8 s). Below the shear-thickening transition, the oscillation has a much smaller amplitude and their period is equal to the rotor period rotation, i.e., 11 s. (E) Variation of the apparent viscosity as function of the shear rate recorded in a Couette geometry by ramping up the imposed stress with 60 s per point (small empty black circles) and through subsequent constant stress experiments of at least 3600 s (filled colored circles; shear rate is averaged over the last 2500 s of each step). (F) Same as (E), viscosity as a function of the shear stress. (G) Effect of the eccentricity (indicated above the curve, in μm; steps of 150 s) of the Couette cell on the dynamics. The applied shear stress is 200 Pa.
Fig. 2
Fig. 2. PVC suspension (60%) in Dinch.
(A) Scheme of the x-ray setup. The y direction is the horizontal direction on the x-ray detector. The z direction is the vertical direction and corresponds to the axis of the rotor. (B) Normalized solid fraction averaged over time and vertical position, Φ˜t,z(y), as a function of the position in the gap y for various shear stresses. (C) Variation of the horizontal position (pos) in millimeters of the rotor as a function of time (for t < 3660 s the applied shear stress σ is 125 Pa, for t > 3660 s, σ = 150 Pa and the system is in the shear-thickening regime); the rotor remains centered below the shear-thickening transition and oscillates above. (D) Vertical displacement of the air/sample interface (I.d) as a function of time for the same stresses as in (C); the red curve corresponds to the Couette cell gap imaged on the left side of the detector (see Fig. 2A), and the black curve to the gap imaged on the right side of the detector. For σ = 125 Pa, the rotation velocity of the rotor is Ω = 1.02 rad/s; for σ = 150 Pa, Ω = 0.72 rad/s. The period of the waves is equal to 18 s and is two times the period of the rotor (equal to 8.7 s) for both (B) and (C).
Fig. 3
Fig. 3. PVC (60%) suspension in Dinch.
(A) Instantaneous map of the solid fraction corresponding to the pink circle in (E). (B) Same as (A) for the red circle in (E). (C) Same as (A) for the green circle in (E). (D) Same as (A) for the blue circle in (E). (E) From top to bottom, temporal evolution of the normalized macroscopic shear rate γ˙N=γ˙/100.7 (green line), of the solid fraction Φ˜ (black line), of the normalized rotor displacement dNR=dR×6.89+0.75, where dR is the displacement of the rotor expressed in millimeters (red line), of the normalized interface position IpN = Ip/5 + 0.4, where Ip is the interface displacement expressed in millimeters (right part of the cell Couette, blue line). The solid fraction Φ˜ is the instantaneous solid fraction averaged over the entire gap along the y direction and more than 1 cm below the free interface in the z direction. The data corresponding to the positions at a distance less than 100 μm from the rotor and 100 μm from the stator are excluded. A.U., arbitrary units.
Fig. 4
Fig. 4. Cornstarch suspension in CsCl solution in a smooth Couette geometry.
We apply a series of constant shear stresses for 50 s each. The applied values are 0.3, 1, 2, 3, 5, 8, 10, 12, 15, 20, 25, 30, 40, and 60 Pa. Continuous shear thickening is observed for stresses above 1 Pa, and DST is observed for stresses above 6 Pa (see section S6). (A) Averaged normalized solid-fraction profile along z and y, Φ˜stator, as a function of time. These data are averaged over 40 μm close to the stator and over 2 cm below the free interface in the z direction. The green circle corresponds to t = 515 s, the red one to t = 520 s, for an applied shearstress equal to 25 Pa in the DST regime. (B and C) Instantaneous normalized solid-fraction maps Φ˜(y,z,t). The applied shear stress is equal to 25 Pa, in the DST regime, at t = 515 s and t = 520 s for (B) and (C), respectively. The rheological data can be found in section S6. (D) Normalized solid fraction profile averaged over a width of 40 μm next to the stator, Φ˜stator, plotted as a function of time and height. The red tick corresponds to t = 515 s and the green one to t = 520 s, for an applied shear stress equal to 25 Pa in the DST regime.
Fig. 5
Fig. 5. Illustration of the mechanism in charge of the flow.
A dense zone is created in one part of the rotor, resulting in a higher normal stress and thus with an unbalanced normal stress around the rotor. This induces a displacement of the rotor and creates a wave at the free interface. Apparent viscosity fluctuations in time result from the interplay between the axial symmetry breaking and the imperfect concentricity of the Couette cell.

References

    1. R. G. Larson, The Structure and Rheology Of Complex Fluids (Topics in Chemical Engineering) (Oxford Univ. Press, 1999).
    1. Wagner N. J., Brady J. F., Shear thickening in colloidal dispersions. Phys. Today 62, 27–32 (2009).
    1. Brown E., Forman N. A., Orellana C. S., Zhang H., Maynor B. W., Betts D. E., DeSimone J. M., Jaeger H. M., Generality of shear thickening in dense suspensions. Nat. Mater. 9, 220–224 (2010). - PubMed
    1. Gast A. P., Russel W. B., Simple ordering in complex fluids. Phys. Today 51, 24–30 (1998).
    1. Divoux T., Fardin M. A., Manneville S., Lerouge S., Shear banding of complex fluids. Annu. Rev. Fluid Mech. 48, 81–103 (2016).