. 2020 Apr 17;6(16):eaay7650.
doi: 10.1126/sciadv.aay7650. eCollection 2020 Apr.

Functional diversity of marine megafauna in the Anthropocene

Affiliations

Functional diversity of marine megafauna in the Anthropocene

C Pimiento et al. Sci Adv. .

Abstract

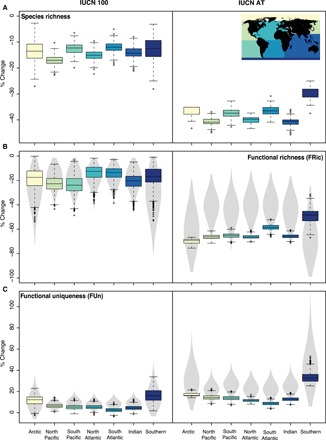
Marine megafauna, the largest animals in the oceans, serve key roles in ecosystem functioning. Yet, one-third of these animals are at risk of extinction. To better understand the potential consequences of megafaunal loss, here we quantify their current functional diversity, predict future changes under different extinction scenarios, and introduce a new metric [functionally unique, specialized and endangered (FUSE)] that identifies threatened species of particular importance for functional diversity. Simulated extinction scenarios forecast marked declines in functional richness if current trajectories are maintained during the next century (11% globally; up to 24% regionally), with more marked reductions (48% globally; up to 70% at the poles) beyond random expectations if all threatened species eventually go extinct. Among the megafaunal groups, sharks will incur a disproportionate loss of functional richness. We identify top FUSE species and suggest a renewed focus on these species to preserve the ecosystem functions provided by marine megafauna.


Figures

Fig. 1
Fig. 1. Composition of marine megafauna in the Anthropocene.
(A) Structure of a three-dimensional functional space for the global megafauna. The percentages in the squares denote total inertia represented in the pair of axes of each plot, where PCoA1 independently represents 25%; PCoA2, 16%; and PCoA3, 9%. Colors denote taxonomic class, as provided by animal shapes: yellow, Actinopterygii (bony fish); brown, Aves (sea birds); purple, Bivalvia (giant clam); dark blue, Cephalopoda (squids and octopus); light blue, Elasmobranchii (sharks and rays); red, Mammalia (whales, seals, sea cows, and polar bear); green, Reptilia (sea turtles); gray, Sarcopterygii (coelacanth). (B) Proportional taxonomic richness of main taxonomic classes: bony fishes (yellow), sharks and rays (blue) and mammals (red), and all other groups (black). (C and D) Percentage of the space volume occupied using six dimensions, which altogether represent 71% of the total inertia. (C) Volume occupied by the main taxonomic classes and (D) by the different oceanic regions (ordered by volume). All plots show mean values across 1000 imputations. Error bars are not shown in bar plots as they are negligible (from 0.003 to 0.01).
Fig. 2
Fig. 2. Forecasted changes in global diversity across extinction scenarios: IUCN 100 and IUCN AT.
(A) Proportional changes in species richness. (B) Proportional changes in FRic (% volume of functional space). (C) Proportional changes in FUn (mean distance to five nearest neighbors). Boxplots show values across 1000 imputations. Violin plots show values obtained by randomized species loss. P values for all pairwise comparisons [empirical data (boxplots) versus randomized data (violin plots)] are <0.05; α = 0.05.
Fig. 3
Fig. 3. Global diversity changes in main taxonomic groups.
(A) Proportional changes in species richness. (B) Proportional changes in FRic (% volume of functional space). (C) Proportional changes in FUn (mean distance to five nearest neighbors). Boxplots show values across 1000 imputations. Violin plots show values obtained by randomized species loss. P values for all pairwise comparisons [empirical data (boxplots) versus randomized data (violin plots) and between groups (among boxplots)] are <0.05; α = 0.05. Colors denote taxonomic class, as provided by animal shapes: yellow, Actinopterygii (bony fish); red, Mammalia (whales, seals, sea cows, and polar bear); blue, Elasmobranchii (sharks and rays).
Fig. 4
Fig. 4. Regional diversity changes.
(A) Proportional changes in species richness. (B) Proportional changes in FRic (% volume of functional space). (C) Proportional changes in FUn (mean distance to five nearest neighbors). Boxplots show values across 1000 imputations. Violin plots show values obtained by randomized species loss. P values for all pairwise comparisons [empirical data (boxplots) versus randomized data (violin plots)] are <0.05; α = 0.05. Colors denote ocean as shown in map in the upper right corner.
Fig. 5
Fig. 5. Species contribution to functional diversity and their current conservation status.
Bars represent mean values for each species across all imputations. (A) FUn. Top species: Dugong (Dugong dugong), green sea turtle (Chelonia mydas) and giant clam (Tridacna gigas). (B) FSp. Top species: Crabeater seal (Lobodon carcinophaga), Antarctic fur seal (Arctocephalus gazelle), and Julien’s golden carp (Probarbus jullieni). (C) FUSE scores. Top species: Green sea turtle, Julien’s golden carp, dugong, sea otter (E. lutris), and giant clam. Bar colors represent species’ original, nonimputed IUCN status (see Materials and Methods).

References

    1. Estes J. A., Heithaus M., McCauley D. J., Rasher D. B., Worm B., Megafaunal impacts on structure and function of ocean ecosystems. Annu. Rev. Env. Resour. 41, 83–116 (2016).
    1. Doughty C. E., Roman J., Faurby S., Wolf A., Haque A., Bakker E. S., Malhi Y., Dunning J. B. Jr., Svenning J.-C., Global nutrient transport in a world of giants. Proc. Natl. Acad. Sci. U.S.A. 113, 868–873 (2016). - PMC - PubMed
    1. Hammerschlag N., Schmitz O. J., Flecker A. S., Lafferty K. D., Sih A., Atwood T. B., Gallagher A. J., Irschick D. J., Skubel R., Cooke S. J., Ecosystem function and services of aquatic predators in the anthropocene. Trends Ecol. Evol. 34, 369–383 (2019). - PubMed
    1. Estes J. A., Burdin A., Doak D. F., Sea otters, kelp forests, and the extinction of Steller’s sea cow. Proc. Natl. Acad. Sci. U.S.A. 113, 880–885 (2016). - PMC - PubMed
    1. Estes J. A., Terborgh J., Brashares J. S., Power M. E., Berger J., Bond W. J., Carpenter S. R., Essington T. E., Holt R. D., Jackson J. B. C., Marquis R. J., Oksanen L., Oksanen T., Paine R. T., Pikitch E. K., Ripple W. J., Sandin S. A., Scheffer M., Schoener T. W., Shurin J. B., Sinclair A. R. E., Soulé M. E., Virtanen R., Wardle D. A., Trophic downgrading of planet Earth. Science 333, 301–306 (2011). - PubMed

Publication types