. 2020 Apr 15;6(16):eaaz1639.
doi: 10.1126/sciadv.aaz1639. eCollection 2020 Apr.

Revealing in real-time a multistep assembly mechanism for SV40 virus-like particles

Affiliations

Revealing in real-time a multistep assembly mechanism for SV40 virus-like particles

Mariska G M van Rosmalen et al. Sci Adv. .

Abstract

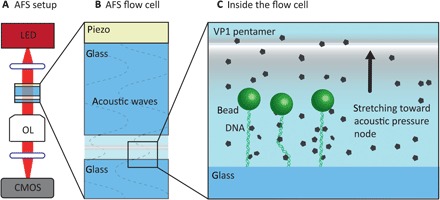
Many viruses use their genome as template for self-assembly into an infectious particle. However, this reaction remains elusive because of the transient nature of intermediate structures. To elucidate this process, optical tweezers and acoustic force spectroscopy are used to follow viral assembly in real time. Using Simian virus 40 (SV40) virus-like particles as model system, we reveal a multistep assembly mechanism. Initially, binding of VP1 pentamers to DNA leads to a significantly decreased persistence length. Moreover, the pentamers seem able to stabilize DNA loops. Next, formation of interpentamer interactions results in intermediate structures with reduced contour length. These structures stabilize into objects that permanently decrease the contour length to a degree consistent with DNA compaction in wild-type SV40. These data indicate that a multistep mechanism leads to fully assembled cross-linked SV40 particles. SV40 is studied as drug delivery system. Our insights can help optimize packaging of therapeutic agents in these particles.


Figures

Fig. 1
Fig. 1. DNA binding properties of truncated VP1 pentamers determined by OT.
(A) Forward (FW) and backward (BW) FD curves of bare DNA (gray) and DNA incubated with truncated VP1 pentamers for 9 min (green and magenta) and the subsequent immediate restretch (blue). Only backward FD curves are fitted with the WLC model (red and black). (B) A scatter plot of all rupture forces (n = 190) obtained from 20 DNA molecules in the presence of VP1 (DNA + VP1) after incubation times ranging from 9 to 131 min with the means + SEM for each time point in red. (C) An exemplary force-time plot (black) is plotted together with the corresponding change of the Lc (green). (D) Using a step-fitting algorithm, we were able to determine the stepwise lengthening of the Lc corresponding to the ruptures in our stretching curves (inset). Histogram of all obtained Lc step sizes; a Gaussian fit to the data (red) shows an average step size of 40 ± 1 nm.
Fig. 2
Fig. 2. Compaction of DNA by truncated VP1 measured by AFS.
(A) Applied force and the corresponding end-to-end distance of a DNA molecule plotted over time. Truncated VP1 pentamers are flushed into the flow cell after each force clamp while the DNA is kept at 3.8 pN (orange asterisk). After flushing, the force is lowered to allow VP1 pentamer compaction. (B) Average compaction rate measured during clamp cycles at different force values of a total of eight traces. Exponential fit to the data is depicted in dark blue. The compaction rate is underestimated at the lower forces due to the saturation effect at consecutive force clamp cycles (always starting from high force). (C) A bare DNA FD curve taken at ~17 min (black arrow) for the molecule shown in (A) (~17 min). (D to E) FD curves obtained in the presence of VP1 for the molecule shown in (A) taken at ~58 min (red arrow) into ~40 min (blue arrow), respectively.
Fig. 3
Fig. 3. Effect of WT-VP1 pentamer interaction with tethered DNA, followed by AFS in real time.
(A) Bare DNA FD curves (black) and DNA in the presence of VP1 FD curves obtained <10 min after addition of WT-VP1 pentamers (red; n = 3). (B) FD curves obtained after incubation for 60 min (green; n = 3) or 120 min (blue; n = 3). (C) Average effective persistence length measured for different incubation times (black, n = 123; red, n = 97; green, n = 25; blue, n = 16; light blue, n = 29; and brown, n = 13; all independent measurements). Error bars represent SEM. (D) Three-dimensional plot displaying the frequency of the Lc as a function of time, same curves as in (C). Bin size is 0.5 μm. (E) Cumulative frequency of the rupture step sizes (337, 60, and 14 rupture events were found in 60, 16, and 13 FD curves with a Lc of >2, between 1 and 2 and <1 μm, respectively). (F) Cumulative frequency of the rupture forces from the same data as in (E).
Fig. 4
Fig. 4. Schematic representation of our assembly model.
When DNA (green) is incubated with VP1 pentamers (gray), the VP1 pentamers will immediately bind to the DNA followed by compaction of the DNA as a result of looping (indicated with red arrows). Binding of VP1 to DNA raises the local concentration of VP1 pentamers, which allows the formation of interpentamer interactions (indicated in blue). Over time, these interactions become stronger possibly by the formation of disulfide bridges. Last, this results in the formation of a complete stable VLP.
Fig. 5
Fig. 5. Schematic representation of the AFS setup and the inside of the flow cell (not to scale).
(A) The flow cell is imaged using an inverted microscope with objective lens (OL), a digital camera [complementary metal-oxide semiconductor (CMOS)] and light-emitting diode (LED) light source (455 nm). (B) The flow cell itself consists of two glass plates, which have a fluid chamber in between. A transparent acoustic wave generating piezo element is attached to the upper glass plate, which is electronically connected to control and measure the voltage. (C) In the flow cell, DNA molecules of which one side is attached to the glass and the other to a microsphere (bead) are stretched toward the acoustic pressure node by acoustic forces acting on the microsphere. Figure inspired by (23, 24).

Similar articles

Cited by

References

    1. Arad U., Zeira E., El-Latif M. A., Mukherjee S., Mitchell L., Pappo O., Galun E., Oppenheim A., Liver-targeted gene therapy by SV40-based vectors using the hydrodynamic injection method. Hum. Gene Ther. 16, 361–371 (2005). - PubMed
    1. Kimchi-Sarfaty C., Alexander N. S., Brittain S., Ali S., Gottesman M. M., Transduction of multiple cell types using improved conditions for gene delivery and expression of SV40 pseudovirions packaged in vitro. Biotechniques 37, 270–275 (2004). - PubMed
    1. Louboutin J.-P., Marusich E., Fisher-Perkins J., Dufour J. P., Bunnell B. A., Strayer D. S., Gene transfer to the rhesus monkey brain using SV40-derived vectors is durable and safe. Gene Ther. 18, 682–691 (2011). - PubMed
    1. Liddington R. C., Yan Y., Moulai J., Sahli R., Benjamin T. L., Harrison S. C., Structure of simian virus 40 at 3.8-Å resolution. Nature 354, 278–284 (1991). - PubMed
    1. Stehle T., Gamblin S. J., Yan Y., Harrison S. C., The structure of simian virus 40 refined at 3.1 å resolution. Structure 4, 165–182 (1996). - PubMed

Publication types

LinkOut - more resources