. 2020 Apr 15;6(16):eaaz7086.
doi: 10.1126/sciadv.aaz7086. eCollection 2020 Apr.

O-GlcNAc transferase promotes influenza A virus-induced cytokine storm by targeting interferon regulatory factor-5

Affiliations

O-GlcNAc transferase promotes influenza A virus-induced cytokine storm by targeting interferon regulatory factor-5

Qiming Wang et al. Sci Adv. .

Abstract

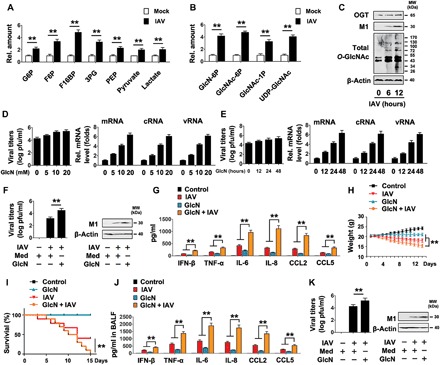
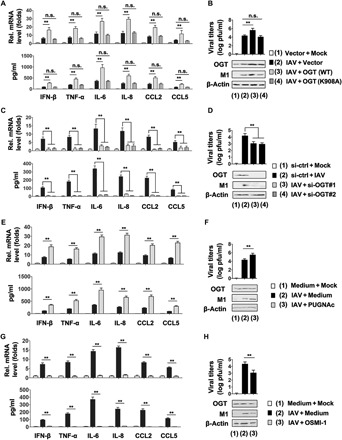
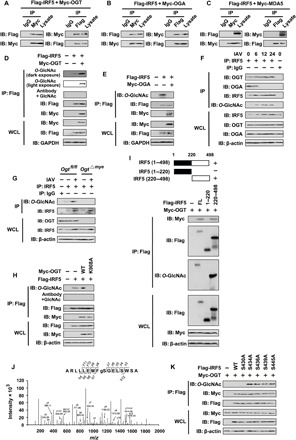
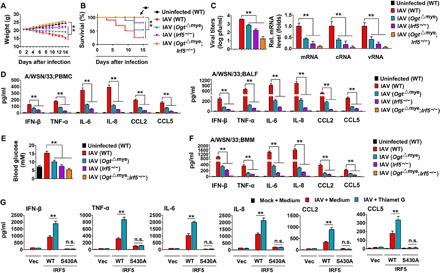
In this study, we demonstrated an essential function of the hexosamine biosynthesis pathway (HBP)-associated O-linked β-N-acetylglucosamine (O-GlcNAc) signaling in influenza A virus (IAV)-induced cytokine storm. O-GlcNAc transferase (OGT), a key enzyme for protein O-GlcNAcylation, mediated IAV-induced cytokine production. Upon investigating the mechanisms driving this event, we determined that IAV induced OGT to bind to interferon regulatory factor-5 (IRF5), leading to O-GlcNAcylation of IRF5 on serine-430. O-GlcNAcylation of IRF5 is required for K63-linked ubiquitination of IRF5 and subsequent cytokine production. Analysis of clinical samples revealed that IRF5 is O-GlcNAcylated, and higher levels of proinflammatory cytokines correlated with higher levels of blood glucose in IAV-infected patients. We identified a molecular mechanism by which HBP-mediated O-GlcNAcylation regulates IRF5 function during IAV infection, highlighting the importance of glucose metabolism in IAV-induced cytokine storm.


Figures

Fig. 1
Fig. 1. GlcN enhances IAV-induced inflammatory cytokine expression.
(A and B) PBMCs were infected with the WSN virus [MOI (multiplicity of infection) = 1] or mock-infected for 12 hours and harvested for metabolomics analysis. Quantification analysis of some intermediates in glycolysis (A) or HBP (B). G6P, glucose-6-phosphate; F6P, fructose 6-phosphate; F16BP, fructose 1,6-bisphosphate; 3PG, 3-phosphoglyceric acid; PEP, phosphoenolpyruvate. (C) PBMCs were infected with the WSN virus (MOI = 1) or mock-infected for the indicated times before Western blot analyses. MW, molecular weight. (D) ATII cells were infected with the WSN virus (MOI = 1) or mock-infected and treated with or without the indicated concentration of GlcN for 24 hours. The viral titers in the culture supernatants were measured using a plaque assay (left) and relative RNA levels of NP-specific mRNA, cRNA, and vRNA were measured using quantitative polymerase chain reaction (qPCR) (right). (E) Experiments were performed as described in (D), except that ATII cells were treated with or without GlcN (10 mM) for the indicated times. (F) PBMCs were infected with the WSN virus (MOI = 1) or mock-infected and treated with or without GlcN (10 mM) for 12 hours and subjected to plaque analyses (left) or Western blot analyses (right). (G) Experiments were performed as described in (F), except that enzyme-linked immunosorbent assay (ELISA) analyses were performed. (H and I) C57BL/6 mice were treated with phosphate-buffered saline (PBS) or GlcN (50 mg/kg per day) by intraperitoneal injection for 1 week and intranasally with 104 plaque-forming units (pfu) of WSN IAV. Body weights were recorded daily (H). Survival curves show data collected until day 14 after infection (I). Statistical analysis was performed using the log-rank test (n = 5 for each group). (J) Experiments were performed as described in (I), except that levels of proinflammatory cytokines and chemokines in the bronchoalveolar lavage fluid (BALF) were measured 48 hours after infection. (K) Experiments were performed as described in (I), except that lung viral titers were measured by plaque assay (left) or IAV M1 were measured using Western blot analyses (right) on day 5 after infection. In the qPCR experiments, the control was designated as 1. All experiments were repeated at least three times. Bar graphs present means ± SD or means ± SEM (n = 3; **P < 0.01).
Fig. 2
Fig. 2. OGT is critical for IAV-induced inflammatory cytokine expression.
(A) PBMCs were transfected with the indicated plasmids or vector controls for 24 hours, infected with the WSN virus (MOI = 1) or mock-infected for 24 hours, and subjected to qPCR (top) and ELISA (bottom) analyses. (B) Experiments were performed as described in (A), except that viral titers were measured by plaque assay (top) or IAV M1 protein in cells were measured using Western blot analyses (bottom). (C and D) Experiments were performed as described in (A) and (B), except that the indicated si-OGTs were used. (E) PBMCs were infected with the WSN virus (MOI = 1) or mock-infected for 12 hours, treated with or without PUGNAc (50 μM) for 12 hours, and subjected to qPCR (top) and ELISA (bottom) analyses. (F) Experiments were performed as described in (E), except that viral titers were measured by plaque assay (top) or IAV M1 protein in cells were measured using Western blot analyses (bottom). (G and H) Experiments were performed as described in (E) and (F), except that OSMI-1 (20 μM) were used. In the qPCR experiments, the control was designated as 1. All experiments were repeated at least three times. Bar graphs present means ± SD (n = 3; **P < 0.01; n.s., not significant).
Fig. 3
Fig. 3. O-GlcNAcylation of IRF5 on S430 is critical for IAV-induced inflammatory cytokine expression.
(A) A549 cells were transfected with Flag-tagged IRF5 (Flag-IRF5) and Myc-tagged OGT (Myc-OGT) for 48 hours. Co-immunoprecipitation (Co-IP) and immunoblot (IB) analyses were performed with the indicated antibodies. IgG, immunoglobulin G. (B and C) Experiments were performed as described in (A), except that Myc-OGA (B) or Myc-MDA5 (C) was used. (D and E) A549 cells were transfected with the indicated plasmid for 48 hours. Co-IP and immunoblot analyses were performed with the indicated antibodies. GAPDH, glyceraldehyde-3-phosphate dehydrogenase; WCL, whole cell lysates. (F) A549 cells were infected with the WSN WT virus for the indicated times. Immunoprecipitation and immunoblot analyses were performed with the indicated antibodies. (G) Experiments were performed as described in (F), except that Ogtfl/fl and OgtΔmye BMMs were infected with the WSN virus for 24 hours. (H) A549 cells were transfected with the indicated plasmid for 48 hours. Co-IP and immunoblot analyses were performed with the indicated antibodies. (I) Domain mapping of the IRF5 and OGT interaction. A549 cells were transfected with the indicated plasmid for 48 hours. Co-IP and immunoblot analyses were performed with the indicated antibodies. The schematic representations of IRF5 truncations are shown at the top. (J) LC-MS/MS analysis was performed to identify S430 as an IRF5 O-GlcNAcylation site after Tm challenge. MS/MS spectrum of the 2+ ion at a mass/charge ratio (m/z) of 1115.06575 corresponding to IRF5 peptide ARLLLEMFSGELSWSA. (K) A549 cells were transfected with empty vector, Myc-OGT, Flag-IRF5 WT, or mutant constructs of IRF5 for 48 hours. Co-IP and immunoblot analyses were performed with the indicated antibodies. All experiments were repeated at least three times.
Fig. 4
Fig. 4. O-GlcNAcylation of IRF5 on S430 promotes its K63-linked ubiquitination.
(A) A549 cells were transfected with Flag-IRF5 and the indicated ubiquitin (Ub) plasmids. Twenty-four hours after transfection, cells were infected with the WSN virus (MOI = 1) for 24 hours before Co-IP and immunoblot analyses were performed with the indicated antibodies. (B) A549 cells were infected with the WSN virus (MOI = 1) for the indicated times. Co-IP and immunoblot analyses were performed with the indicated antibodies. (C) A549 cells were transfected with Flag-IRF5, Myc-OGT, and the indicated ubiquitin plasmids for 48 hours. Co-IP and immunoblot analyses were performed with the indicated antibodies. (D and E) Experiments were performed as described in (C), except that Myc-OGT (K908A) (D) or Flag-IRF5 (S430A) (E) was used. (F) Ogtfl/fl and OgtΔmye BMMs were infected with the WSN virus (MOI = 1) for 24 hours. Co-IP and immunoblot analyses were performed with the indicated antibodies. (G) A549 cells were transfected with si-ctrl or si-OGT for 24 hours and infected with the WSN virus (MOI = 1) for 24 hours. Co-IP and immunoblot analyses were performed with the indicated antibodies. (H and I) A549 cells were transfected with the indicated plasmids for 48 hours. Co-IP and immunoblot analyses were performed with the indicated antibodies. (J) TRAF6+/+ or TRAF6−/− A549 cells were infected with the WSN virus (MOI = 1) for 24 hours. Co-IP and immunoblot analyses were performed with the indicated antibodies. (K) TRAF6+/+ or TRAF6−/− A549 cells were transfected with the vector control or Myc-OGT for 48 hours. Co-IP and immunoblot analyses were performed with the indicated antibodies. All experiments were repeated at least three times.
Fig. 5
Fig. 5. IAV-induced inflammatory cytokine expression through OGT/IRF5.
(A and B) Indicated mice (n = 5 for each group) were intranasally infected with 1 × 10⁴ pfu of the WSN virus, and body weights were recorded daily (A). Survival curves show data collected until day 14 after infection (B). The statistical analysis was performed using a log-rank test. (C) Comparison of lung viral titers (left) and the relative RNA levels of NP-specific mRNA, cRNA, and vRNA (right) on day 5 after WSN infection (n = 5 for each group). (D) Levels of proinflammatory cytokines and chemokines in PBMCs (left) and BALF (right) were measured 48 hours after infection using ELISAs (n = 5 for each group). (E) Experiments were performed as described in (D), except that blood glucose levels were measured. (F) BMMs were isolated from the indicated mice and infected with the WSN virus (MOI = 1) for 24 hours. Levels of proinflammatory cytokines and chemokines were measured using ELISAs (n = 5 for each group). (G) Irf-5−/− BMMs were transfected with vector, IRF5 (WT), or IRF5 (S430A) for 24 hours; then, cells were infected with the WSN virus (MOI = 1) or mock-infected for 12 hours and treated with or without TMG (10 mM) for 12 hours. Cell supernatant was analyzed by ELISA (n = 5 for each group). Bar graphs present means ± SD or means ± SEM (**P < 0.01).
Fig. 6
Fig. 6. Analysis of glucose levels, inflammatory cytokine expression, and IRF5 O-GlcNAcylation levels in IAV-infected patients.
(A) Serum glucose levels in healthy individuals (n = 107) and IAV-infected patients (n = 107). Data represent means ± SEM. (B) Healthy individuals (#14, #33, and #90) and IAV-infected patients (#6, #8, #46, and #82) were randomly selected to isolate PBMCs. The relative expression of protein O-GlcNAcylation, OGT, and IRF5 was measured using Western blot analyses. (C and D) Serum IL-6 (C) and IL-8 (D) protein levels in healthy individuals (n = 107) and IAV-infected patients (n = 107). Data represent means ± SEM. (E and F) Glucose levels and IL-6 (E) or IL-8 (F) protein levels in IAV-infected patients subjected to Pearson’s correlation analysis. (G) PBMCs were isolated from healthy individuals (n = 12) and IAV-infected patients (n = 12). Co-IP and immunoblot analyses were performed with the indicated antibodies (**P < 0.01). (H) A hypothetical model for how IAV uses OGT promoting inflammatory cytokine expression by O-GlcNAcylation of IRF5.

References

    1. DeBerardinis R. J., Thompson C. B., Cellular metabolism and disease: What do metabolic outliers teach us? Cell 148, 1132–1144 (2012). - PMC - PubMed
    1. Liu X., Cooper D. E., Cluntun A. A., Warmoes M. O., Zhao S., Reid M. A., Liu J., Lund P. J., Lopes M., Garcia B. A., Wellen K. E., Kirsch D. G., Locasale J. W., Acetate production from glucose and coupling to mitochondrial metabolism in mammals. Cell 175, 502–513.e13 (2018). - PMC - PubMed
    1. Hardivillé S., Hart G. W., Nutrient regulation of signaling, transcription, and cell physiology by O-GlcNAcylation. Cell Metab. 20, 208–213 (2014). - PMC - PubMed
    1. Yang X., Qian K., Protein O-GlcNAcylation: Emerging mechanisms and functions. Nat. Rev. Mol. Cell Biol. 18, 452–465 (2017). - PMC - PubMed
    1. Yang Y. R., Song M., Lee H., Jeon Y., Choi E.-J., Jang H.-J., Moon H. Y., Byun H.-Y., Kim E.-K., Kim D. H., Lee M. N., Koh A., Ghim J., Choi J. H., Lee-Kwon W., Kim K. T., Ryu S. H., Suh P.-G., O-GlcNAcase is essential for embryonic development and maintenance of genomic stability. Aging Cell 11, 439–448 (2012). - PubMed

Publication types

LinkOut - more resources