. 2020 Apr 22;6(17):eaaz6997.
doi: 10.1126/sciadv.aaz6997. eCollection 2020 Apr.

Cellular contractile forces are nonmechanosensitive

Affiliations

Cellular contractile forces are nonmechanosensitive

Lea Feld et al. Sci Adv. .

Abstract

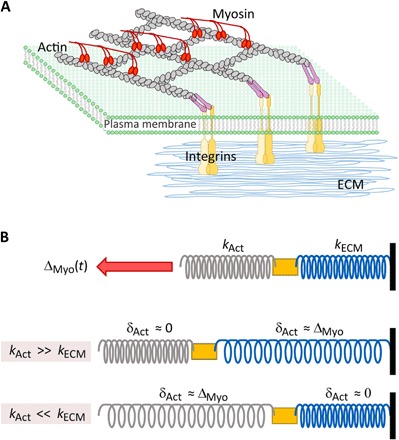
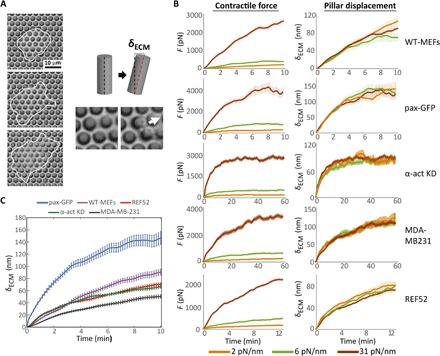
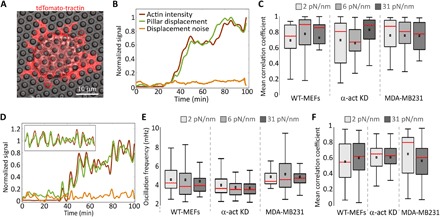
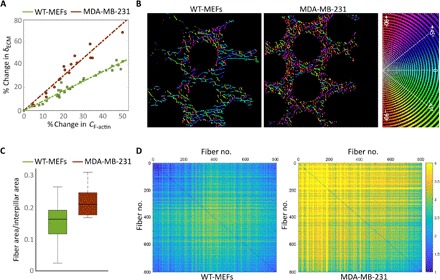
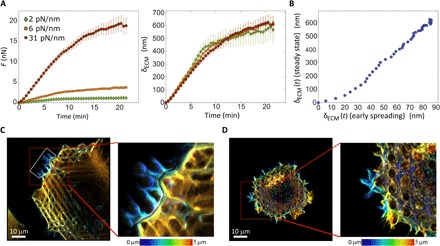
Cells' ability to apply contractile forces to their environment and to sense its mechanical properties (e.g., rigidity) are among their most fundamental features. Yet, the interrelations between contractility and mechanosensing, in particular, whether contractile force generation depends on mechanosensing, are not understood. We use theory and extensive experiments to study the time evolution of cellular contractile forces and show that they are generated by time-dependent actomyosin contractile displacements that are independent of the environment's rigidity. Consequently, contractile forces are nonmechanosensitive. We further show that the force-generating displacements are directly related to the evolution of the actomyosin network, most notably to the time-dependent concentration of F-actin. The emerging picture of force generation and mechanosensitivity offers a unified framework for understanding contractility.


Figures

Fig. 1
Fig. 1. A simple model of cellular contractility.
(A) A schematic of the cellular force generation machinery. Shown are the integrin molecules, which are attached to the ECM at their extracellular side and to actin structures (indirectly, through adapter proteins—purple rods) at the cellular side. Myosin motors that attach to the actin filaments generate a time-dependent displacement, ∆(t) (red arrow). (B) Top: An abstraction of (A) in which a spring of effective rigidity kECM, representing the ECM, is connected in series to another spring of effective rigidity kAct, representing the actin structures. The contractile displacement ∆(t), which is applied to the actin structures, is also shown. Color code as in (A). Middle: The degree to which the ECM or the actin structures are deformed depends on their relative rigidity. For kActkECM, the myosin-generated contractile displacement ∆(t) is accommodated by ECM deformation, δECM ≈ ∆, while the actin filaments composing the actin structures slide past each other as rigid objects with no internal deformation, δAct ≈ 0. Bottom: In the opposite limit (relevant for experiments performed on rigid ECM, e.g., plastic/glass plates), kActkECM, the myosin-generated contractile displacement ∆(t) is accommodated by stretching the actin filaments composing the actin structures, δAct ≈ ∆, while the rigid ECM is not deformed, δECM ≈ 0.
Fig. 2
Fig. 2. Pillar array experiments reveal cell-specific, time-dependent, rigidity-independent contractile displacements.
We used low-illumination bright-field time-lapse imaging to track live cells for several hours as they spread on the pillars to measure δECM(t). (A) Left: Frames from a time-lapse movie of a mouse fibroblast spreading on an array of 2-μm-diameter pillars coated with fibronectin (cell borders marked by the white line). Right: When the cell forms adhesions on the pillars, it pulls on them; pillar displacement (δECM) can be observed by tracking their tops over time. (B) Means ± SEM of the time-dependent contractile forces [F(t, kECM); left] and pillar displacement [δECM(t) = F(t, kECM)/kECM; right] on pillars of three widely different rigidities (corresponding to different pillar heights, the rigidity values appear on the legend). For all cell lines tested, δECM(t) = F(t, kECM)/kECM collapsed onto a single master curve (right). n > 50 pillars from >8 cells in each case. (C) Averages of the pillar displacement data from all three rigidities [(B), right] reveal cell-specific contractile displacements.
Fig. 3
Fig. 3. Correlation between F-actin density and pillar displacement.
(A) Micrograph of a mouse fibroblast (WT-MEF) expressing tdTomato-tractin and spreading on 2-μm-diameter pillars. (B) Example of low-pass–filtered curves of pillar displacement and of tractin intensity around the same pillar over time. (C) Mean correlation coefficients of pillar displacement and tractin intensity such as in (B). n > 30 from >5 cells in each case. The amplitude of the displacement noise, obtained by measuring the magnitude of the displacement (irrespective of its direction) of a pillar that was not in contact with the cell throughout the experiment, is added for reference. (D) Non–low-pass–filtered pillar displacement and tractin intensity over time curves reveal simultaneous oscillations in both. Inset shows the same data (starting from the initial rise of both signals) after subtraction of the low-pass filter curves in each case (i.e., minus the so-called direct current component). Colors are as in (B) (see legend there). (E) Mean frequency of pillar displacement oscillations. The frequency was calculated using Fourier transform. Tractin oscillated at a similar frequency in all cases (not shown). (F) Mean correlation coefficients of actin and myosin density between the pillars.
Fig. 4
Fig. 4. Structural differences in F-actin organization correlate with displacement response to CF−actin(t).
(A) The rate of change (in percentage) of δECM, which quantifies d∆/dt, as a function of rate of change (in percentage) of CF-actin, which quantifies dCF−actin/dt. Measurements were taken during each rise in the simultaneous oscillations (Fig. 3D), averaged for each rigidity (n > 60 data points from >15 pillars from >4 cells in each case), and all data points from all three rigidities are plotted here for WT-MEFs and MDA-MB-231 cells. For visual clarity, the α-act KD data (which are closer to those of WT-MEFs than to these of MDA-MB-231 cells) are not shown. (B) Processed super-resolution images of large actin filaments at the cell edge color-coded for angles (see Materials and Methods for details). Only part of the cell edge is shown in each case; the right side of each image is outside of the cell. α-act KD cells displayed similar fiber distribution to that of WT-MEFs (not shown). (C) Ratio between the area occupied by the large actin fibers and the interpillar area at the cell edge. MDA-MB-231 networks were ~50% denser compared to WT-MEFs (P < 0.001). (D) WT-MEFs display highly parallel fibers compared to MDA-MB-231. Images such as those shown in (B) were analyzed as follows: The largest 800 fibers in each image were arranged according to size in ascending order, and the interfiber slope differences were calculated for each fiber against all other fibers in each image. These differences are represented here by color-coded plots. The images shown are the average of 40 images in each case. Lower values (blue hues) represent parallel fibers. α-act KD showed a similar distribution to that of WT-MEFs (not shown).
Fig. 5
Fig. 5. Cells at steady-state generate rigidity-independent contractile displacements that are six- to sevenfold larger than early spreading displacements.
(A) F(t, kECM) and δECM(t) = F(t, kECM)/kECM curves (left and right, respectively) of REF52 cells under well-spread steady-state conditions. (B) δECM(t) of early spreading REF52 cells (cf. Fig. 2C) versus δECM(t) of REF52 under well-spread steady-state conditions (cf. panel A). (C and D) Z-stack projections of REF52 cells on pillars (31 pN/nm) stained for F-actin color-coded for depth; (C) cell after 5 hours of spreading. The brightness of the region marked by white borders was enhanced for purpose of clarity. Thick actin stress fibers (yellow-orange hues) are observed 2 to 4 μm above the fibers directly surrounding the pillar (blue hues). (D) Cell after 30 min of spreading. No stress fibers are observed, and the actin structures are much less organized compared to steady-state condition (C).

References

    1. Iskratsch T., Wolfenson H., Sheetz M. P., Appreciating force and shape—The rise of mechanotransduction in cell biology. Nat. Rev. Mol. Cell Biol. 15, 825–833 (2014). - PMC - PubMed
    1. Lo C. M., Wang H. B., Dembo M., Wang Y. L., Cell movement is guided by the rigidity of the substrate. Biophys. J. 79, 144–152 (2000). - PMC - PubMed
    1. Prager-Khoutorsky M., Lichtenstein A., Krishnan R., Rajendran K., Mayo A., Kam Z., Geiger B., Bershadsky A. D., Fibroblast polarization is a matrix-rigidity-dependent process controlled by focal adhesion mechanosensing. Nat. Cell Biol. 13, 1457–1465 (2011). - PubMed
    1. Wang H.-B., Dembo M., Wang Y.-L., Substrate flexibility regulates growth and apoptosis of normal but not transformed cells. Am. J. Physiol. Cell Physiol. 279, C1345–C1350 (2000). - PubMed
    1. Chaudhuri O., Koshy S. T., Branco da Cunha C., Shin J. W., Verbeke C. S., Allison K. H., Mooney D. J., Extracellular matrix stiffness and composition jointly regulate the induction of malignant phenotypes in mammary epithelium. Nat. Mater. 13, 970–978 (2014). - PubMed

Publication types