. 2020 May 6;6(19):eaaz2433.
doi: 10.1126/sciadv.aaz2433. eCollection 2020 May.

A hexavalent Coxsackievirus B vaccine is highly immunogenic and has a strong protective capacity in mice and nonhuman primates

Affiliations

A hexavalent Coxsackievirus B vaccine is highly immunogenic and has a strong protective capacity in mice and nonhuman primates

V M Stone et al. Sci Adv. .

Abstract

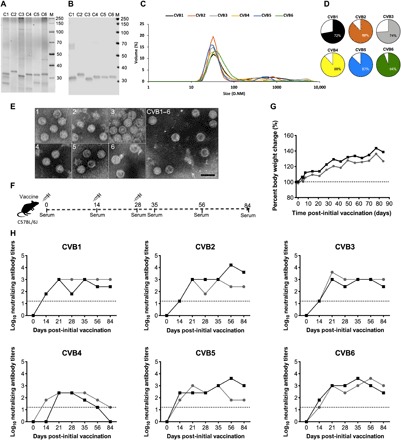
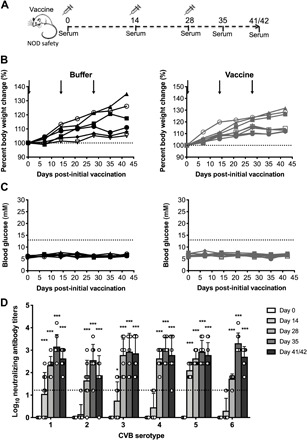
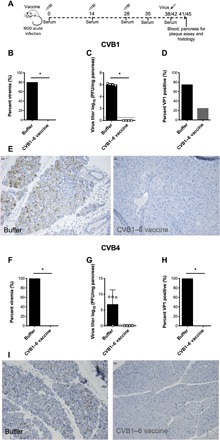
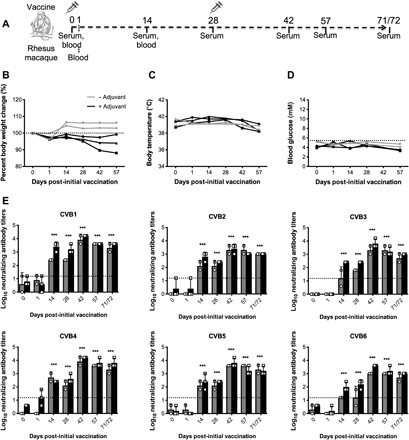
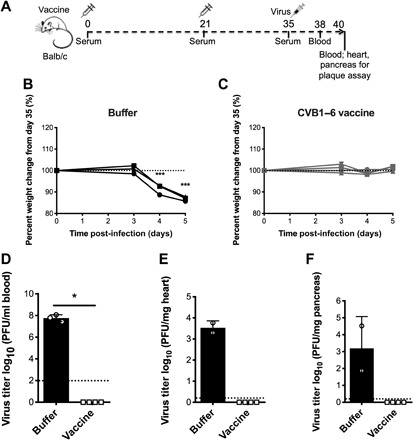
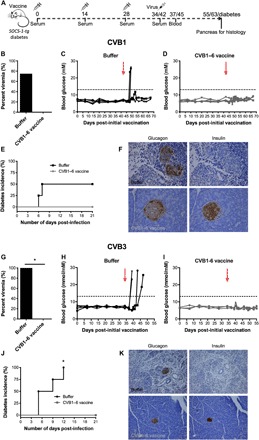
Coxsackievirus B (CVB) enteroviruses are common human pathogens known to cause severe diseases including myocarditis, chronic dilated cardiomyopathy, and aseptic meningitis. CVBs are also hypothesized to be a causal factor in type 1 diabetes. Vaccines against CVBs are not currently available, and here we describe the generation and preclinical testing of a novel hexavalent vaccine targeting the six known CVB serotypes. We show that the vaccine has an excellent safety profile in murine models and nonhuman primates and that it induces strong neutralizing antibody responses to the six serotypes in both species without an adjuvant. We also demonstrate that the vaccine provides immunity against acute CVB infections in mice, including CVB infections known to cause virus-induced myocarditis. In addition, it blocks CVB-induced diabetes in a genetically permissive mouse model. Our preclinical proof-of-concept studies demonstrate the successful generation of a promising hexavalent CVB vaccine with high immunogenicity capable of preventing CVB-induced diseases.


Figures

Fig. 1
Fig. 1. Characterization of inactivated CVB1–6 viruses, experimental setup, and vaccine safety and immunogenicity in C57BL/6J mice.
CVB1–6 viruses were propagated in Vero cells, purified, inactivated with formalin, and then characterized as described in Materials and Methods. (A) Analysis of CVB1–6 total protein and virus protein content (2 μg of virus per well) by SDS-PAGE followed by (B) Western blot analysis using the in-house produced rat monoclonal antibody 3A6, which binds to the CVB1–6 viral capsid protein VP1. (C) DLS analysis of the inactivated CVB1–6 serotypes. D.NM is the diameter in nm of the particles. (D) Volume distribution (percentages) of the most prominent particle populations in the vaccine preparations as measured by DLS analysis. (E) TEM analysis of individual inactivated CVB1–6 vaccine components (serotypes are indicated by the number in the top left-hand corner of each image) and the vaccine mix (CVB1–6). Scale bar, 50 nm. (F) Experimental setup for the C57BL/6J CVB1–6 vaccine studies. (G and H) Two female C57BL/6J mice (age 7.8 weeks), represented by individual lines, were vaccinated on days 0, 14, and 28 with CVB1–6 vaccine (1-μg dose of each serotype, 150 μl, interscapularly). (G) Percentage body weight change from the first vaccination (day 0); the dotted line indicates the weight on day 0. (H) CVB nAB titers in the serum of mice after vaccination. The dotted lines show the positivity cutoff for the method. C1, CVB1; C2, CVB2; C3, CVB3; C4, CVB4; C5, CVB5; C6, CVB6.
Fig. 2
Fig. 2. Safety and immunogenicity of CVB1–6 vaccine in NOD mice.
Male and female NOD mice (5 to 9 weeks old) were mock-vaccinated with vaccine buffer (150 μl, interscapularly; n = 6) or vaccinated with CVB1–6 vaccine (1 μg of each serotype in 150 μl, interscapularly; n = 8) on days 0, 14, and 28, as demonstrated in the schematic shown in (A). (B) Percentage body weight change compared to the weight on day 0 (indicated by dotted line). Buffer-treated animals are shown in black, and CVB1–6–vaccinated mice are indicated in gray. The black arrows show the vaccination time points. No statistically significant differences in percentage weight change were detected between the buffer-treated and buffer-vaccinated mice at each time point (Mann-Whitney U test). (C) Blood glucose readings of buffer-treated (black) or CVB1–6–vaccinated (gray) mice. The dotted line indicates the cutoff for diabetes. (D) Average CVB1–6 nAB titers in the serum of CVB1–6–vaccinated mice at the indicated time points. Sera from mock-vaccinated animals had no neutralizing capacity. nAB values for each individual mouse are shown by single symbols, and the bars represent means ± SD. The dotted line indicates the positivity cutoff for serum samples. *P < 0.05, ***P < 0.001 compared to day 0 for each respective serotype by two-way analysis of variance (ANOVA) with Bonferroni multiple comparisons.
Fig. 3
Fig. 3. CVB1–6 vaccine protects mice from acute CVB1 and CVB4 infections.
Female NOD mice (4 to 6 weeks old) were mock-vaccinated (vaccine buffer; 150 μl, interscapularly) or CVB1–6–vaccinated (1 μg of each serotype, interscapularly) on days 0, 14, and 28 and then challenged with CVB1 [106 plaque-forming units (PFU) per mouse, intraperitoneally] or CVB4 (105 PFU per mouse, intraperitoneally) on days 42 and 38, respectively, as shown in the experimental schematic in (A). (B and F) Percentage of mock-vaccinated (CVB1, n = 5; CVB4, n = 4) and CVB1–6–vaccinated (CVB1, n = 4; CVB4, n = 4) mice with viremia on day 3 after infection (measured by standard plaque assay). *P < 0.05, one-way Fisher’s exact test. (C and G) Replicating virus in the pancreas on day 3 after infection of CVB1-infected (C) or CVB4-infected (G) mice (measured by standard plaque assay). Virus titers for each mouse are shown individually. Bars represent means ± SD. The dotted line shows the limit of detection for the assay. *P < 0.05 comparing the two groups by Mann-Whitney U test. (D and H) Percentage of pancreas sections positive for VP1 by immunohistochemical staining on day 3 after infection in CVB1-infected (D) and CVB4-infected (H) mice. *P < 0.05, one-way Fisher’s exact test. (E and I) Representative VP1 staining in pancreas of mice infected with CVB1 (E) or CVB4 (I). Magnification, ×16; scale bars, 20 μm. In (C) and (D), n = 4 in the buffer-treated group, as one NOD mouse was kept for longer to ensure that SOCS-1-tg animals were not single-housed.
Fig. 4
Fig. 4. CVB1–6 vaccine is safe in rhesus macaques and induces strong immunity against all six CVB serotypes.
Rhesus macaques were immunized with CVB1–6 vaccine (5 μg of each CVB serotype) without adjuvant (n = 2, gray lines/bars) or CVB1–6 vaccine (5 μg of each CVB serotype) + alum adjuvant (0.2% final concentration; n = 3, black lines/bars) on days 0 and 28 by intramuscular injection, as shown in the schematic in (A). (B) Percentage weight changes compared to day 0 (prime vaccination), (C) body temperature, and (D) blood glucose values of animals [in (B), the dotted line shows the % weight at day 0, and in (C), the dotted line indicates the blood glucose concentration threshold for overt diabetes in rhesus macaques after fasting]. No statistically significant differences in the weights, temperatures, or blood glucose values were found when comparing the different time points to day 0 (two-way ANOVA with Bonferroni correction). (E) CVB1–6 nAB titers in the serum as measured by standard neutralization assay. The dotted line shows the limit of detection. nAB values for each individual animal are shown by single symbols, and the bars represent means ± SD. Samples without an error bar are all equal in value. ***P < 0.001 comparing the average nAB titer for both groups at each time point to day 0 by two-way ANOVA with Bonferroni correction.
Fig. 5
Fig. 5. CVB1–6 vaccine protects against acute CVB3 infection in Balb/c mice.
Male and female mice Balb/c mice were buffer-treated (150 μl, interscapularly; n = 3; black lines/bars) or vaccinated with CVB1–6 vaccine (1 μg of each serotype; 150 μl, interscapularly; n = 4; gray lines/bars) on days 0 and 21 and challenged with CVB3 (5 × 10⁴ PFU per mouse, intraperitoneally) on day 35 as shown in the schematic in (A). (B and C) Percentage weight change for individual animals compared to day 35 in buffer-treated (B) or CVB1–6–vaccinated mice (C). Dotted line indicates day 35 weight. ***P < 0.001 compared to day 35 weight as measured by one-way ANOVA with Dunnett’s multiple comparison test. Replicating virus in the blood (D) on day 3 post-CVB3 infection or either the pancreas (E) or heart (F) on day 5 after infection, as determined by standard plaque assay [n = 2 for buffer-treated group in (E) and (F), as one animal was found dead on day 5 after infection]. Virus titers for individual mice have individual symbols, and the bars show means ± SD. The dotted lines show the limit of detection for the assays. *P < 0.05 comparing the two groups by Mann-Whitney U test. Insufficient n numbers in the buffer group prevented statistical analysis of (E) and (F).
Fig. 6
Fig. 6. CVB1–6 vaccine prevents CVB1- and CVB3-induced diabetes in SOCS-1-tg mice.
Female SOCS-1-tg mice (4 to 6 weeks old) were mock-immunized (vaccine buffer; n = 4 for each study; 150 μl, interscapularly; black bars/lines) or CVB1–6 vaccine–immunized (1 μg of each serotype; n = 4 for CVB1 and n = 3 for CVB3; i.s.; gray bars/lines) on days 0, 14, and 28 and then challenged with CVB1 (106 PFU per mouse, intraperitoneally; top) or CVB3 (106 PFU per mouse, intraperitoneally; bottom) on days 42 and 34, respectively, as indicated in the schematic shown in (A). (B and G) Percentage of mock and vaccinated mice with viremia on day 3 after infection. *P < 0.05 comparing the two groups by Fisher’s exact test. (C, D, H, and I) Blood glucose values in buffer-vaccinated (C and H; both n = 4) and CVB1–6–vaccinated (D and I; n = 4 and n = 3, respectively) mice. Arrows indicate CVB infection, and dotted lines show diabetes limit. (E and J) Diabetes incidence curves in mock- and CVB1–6–vaccinated mice infected with CVB1 (E) or CVB3 (J). *P < 0.05 comparing the two groups by Fisher’s exact test. (F and K) Representative immunohistochemical glucagon (left) and insulin (right) staining in pancreas from mock (top panels) and CVB1–6–vaccinated (bottom panels) mice infected with CVB1 (F) or CVB3 (K). Pancreas was collected at diabetes onset or on day 21 after infection. Magnification, ×40 (F) and ×16 (K). Scale bars, 20 μm.

References

    1. Abedi G. R., Watson J. T., Nix W. A., Oberste M. S., Gerber S. I., Enterovirus and parechovirus surveillance—United States, 2014–2016. MMWR Morb. Mortal. Wkly. Rep. 67, 515–518 (2018). - PMC - PubMed
    1. Tavakoli N. P., Wang H., Nattanmai S., Dupuis M., Fusco H., Hull R., Detection and typing of enteroviruses from CSF specimens from patients diagnosed with meningitis/encephalitis. J. Clin. Virol. 43, 207–211 (2008). - PubMed
    1. Hong J., Kang B., Yeo S., Jee Y., Park J.-H., Pathogenesis of coxsackievirus B2 in mice: Characterization of clinical isolates of the coxsackievirus B2 from patients with myocarditis and aseptic meningitis in Korea. J. Vet. Sci. 18, 457–464 (2017). - PMC - PubMed
    1. Fairweather D., Stafford K. A., Sung Y. K., Update on coxsackievirus B3 myocarditis. Curr. Opin. Rheumatol. 24, 401–407 (2012). - PMC - PubMed
    1. Pollack A., Kontorovich A. R., Fuster V., Dec G. W., Viral myocarditis—Diagnosis, treatment options, and current controversies. Nat. Rev. Cardiol. 12, 670–680 (2015). - PubMed

Publication types

Substances

LinkOut - more resources