. 2020 May 6;6(19):eaba1269.
doi: 10.1126/sciadv.aba1269. eCollection 2020 May.

Life cycle of a cyanobacterial carboxysome

Affiliations

Life cycle of a cyanobacterial carboxysome

Nicholas C Hill et al. Sci Adv. .

Abstract

Carboxysomes, prototypical bacterial microcompartments (BMCs) found in cyanobacteria, are large (~1 GDa) and essential protein complexes that enhance CO2 fixation. While carboxysome biogenesis has been elucidated, the activity dynamics, lifetime, and degradation of these structures have not been investigated, owing to the inability of tracking individual BMCs over time in vivo. We have developed a fluorescence-imaging platform to simultaneously measure carboxysome number, position, and activity over time in a growing cyanobacterial population, allowing individual carboxysomes to be clustered on the basis of activity and spatial dynamics. We have demonstrated both BMC degradation, characterized by abrupt activity loss followed by polar recruitment of the deactivated complex, and a subclass of ultraproductive carboxysomes. Together, our results reveal the BMC life cycle after biogenesis and describe the first method for measuring activity of single BMCs in vivo.


Figures

Fig. 1
Fig. 1. Controlling carboxysome expression.
(A) Constitutively expressed RbcL-GFP allows for RuBisCO visualization. The native ccm operon (ccmK2K1LMN) was knocked out, producing the HCR strain Dccm. An IPTG-inducible version of the ccm operon was reintroduced to create the Dccm+ strain, resulting in IPTG-dependent carboxysome expression and growth rescue in ambient CO2. (B) Family tree of Dccm+ cells after IPTG removal in ambient CO2. A dying cell is indicated with a dashed white outline. Carboxysomes in this cell remain static and brightly fluorescent throughout the experiment, indicating that photobleaching has a negligible effect on GFP intensity within the time span of the experiment. (C) Family tree of Dccm+ cells after IPTG removal in elevated CO2. (D to F) Population-level characterization of growth of the Dccm+ strain upon IPTG removal in ambient CO2. (D) Average number of carboxysomes per cell decreases as cells divide, diluting preexisting carboxysomes among the growing population. (E) Growth rate is proportional to average number of carboxysomes within a cell. n = 191, 108, 207, 604, and 259 for 4+, 3, 2, 1, and 0 carboxysomes, respectively. One-way analysis of variance (ANOVA) with Tukey-Kramer multiple comparison test was used for statistics (see Materials and Methods). ****P < 0.0001. (F) Growth rate versus generation number. Cells with 3+, 2, 1, and 0 carboxysomes are indicated in cyan, purple, red, and yellow, respectively. See fig. S3 (A to D) for colors plotted separately.
Fig. 2
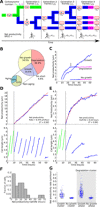
Fig. 2. Population-wide classification and activity dynamics of individual carboxysomes.
(A) Diagram of a ∆ccm+ family tree. The single-carboxysome tree starts at the cell indicated with an asterisk. Net productivity is calculated for each frame of the single-carboxysome tree. Green, blue, and magenta colors indicate 2+, 1, or 0 carboxysomes, respectively, present at that time in the tree. This color scheme applies in (C) to (E). (B) Breakdown of 452 single-carboxysome trees into clusters. The growth cluster was further split into aging and nonaging. (C) Net productivity traces for single-carboxysome trees in the no growth, growth, and degradation clusters. The arrow points to the frame in the degradation cluster trace that separates its growth and no-growth phases. (D and E) Net productivity (top) and cell lengths (bottom) for an ultraproductive, nonaging single-carboxysome tree (D), and an aging single-carboxysome tree (E). The cell lengths correspond only to the lineage containing the carboxysome. The dotted line indicates the first frame of the single-carboxysome tree. Linear (D) and exponential decay (E) fits for net productivity are in red. (F) Histogram of net productivity half-lives for all aging trees. Mean, 20.6 hours; SD, ±15.1 hours; median, 16.8 hours. (G) Net productivity rates for cells in the growth cluster, no-growth cluster, and the growth and no-growth phases of cells in the degradation cluster.
Fig. 3
Fig. 3. Loss of carboxysome-associated CO2 fixation is the direct cause of growth arrest.
(A) Diagram of CO2 rescue after IPTG removal. Cyan carboxysomes located in the cytoplasm are functional, whereas black carboxysomes located at a cell pole are nonfunctional. Red dotted lines indicate that a cell is not growing. The cluster of the single-carboxysome tree of each cell present during the CO2 increase is indicated above the cell. The cell labeled Growth′ belongs to the growth cluster but did not inherit that single-carboxysome tree’s carboxysome. (B to E) Cell lengths over time for a lineage in the growth cluster that contains (B) or does not contain (C) that single-carboxysome tree’s carboxysome during the CO2 increase. Cell lengths over time for a lineage in the degradation cluster (D) and the no-growth cluster during the CO2 increase (E). Cell length traces in green, blue, and magenta indicate that 2+, 1, or 0 carboxysomes, respectively, are present at that time in the lineage. Vertical red lines indicate the time (42 hours) at which the CO2 concentration was increased.
Fig. 4
Fig. 4. RuBisCO changes localization upon carboxysome inactivation.
(A) Kymogram (top) with corresponding trace of cell length over time (bottom); blue and magenta colors indicate 1 or 0 carboxysomes in the cell, respectively. Inset picture indicates slice of a cell shown for each time point in kymogram. Only the GFP channel (cyan) is shown. (B) Diagram (top) and examples (bottom) of carboxysomes localized to either the cytoplasm or a cell pole. Red, chlorophyll; cyan, GFP. (C) Localization of carboxysomes from different clusters (n = 12, growth cluster; n = 22, no growth cluster; n = 31, degradation cluster). (D) Cell length over time for a cell that starts with two carboxysomes (green) and ends with one (blue). Dashed lines indicate predicted growth had the carboxysome not degraded (steep dashed line) or if the cell only had one carboxysome to start with (shallow dashed line). (E) Model of carboxysome life cycle, including assembly of shell proteins at the pole-associated procarboxysome (1), followed by functional carboxysomes supporting many generations of cell growth (2), shell breakage/carboxysome inactivation (3), and recruitment of RuBisCO to a cell pole (4). The dashed arrow in step (3) indicates that multiple mechanisms of carboxysome inactivation could be involved, including shell breakage. The dashed arrow in step (4) indicates that RuBisCO is recruited to a pole (or developing pole at mid-cell) but may be distinct from the procarboxysome assembly intermediate.

References

    1. Axen S. D., Erbilgin O., Kerfeld C. A., A taxonomy of bacterial microcompartment loci constructed by a novel scoring method. PLOS Comput. Biol. 10, e1003898 (2014). - PMC - PubMed
    1. Jorda J., Lopez D., Wheatley N. M., Yeates T. O., Using comparative genomics to uncover new kinds of protein-based metabolic organelles in bacteria. Protein Sci. 22, 179–195 (2013). - PMC - PubMed
    1. Rae B. D., Long B. M., Badger M. R., Price G. D., Functions, compositions, and evolution of the two types of carboxysomes: Polyhedral microcompartments that facilitate CO2 fixation in cyanobacteria and some proteobacteria. Microbiol. Mol. Biol. Rev. 77, 357–379 (2013). - PMC - PubMed
    1. Turmo A., Gonzalez-Esquer C. R., Kerfeld C. A., Carboxysomes: Metabolic modules for CO2 fixation. FEMS Microbiol. Lett. 364, fnx176 (2017). - PubMed
    1. Price G. D., Badger M. R., Evidence for the role of carboxysomes in the cyanobacterial CO2 -concentrating mechanism. Can. J. Bot. 69, 963–973 (1991).

Publication types

LinkOut - more resources