. 2020 Aug;14(8):1850-1867.
doi: 10.1002/1878-0261.12735. Epub 2020 Jun 29.

STAT3-mediated MLST8 gene expression regulates cap-dependent translation in cancer cells

Affiliations

STAT3-mediated MLST8 gene expression regulates cap-dependent translation in cancer cells

Hyunji Lee et al. Mol Oncol. 2020 Aug.

Abstract

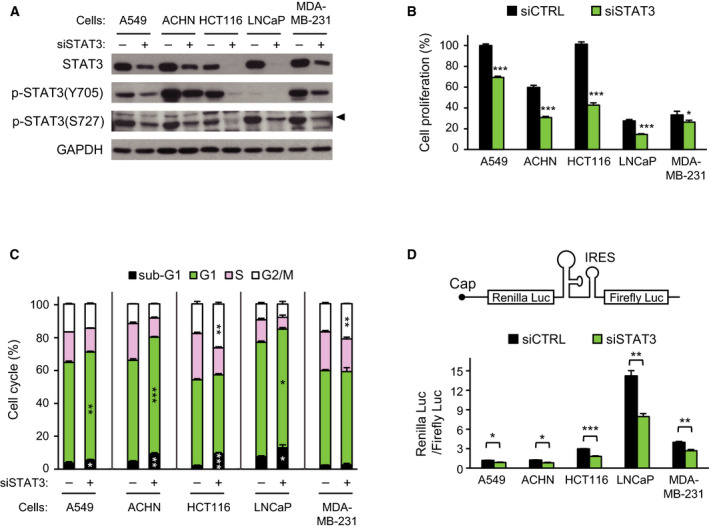
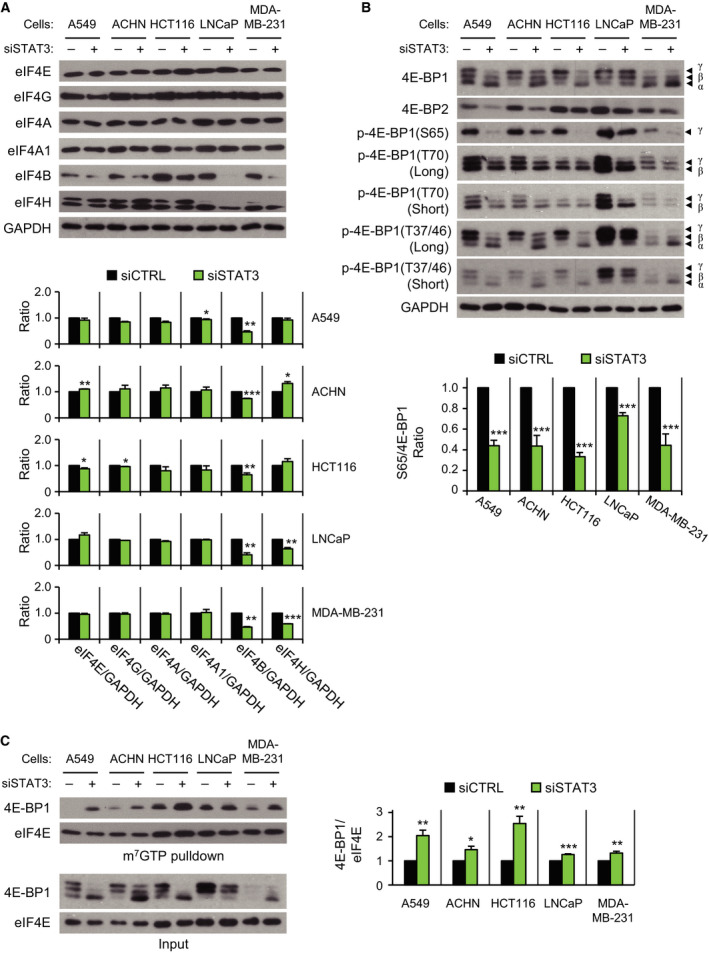
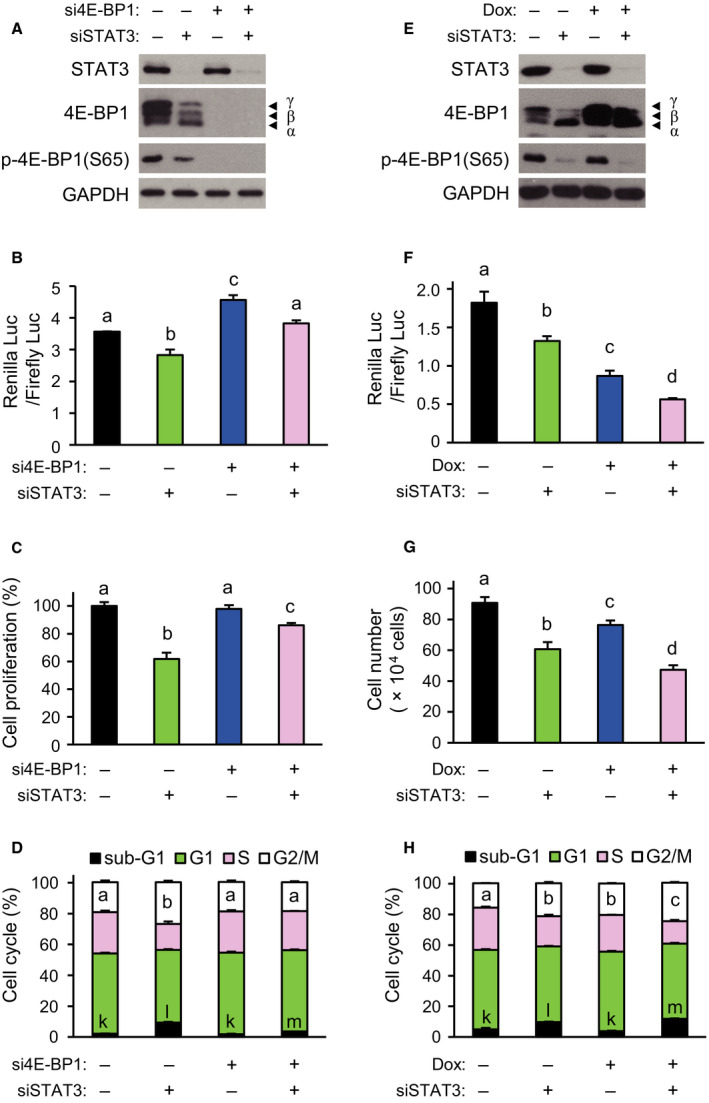
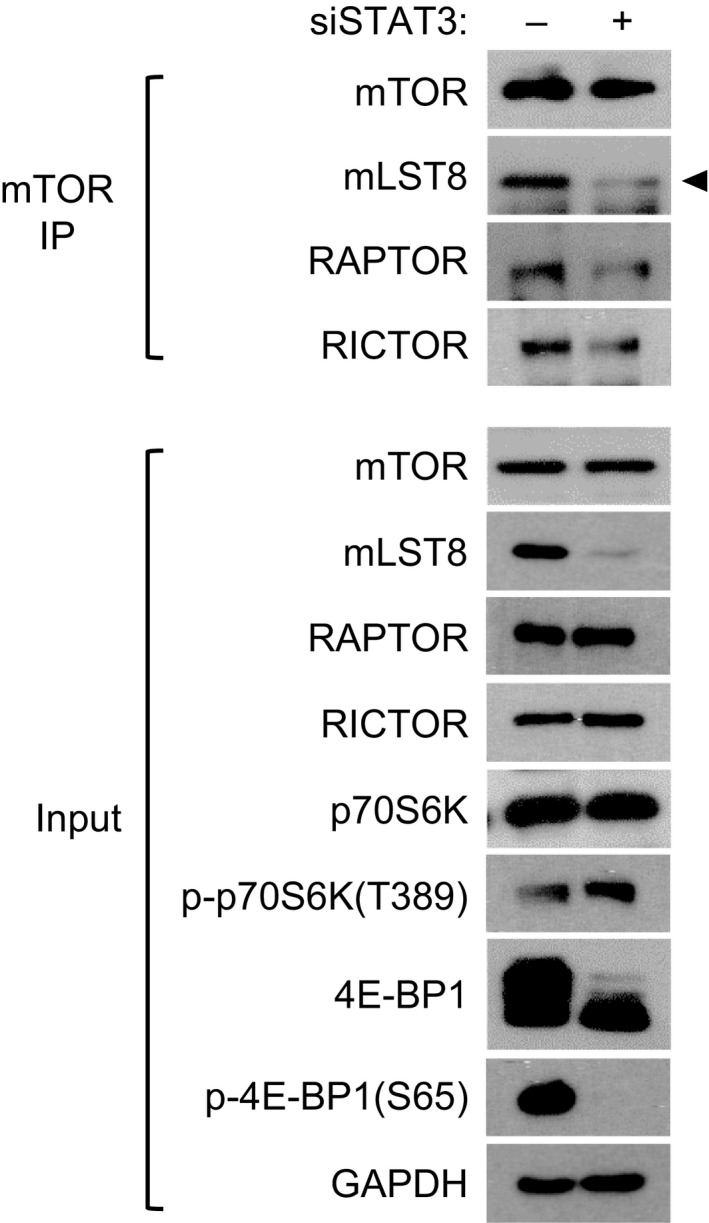
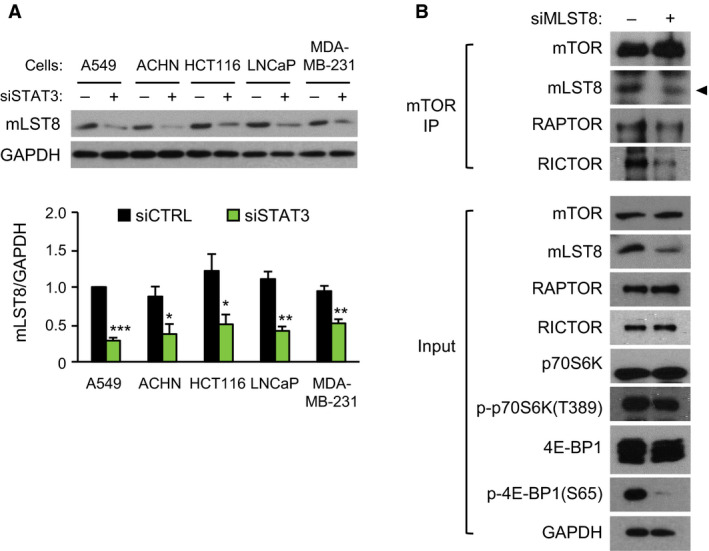
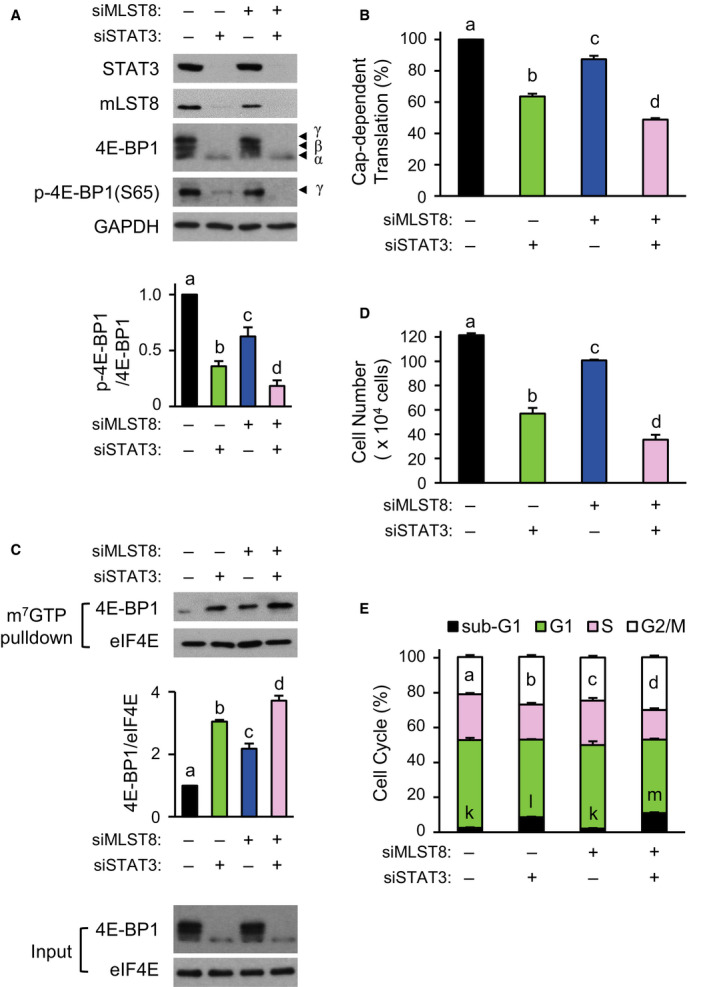
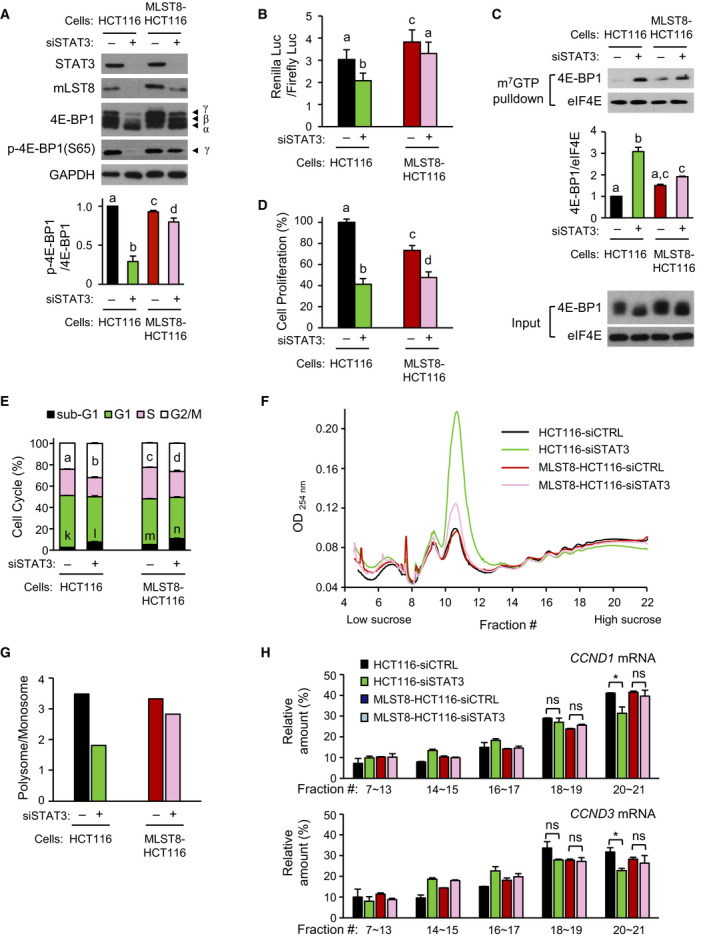
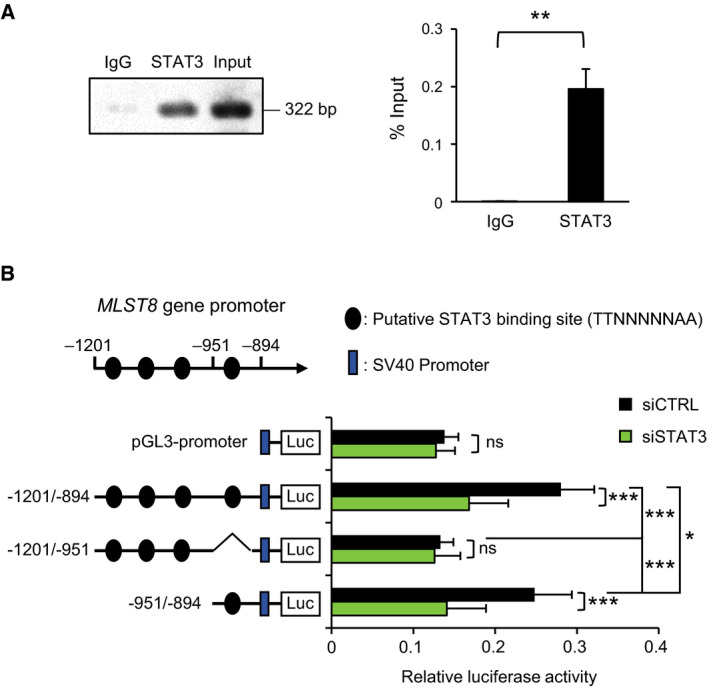
Signal transducer and activator of transcription 3 (STAT3) regulates cell growth, cell survival, angiogenesis, metastasis of cancer cells, and cancer immune evasion by regulating gene expression as a transcription factor. However, the effect of STAT3 on translation is almost unknown. We demonstrated that STAT3 acts as a trans-acting factor for MLST8 gene expression and the protein level of mLST8, a core component of mechanistic target of rapamycin complex 1 and 2 (mTORC1/2), positively regulates the mTORC1/2 downstream pathways. Suppression of STAT3 by siRNA attenuated 4E-BP1 phosphorylation, cap-dependent translation, and cell proliferation in a variety of cancer cells. In HCT116 cells, STAT3 knockdown-induced decreases in 4E-BP1 and AKT phosphorylation levels were further attenuated by MLST8 knockdown or recovered by mLST8 overexpression. STAT3 knockdown-induced G2/M phase arrest was partially restored by co-knockdown of 4EBP1, and the attenuation of cell proliferation was enhanced by the expression of an mTORC1-mediated phosphorylation-defective mutant of 4E-BP1. ChIP and promoter mapping using a luciferase reporter assay showed that the -951 to -894 bp of MLST8 promoter seems to include STAT3-binding site. Overall, these results suggest that STAT3-driven MLST8 gene expression regulates cap-dependent translation through 4E-BP1 phosphorylation in cancer cells.

Keywords: 4E-BP1; MLST8; STAT3; cross-talk; mTORC1.


Conflict of interest statement

The authors declare no conflict of interest.

Figures

Fig. 1
Fig. 1
Inhibitory effect of STAT3 knockdown on cell proliferation and cap‐dependent translation. Cancer cells were treated with 5 nm of siCTRL (−) or siSTAT3 (+) for 72 h. (A) Equal amounts of extracts were analyzed by western blotting with the antibodies indicated. (B) Relative cell proliferation of each group measured by WST‐1 assay was compared with the siCTRL group of A549 (n = 4). (C) Cell cycle distribution was analyzed with FACS (n = 3). (D) Diagram of bicistronic luciferase reporter is shown (top). Luciferase activities were measured by a dual‐luciferase assay, and the Renilla/firefly luciferase luminescence ratio was calculated for cap‐dependent translational activity (n = 4). Data are presented as mean ± SEM. Statistically significant differences are marked with *P < 0.05, **P < 0.01, and ***P < 0.001, respectively (t‐test).
Fig. 2
Fig. 2
STAT3 knockdown‐induced change in factors related to cap‐dependent translation initiation. Cancer cells were treated with 5 nm of siCTRL (−) or siSTAT3 (+) for 72 h. (A, B) Western blotting was performed using indicated antibodies (top). The band intensity of siSTAT3 group was normalized to that of siCTRL group in each cell line (bottom; n = 2–6). Long, long exposure; Short, short exposure. (C) Cell lysates were precipitated with m7GTP agarose beads, and eluted complexes were analyzed by western blotting with the antibodies indicated (left). The relative intensity of 4E‐BP1 to eIF4E of siSTAT3 group was compared with that of siCTRL group in each cell line (right; n = 4). Data are presented as mean ± SEM. Statistically significant differences are marked with *P < 0.05, **P < 0.01, and ***P < 0.001, respectively (t‐test).
Fig. 3
Fig. 3
STAT3‐dependent modulation of 4E‐BP1 phosphorylation in HCT116 cells. In A to D, cancer cells were treated with 5 nm of siSTAT3 or 2 nm of si4EBP1 for 72 h (−, treatment with siCTRL; +, siSTAT3 or si4EBP1). (A) Western blotting was performed using equal amounts of extracts with the antibodies indicated. (B) The Renilla/firefly luciferase luminescence ratio was calculated for cap‐dependent translational activity (n = 3). (C) Cell proliferation was measured by WST‐1 assay (n = 3). (D) Cell cycle distribution was analyzed with FACS. (E–H) Cells were transfected with siSTAT3, and the cells were further transfected 24 h after siRNA transfection with a bicistronic luciferase reporter and 4E‐BP1 dominant‐active mutant vector, followed by doxycycline treatment for 48 h before harvesting cells. (E) Western blotting was performed using indicated antibodies. (F) The Renilla/firefly luciferase luminescence ratio was calculated for cap‐dependent translational activity (n = 3). (G) Counting of viable cells (n = 3). (H) Cell cycle distribution was analyzed by FACS (n = 3). Data are presented as mean ± SEM. Bars (B–D and F–H) with different letters are significantly different (P < 0.05), one‐way ANOVA. For D and H, a–c for G2/M; k–m for sub‐G1, respectively.
Fig. 4
Fig. 4
Correlation of STAT3 knockdown‐induced 4E‐BP1 dephosphorylation and downregulation of mTORC1. HCT116 cells were transfected with 5 nm of siSTAT3 or siCTRL for 72 h. Cell lysates were immunoprecipitated with mTOR antibody, followed by western blotting with the indicated antibodies using IP and input samples. Representative images of three independent experiments are shown.
Fig. 5
Fig. 5
Intermediation of mLST8 in STAT3‐dependent 4E‐BP1 phosphorylation. (A) Western blotting (top) and mLST8 protein level were quantified at 72 h after 5 nm of siRNA treatment in human cancer cells. The relative intensity of mLST8 to GAPDH was normalized to that of siCTRL group of A549 (bottom; n = 3). Data are presented as mean ± SEM. Statistically significant differences are marked with *P < 0.05, **P < 0.01, and ***P < 0.001, respectively (t‐test). (B) HCT116 cells were transfected with 5 nm of siCTRL or siMLST8 for 24 h. Equal amounts of HCT116 cell lysates were immunoprecipitated with mTOR antibody. The proteins in the immunoprecipitated and input were analyzed with western blotting using the antibodies indicated. Representative images of three independent experiments are shown.
Fig. 6
Fig. 6
Added effect of STAT3 and MLST8 knockdown on cap‐dependent translation in HCT116 cells. siSTAT3 (5 nm) were transfected into cells for 48 h. The cells were then transfected with siMLST8 (1 nm) for 24 h. (A) Western blotting was performed using equal amounts of extracts with the antibodies indicated (top), and the band intensity of phospho‐4E‐BP1(S65; bottom) was quantified (n = 3). (B) siSTAT3‐transfected cells were further transfected with siMLST8 and bicistronic luciferase reporter to measure luciferase activities. Cap‐dependent translational activity of each group was compared with siCTRL group (n = 3). (C) m7GTP pull‐down assay was performed after serial treatment with siSTAT3 and siMLST8 (top), and the cap‐binding 4E‐BP1 index was determined by the ratio of 4E‐BP1 to eIF4E (bottom; n = 3). (D) Counting of cell numbers (n = 3). (E) Cell cycle distribution was analyzed by FACS (n = 3). Data are presented as mean ± SEM. Different letters (A–E) are significantly different (P < 0.05), one‐way ANOVA. For E, a–d for G2/M; k–m for sub‐G1, respectively.
Fig. 7
Fig. 7
Amelioration of cap‐dependent translation in mLST8‐overexpressed HCT116 cells. (A) siSTAT3 were transfected into control HCT116 and MLST8‐HCT116 cells for 72 h. Western blotting was performed using equal amounts of extracts with indicated antibodies, and the band intensity of phospho‐4E‐BP1(S65; bottom) was quantified (n = 4). (B) siSTAT3 were transfected into cells for 48 h followed by secondary transfection of cells with the bicistronic luciferase reporter for 24 h. Cap‐dependent translational activity of each group was compared with siCTRL group using dual‐luciferase assay (n = 4). (C) m7GTP pull‐down extract was detected by western blotting using indicated antibodies, and the cap‐binding 4E‐BP1 index was determined by the ratio of 4E‐BP1 to eIF4E (bottom; n = 3). (D) Relative cell proliferation was determined by counting the viable cells (n = 3). (E) Cell cycle distribution was analyzed by FACS (n = 3). (F) Cell extract was obtained after 48 h of treatment with 2 nm siRNA, and polysome fractionation was performed. Elution profile was shown by reading absorbance readings at 254 nm. (G) Relative polysome‐to‐monosome ratios in F are shown. (H) RNA was extracted by pooling each fraction as indicated (#7–#13, monosome; #14–#21, polysome), and relative amounts of mRNA in fractions were expressed when the total fractions of CCND1 and CCND3 mRNA were 100% using qRT–PCR (n = 2). The RNA difference in each fraction was normalized using the value of RNA polymerase II (POLR2A) mRNA. Data are presented as mean ± SEM. Statistically significant differences are marked with different letters (A–E; for E, a–d for G2/M; k–n for sub‐G1; P < 0.05) or with *P < 0.05; ns, statistically insignificant, two‐way ANOVA.
Fig. 8
Fig. 8
Identification of STAT3‐binding sites in MLST8 promoter. (A) Protein–DNA complexes from HCT116 cells were precipitated with either STAT3 antibody or normal IgG and the amount of DNA was determined by PCR with primers for promoter regions of the MLST8 gene, followed by agarose electrophoresis (left) or quantitative PCR (right; n = 3). (B) Luciferase reporter assay was performed in HCT116 cells treated with 5 nm of siCTRL or siSTAT3. MLST8 promoter‐luciferase constructs and pCMV3.1‐Renilla vector were transfected 48 h later, and the cells were further incubated for 24 h before harvest. Firefly luciferase activity was normalized with Renilla luciferase activity (n = 4). Data are presented as mean ± SEM. Statistically significant differences are marked with *P < 0.05, **P < 0.01, and ***P < 0.001, respectively; ns, statistically insignificant (A, t‐test; B, two‐way ANOVA).

Similar articles

Cited by

References

    1. Balendran A, Currie R, Armstrong CG, Avruch J and Alessi DR (1999) Evidence that 3‐phosphoinositide‐dependent protein kinase‐1 mediates phosphorylation of p70 S6 kinase in vivo at Thr‐412 as well as Thr‐252. J Biol Chem 274, 37400–37406. - PubMed
    1. Blenis J (2017) TOR, the gateway to cellular metabolism, cell growth, and disease. Cell 171, 10–13. - PubMed
    1. Cao HH, Tse AK, Kwan HY, Yu H, Cheng CY, Su T, Fong WF and Yu ZL (2014) Quercetin exerts anti‐melanoma activities and inhibits STAT3 signaling. Biochem Pharmacol 87, 424–434. - PubMed
    1. Carpenter RL and Lo HW (2014) STAT3 target genes relevant to human cancers. Cancers (Basel) 6, 897–925. - PMC - PubMed
    1. Catena V and Fanciulli M (2017) Deptor: not only a mTOR inhibitor. J Exp Clin Cancer Res 36, 12. - PMC - PubMed

Publication types

MeSH terms