. 2020 Jul 9;48(12):6811-6823.
doi: 10.1093/nar/gkaa477.

5' modifications to CRISPR-Cas9 gRNA can change the dynamics and size of R-loops and inhibit DNA cleavage

Affiliations

5' modifications to CRISPR-Cas9 gRNA can change the dynamics and size of R-loops and inhibit DNA cleavage

Grace Mullally et al. Nucleic Acids Res. .

Abstract

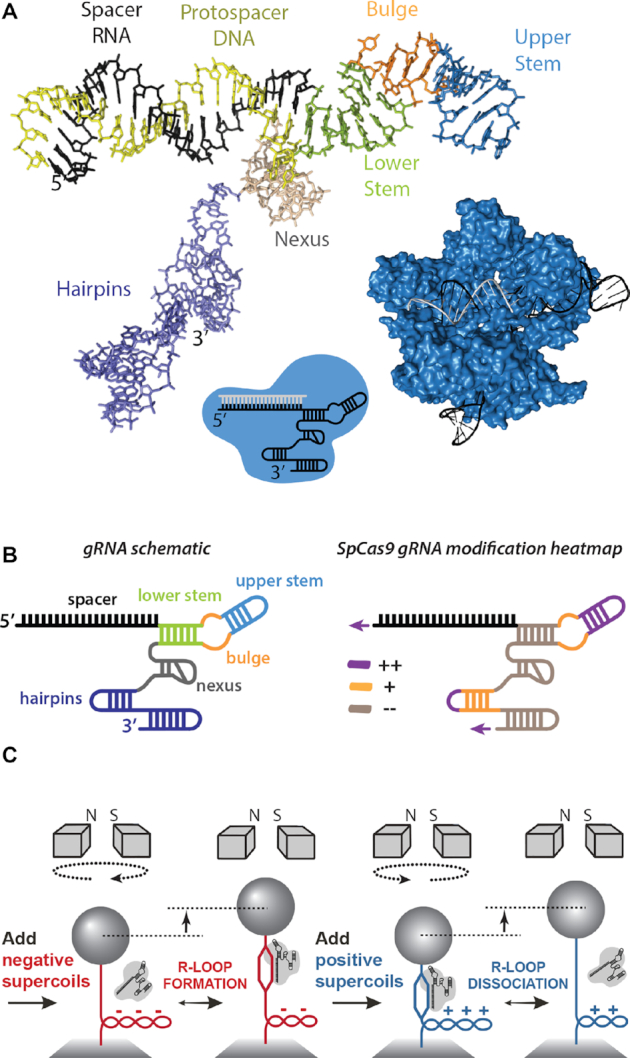
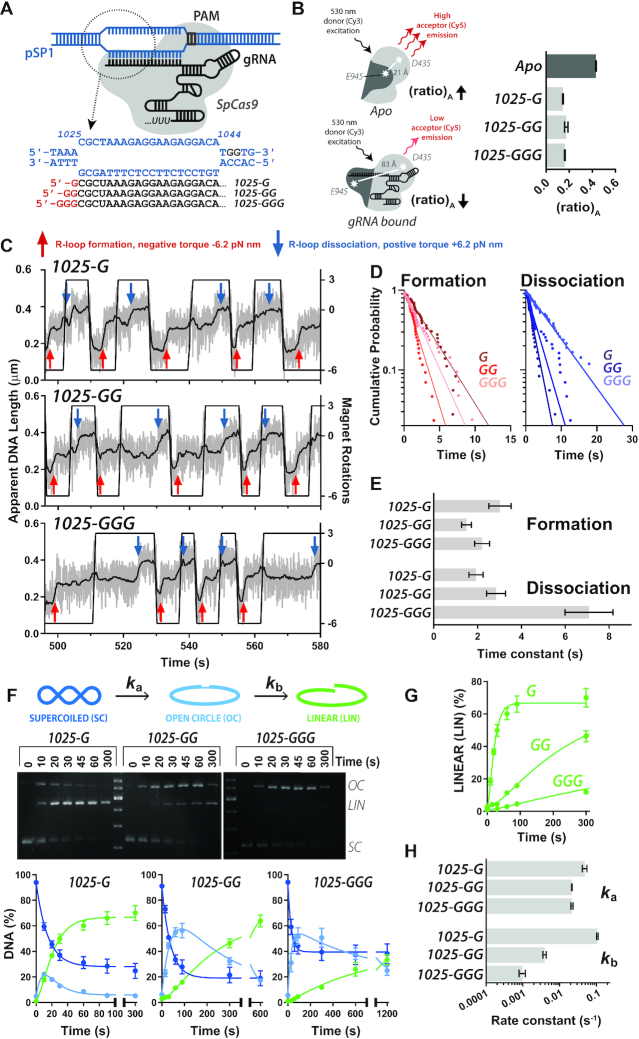
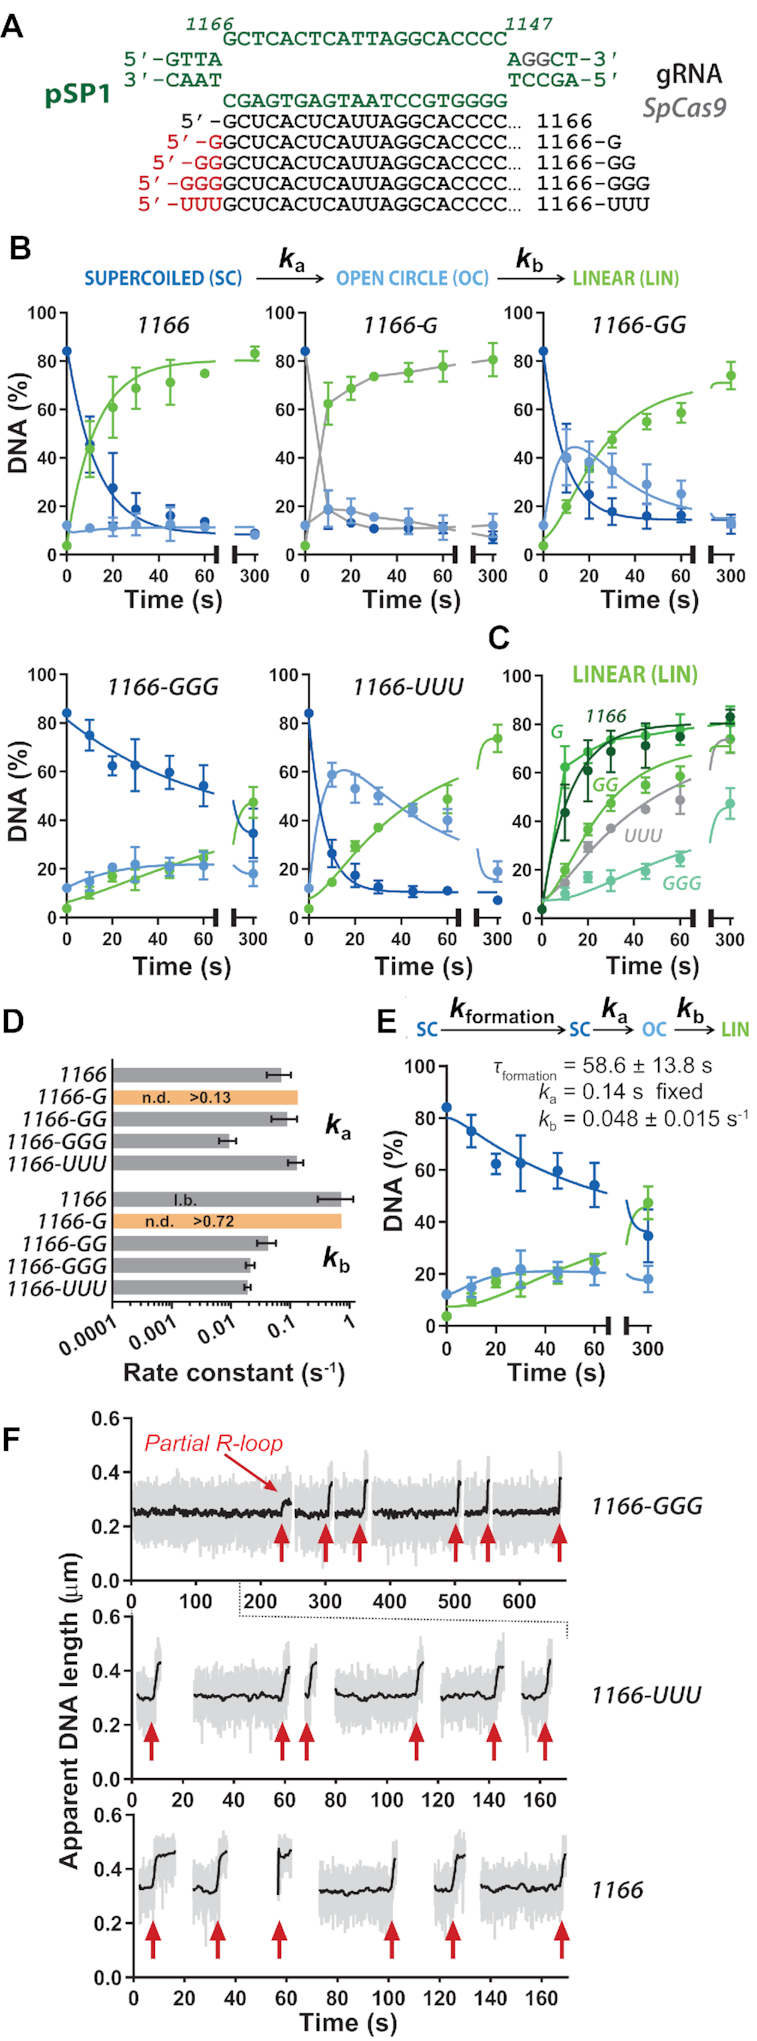
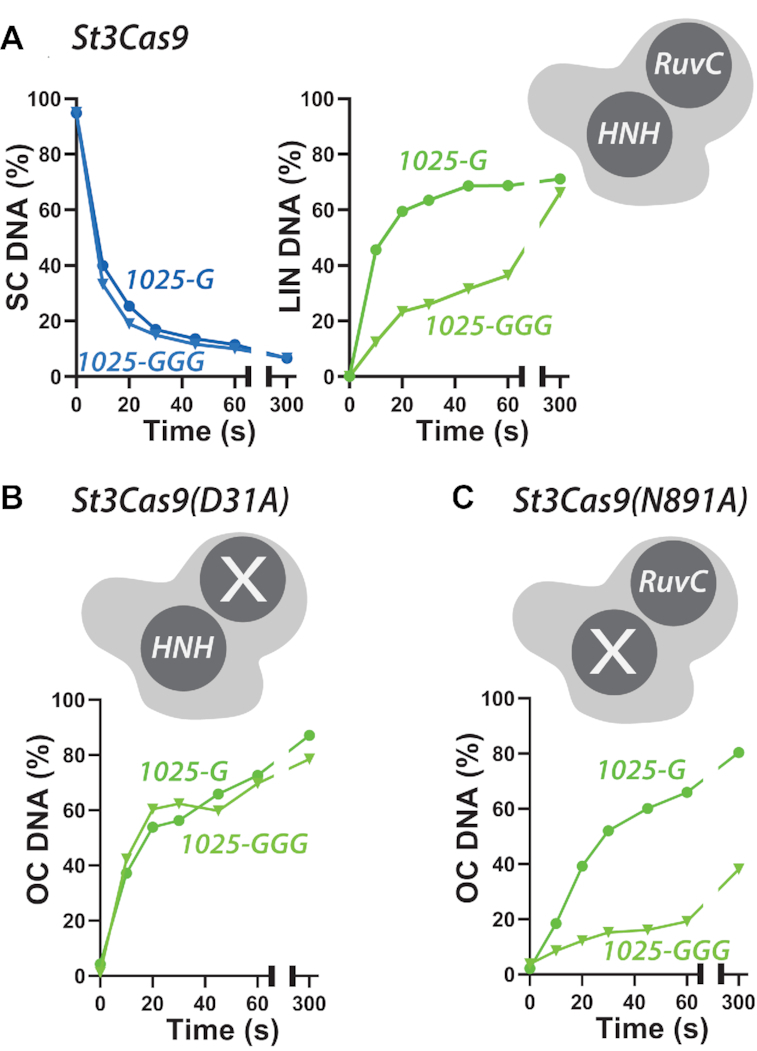
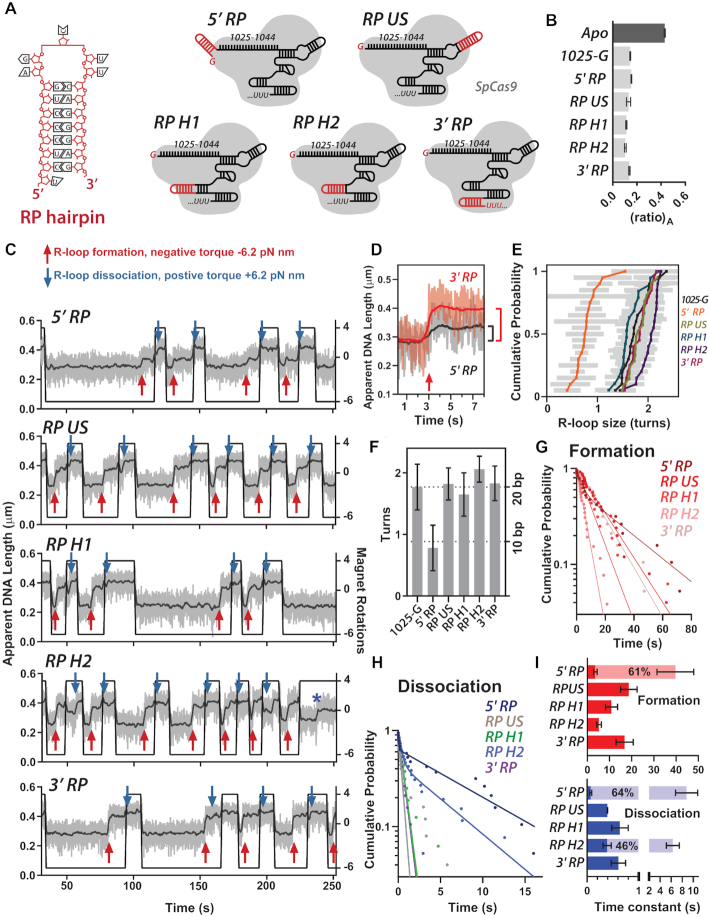
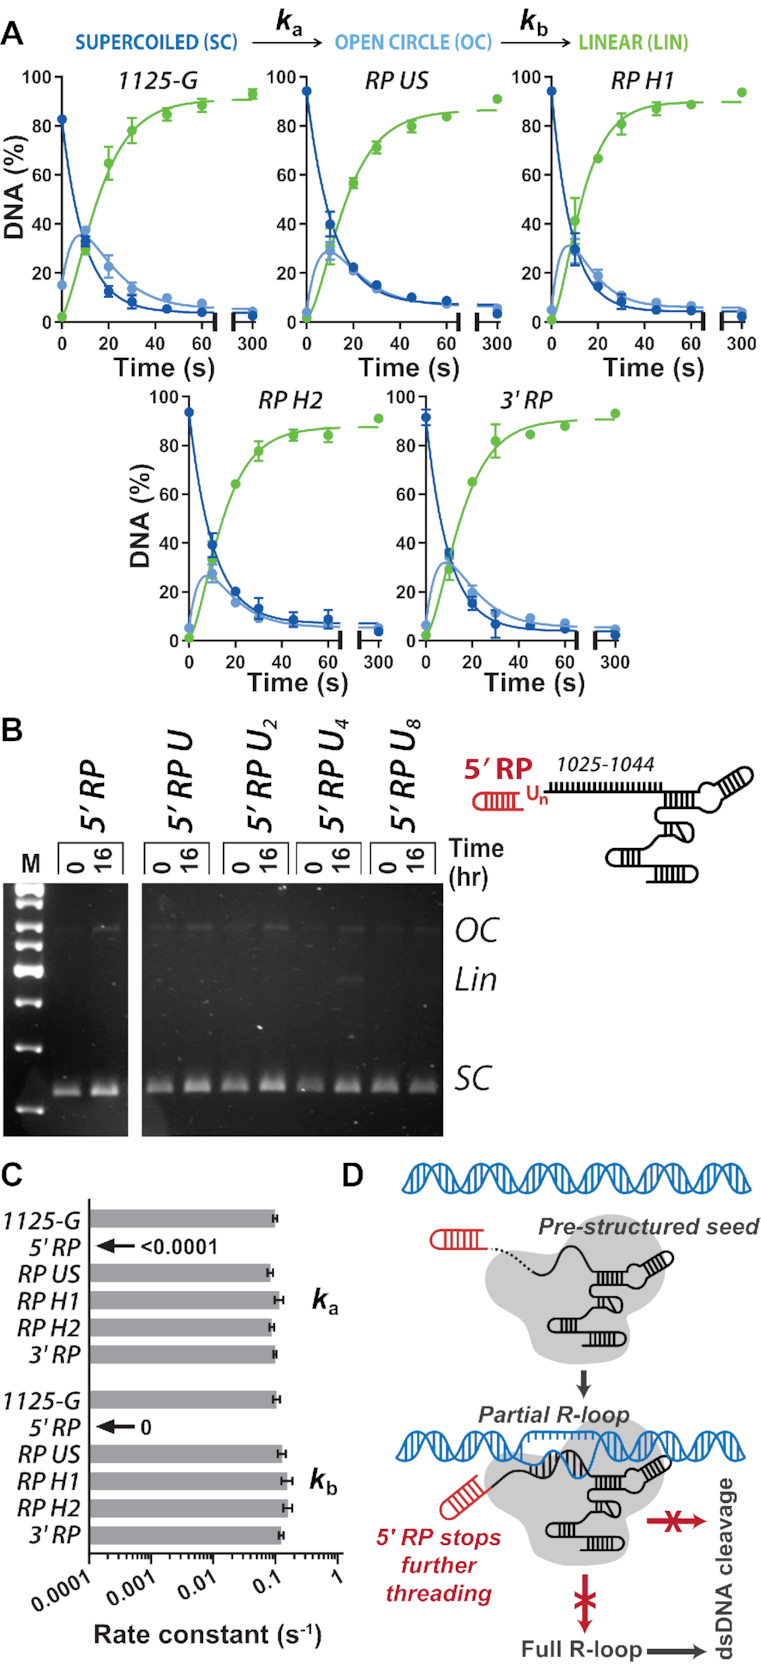
A key aim in exploiting CRISPR-Cas is gRNA engineering to introduce additional functionalities, ranging from individual nucleotide changes that increase efficiency of on-target binding to the inclusion of larger functional RNA aptamers or ribonucleoproteins (RNPs). Cas9-gRNA interactions are crucial for complex assembly, but several distinct regions of the gRNA are amenable to modification. We used in vitro ensemble and single-molecule assays to assess the impact of gRNA structural alterations on RNP complex formation, R-loop dynamics, and endonuclease activity. Our results indicate that RNP formation was unaffected by any of our modifications. R-loop formation and DNA cleavage activity were also essentially unaffected by modification of the Upper Stem, first Hairpin and 3' end. In contrast, we found that 5' additions of only two or three nucleotides could reduce R-loop formation and cleavage activity of the RuvC domain relative to a single nucleotide addition. Such modifications are a common by-product of in vitro transcribed gRNA. We also observed that addition of a 20 nt RNA hairpin to the 5' end of a gRNA still supported RNP formation but produced a stable ∼9 bp R-loop that could not activate DNA cleavage. Consideration of these observations will assist in successful gRNA design.


Figures

Figure 1.
Figure 1.
Streptococcus pyogenes Cas9 gRNA structure. (A) The structure of SpCas9 (surface render in blue) in complex with gRNA (black) and target DNA (grey) from PDB 4OO8 (9). The gRNA and protospacer DNA structures are shown separately with structural features labelled: spacer (black); Lower Stem (green); Bulge (orange); Upper Stem (blue); Nexus (beige); Hairpins (purple). (B) (left) gRNA schematic as used in other figures with colouring consistent with panel B. (right) gRNA heatmap, based on Briner et al. (10), showing gRNA regions which tolerate (purple), partially tolerate (orange) and do not tolerate (grey) modification. (C) Schematic of the magnetic tweezers assay. See main text for details.
Figure 2.
Figure 2.
The effects of unpaired guanines at the 5′ end of gRNA on Streptococcus pyogenes Cas9. (A) Schematic of R-loop formation. SpCas9 (grey) binds the PAM (grey) and the in vitro transcribed gRNA (black) forms a 20 bp R-loop at the protospacer sequence at 1025–1044 bp of pSP1 (blue). The sequences of the DNA and gRNA spacer sequence are shown. Unpaired 5′ guanines arising from IVT are shown in red. (B) FRET-based gRNA loading assay. (left) Assay schematic. SpCas9hinge was randomly labelled at E945C and D435C with Cy3 and Cy5. In the Apo state (top), there is high acceptor fluorescence which decreases upon gRNA binding (bottom) as fluorophores are moved apart. (right) Comparative (ratio)A (N = 3 ± SD) for loading gRNAs with 1, 2 or 3 unpaired 5′ guanines (light grey) relative to Apo Cas9 (dark grey). (C) Example MT traces of R-loop cycling (at 10 turns s−1) to measure R-loop formation (red arrows) and dissociation (blue arrows). Raw (grey) and 2 Hz smoothed data (black) are shown. Each trace represents measurements on the same single DNA. (D) Inverted cumulative probability distributions for the R-loop formation and dissociation times for each gRNA. Solid lines are single exponential fits. (E) Mean R-loop formation and dissociation times and standard error (N = 36–43, Supplementary Table S3) from the fits in panel D. (F) Supercoiled plasmid cleavage assay. Assay schematic (top). The first strand of supercoiled DNA (SC, dark blue) is cleaved to give an open circle (OC, light blue) intermediate, followed by second strand cleavage resulting in linear DNA (LIN, green). These three forms of DNA can be separated by agarose gel electrophoresis (middle). Tritiated-DNA bands are cut out from agarose gel and quantified by scintillation counting (bottom, N = 3 ± SD). The kinetic model (Materials and Methods, Supplementary Figure S6) was simultaneously fitted by numerical integration to each repeat separately, and the kinetic constants averaged (Supplementary Table S4). Solid lines are simulations using the average values. x-axes are split as follows: 0–100 s and 101–300 s (G); 0–350 s and 360–600 s (GG); and, 0–700 s and 710 - 1200 s (GGG). (G) Comparison of the appearance of LIN product and fitted profiles for each gRNA taken from panel F. (H) Average apparent rate constants for the first and second strand cleavage calculated from the fits in panel F (N = 3–4 ± SD) (Supplementary Table S4).
Figure 3.
Figure 3.
The effects of unpaired bases at the 5′ end of gRNA on Streptococcus pyogenes Cas9 at an alternative protospacer sequence. (A) Sequence of the 20 bp R-loop at the protospacer sequence at 1166–1147 bp of pSP1 (green). 5′ unpaired bases are shown in red for each of the gRNAs. (B) Quantified supercoiled plasmid cleavage assays from gels shown in Supplementary Figure S7A. Except for 1166-G for which a satisfactory fit was not possible, the kinetic model (Materials and Methods, Supplementary Figure S6) was simultaneously fitted by numerical integration to each repeat separately, and the kinetic constants averaged (Supplementary Table S4). Solid lines are simulations using the average values except for the 1166-G data where linear interpolations between the points (grey lines) are shown to guide the eye. x-axes are split as 0–65 s and 75–300 s. (C) Comparison of the appearance of LIN product and fitted profiles for each gRNA taken from panel B. x-axis split as 0–65 s and 75–300 s. (D) Average apparent rate constants for the first and second strand cleavage calculated from the fits in panel B (N = 3 ± SD) (Supplementary Table S4). (E) The alternative kinetic model that incorporates R-loop formation (Supplementary Figure S6) was simultaneously fitted by numerical integration to each repeat separately of the 1166-GGG data and the kinetic constants averaged (Supplementary Table S4). Solid lines are simulations using the average values. Ka was fixed at 0.14 s−1 based on the average value in panel D. x-axis split as 0–65 s and 75–300 s. (F) Example MT traces showing R-loop formation events (red arrows). Raw (grey) and 2 Hz smoothed data (black) are shown. Each trace represents measurements on the same single DNA.
Figure 4.
Figure 4.
Unpaired bases at the 5′ end of gRNA slow the rate of DNA cleavage by the RuvC nuclease domain but not by the HNH nuclease domain. Quantified supercoiled plasmid cleavage assays from gels shown in Supplementary Figure S7B using Streptococcus thermophilus DGCC7710 CRISPR3 Cas9 WT (A), RuvC mutant D31A (B), or HNH mutant N891A (C). For clarity, only the disappearance of supercoiled (SC) DNA and appearance of linear (LIN) product for WT are compared to the appearance of nicked (OC) product for the nicking mutants. x-axes are split as 0–65 s and 75–300 s.
Figure 5.
Figure 5.
The effect of the RP RNA hairpin on R-loop dynamics. (A) Sequence of the RP hairpin and schematics of Streptococcus pyogenes Cas9 (grey) and the in vitro transcribed gRNAs (black) (sequences in Supplementary Figure S1). (B) FRET-based gRNA loading assay. Comparative (ratio)A for loading gRNAs as shown (light grey) relative to Apo Cas9 (dark grey) (N = 3 ± SD). (C) Example MT traces of R-loop cycling (at 10 turns s−1) to measure R-loop formation (red arrows) and dissociation (blue arrows). Raw (grey) and 2 Hz smoothed data (black) are shown. (D) Comparison of an R-loop formation event with 3′ RP (red) and 3′ RP (black) gRNA. (E) cumulative probability of R-loop size in turns estimated from R-loop cycling experiments in Supplementary Figure S8 (Materials and Methods). Grey bars are the standard error for each estimation. (F) Average R-loop size in turns (±SD) for each of the gRNAs. The average turns for 1025-G, RP US, RP H1, RP H2 and 3′ RP was assumed to estimate a full length R-loop and used to set R-loop size in bp. Significance test results in Supplementary Table S5. (G, H) Inverted cumulative probability distributions for the R-loop formation and dissociation times for each gRNA. Solid lines are single exponential fits or double exponential fits (5′ RP formation; 5′ RP and RP H2 dissociation). (I) Mean R-loop formation and dissociation times and standard error (N = 19 to 43, Supplementary Table S3) from the fits in panel D. For 5′ RP formation events, and 5′ RP and RP H2 dissociation events, the light and dark bars are the two constants from a double exponential fit with the percentage shown for the amplitude of the slower events. For the dissociation times, the x-axis is split as 0–1 s and 2–10 s.
Figure 6.
Figure 6.
5′ RP modification of gRNA blocks DNA cleavage by Streptococcus pyogenes Cas9. (A) Quantified supercoiled plasmid cleavage assays from gels shown in Supplementary Figure S7C. The kinetic model (Materials and Methods, Supplementary Figure S6) was simultaneously fitted by numerical integration to each repeat separately, and the kinetic constants averaged (Supplementary Table S4). Solid lines are simulations using the average values. x-axes are split as 0–65 s and 75–300 s. (B) Cartoon of the 5′ RP gRNAs modified to include 1, 2, 4 or 8 uracils. Agarose gel of pSP1 cleavage reactions using SpCas9 and the gRNAs, as indicated. (C) Average apparent rate constants for the first and second strand cleavage calculated from the fits in panel A (N = 3 ± SD) (Supplementary Table S4) or estimated from panel B. (D) Model for partial R-loop formation by 5′ RP gRNA. See text for further details.

References

    1. Wang H., La Russa M., Qi L.S.. CRISPR/Cas9 in genome editing and beyond. Annu. Rev. Biochem. 2016; 85:227–264. - PubMed
    1. Carroll D. Genome engineering with targetable nucleases. Annu. Rev. Biochem. 2014; 83:409–439. - PubMed
    1. Jiang F., Doudna J.A.. CRISPR–Cas9 structures and mechanisms. Annu. Rev. Biophys. 2017; 46:505–529. - PubMed
    1. Jinek M., Chylinski K., Fonfara I., Hauer M., Doudna J.A., Charpentier E.. A programmable dual-RNA-guided DNA endonuclease in adaptive bacterial immunity. Science. 2012; 337:816–821. - PMC - PubMed
    1. Gasiunas G., Barrangou R., Horvath P., Siksnys V.. Cas9-crRNA ribonucleoprotein complex mediates specific DNA cleavage for adaptive immunity in bacteria. Proc. Natl Acad. Sci. U.S.A. 2012; 109:E2579–E2586. - PMC - PubMed

Publication types

MeSH terms

Substances