. 2020 Jun 4;16(6):e1008788.
doi: 10.1371/journal.pgen.1008788. eCollection 2020 Jun.

Identification of Clec4b as a novel regulator of bystander activation of auto-reactive T cells and autoimmune disease

Affiliations

Identification of Clec4b as a novel regulator of bystander activation of auto-reactive T cells and autoimmune disease

Liselotte Bäckdahl et al. PLoS Genet. .

Abstract

The control of chronic inflammation is dependent on the possibility of limiting bystander activation of autoreactive and potentially pathogenic T cells. We have identified a non-sense loss of function single nucleotide polymorphism in the C-type lectin receptor, Clec4b, and have shown that it controls chronic autoimmune arthritis in rat models of rheumatoid arthritis. Clec4b is specifically expressed in CD4+ myeloid cells, mainly classical dendritic cells (DCs), and is defined by the markers CD4+/MHCIIhi/CD11b/c+. We found that Clec4b limited the activation of arthritogenic CD4+αβT cells and the absence of Clec4b allowed development of arthritis already 5 days after adjuvant injection. Clec4b sufficient CD4+ myeloid dendritic cells successfully limited the arthritogenic T cell expansion immediately after activation both in vitro and in vivo. We conclude that Clec4b expressed on CD4+ myeloid dendritic cells regulate the expansion of auto-reactive and potentially pathogenic T cells during an immune response, demonstrating an early checkpoint control mechanism to avoid autoimmunity leading to chronic inflammation.


Conflict of interest statement

The authors have declared that no competing interests exist.

Figures
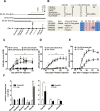
Fig 1
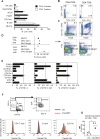
Fig 1. Identification of the arthritis-regulating gene in the Oia2/Pia7/Cia13 locus on rat chromosome 4.
a) An illustration of the distribution of the 8 C-type lectin genes across the APLEC interval on rat chromosome 4 and the congenic fragments with genomic regions harboring arthritis-susceptible DA alleles (grey) and arthritis-protective E3 alleles (black) for the three congenic strains DA.E3-Pia7 to the far right, DA.E3-Clec4a to the left of the chromosome and DA.E3-Clec4bde to the far left. b) An illustration of the distribution of SNPs across the DA.E3-Clec4bde congenic fragment[6] and the Clec4bde encoded genes, together with an illustration of the two non-synonymous SNPs and nearby SNPs in five different inbred strains including the reference rat strain BN. c) OIA development in DA strain and the 3 congenic strains. d) PIA development over time in the original DA strain and DA.E3-Clec4bde congenic. e) CIA development over time for the DA strain and the DA.E3-Clec4bde strain. Significance stars illustrate Mann. Whitney Test * = p<0.05, ** = p<0.01, *** = p<0.001 **** = p<0.0001 and SEM. f) Gene expression of all APLEC encoded genes for DA and Clec4bE3 in naïve splenocytes. House-keeping gene is b2m and all genes are compared to one DA sample.
Fig 2
Fig 2. Clec4b expression is restricted to immature CD4+ myeloid cells in the spleen.
a) Relative expression of Clec4b in five naïve immune-related tissue; spleen, blood, thymus, bone-marrow and inguinal lymph nodes (n = 5 for spleen and thymus, remaining tissues n = 3). b) Clec4b expression of naïve spleen cells. The samples were pooled from three different spleens. Cells were first negatively selected for TCR, and then positively selected for CD4+ and CD8+ cells, respectively. After CD4/CD8 sorting, the remaining cells were selected for CD11b/c. Neutrophils were enriched from blood using Ficoll-Hypaque centrifugation. c) Non-pooled spleen samples were negatively selected for T cells and positively for CD4. The CD4- fraction is the flow-through cell (n = 5). d) Relative Clec4b expression in three naïve Clec4bE3 or one DA sample, all sorted with a Mo-flow FACS sorter. The FACS plot depicts the gating strategy for the three assessed population. Before CD4 and His24 (CD45R), the population determining gating, the cells were negatively sorted by gating for TCR and CD45RA, eliminating T cells and B cells. The cells were His24- CD4+ (CD4+ DC), His24- CD4- (CD4- DC) or His24+ CD4+ (pDCs) (n = 3 for Clec4bE3 and n = 1 for DA). e) Relative Clec4b expression in naïve and oil-primed splenocytes selected for TCR-CD4+ and for day 0, day 1 day 2, day 3, and day 5 after oil injection. n = 5 for all groups. Significance stars depict Mann. Whitney Test * = p<0.05, ** = p<0.01, *** = p<0.001 and SEM.
Fig 3
Fig 3. Clec4b is expressed in CD4+ MHCII+ DCs in two distinct sub-populations that are either MHCIIhi classical dendritic cells or MHCIIdim pDCs.
a) Frequencies of florescence labeled cells (n = 8 for all groups), first selected to be TCR-, and after a second sorting separated into either CD4+ or CD4- fractions using a CD4 antibody coated beads. NK cells are CD161hi, Neutrophils are His48+ and CD11b/c+, pDC are CD4+ and (CD45R) His24+, B cells are CD45RA+ (OX33), CD11b/c cells are OX42+ and His48 cells are granulocytes. b-d) Antibody labeled cell frequencies for CD4+ and CD4- fractions in the total mononuclear cell population. b) Shows CD4 and TCR (clone R73) expression. c) Expression of CD11b/c and His48. d) Illustrate MHCII+ expression (clone OX17) separated by cellular size by the forward scatter, and the three populations identified are also analyzed for each of the 8 samples and the cell frequencies are illustrated in a box-plot graph. e) Illustration of the cellular distribution based on antibody labeled fluorescence intensities for the three CD4+ subsets, classified by differential MHCII expression and cell size. The antibody expression frequencies described in the graphs are for the specific MHCII subsets. CD161+ population is actually CD161 intermediary and therefore is not describing NK cells which should be CD161hi. pDCs are CD4+ HIS24+. No strain comparisons for the CD4+ subsets showed any significant differences. f) Histograms describing anti-clec4b antibody staining in flow cytometer for either DA and Clec4bE3 splenocytes. Three gates are shown in the T cells, B cells, and the CD4+TCR- population. g) Mean fluorescence intensity for the Clec4b antibody illustrating expression per cell on the CD4+TCR- population for both DA and Clec4bE3.
Fig 4
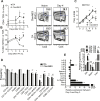
Fig 4. Clec4b is expressed in naïve CD4+ MHCII+ DCs that expand greatly in Clec4b deficient rats after activation and initiate the development of inflammatory dendritic cells.
a) The kinetic distribution of CD4+ DCs (of TCR- CD45+ cells) determined by flow cytometry in the spleen over time after IFA. n = 5 per group. Graph is a representation of 4 separate experiments. b) Kinetic distribution of geomean of fluorescence intensities of MHCII expression on CD4+ DCs over time after an intradermal IFA injection, and representative CD4 MHCII intensity plots for frequencies for samples from day 0, and day 4 after oil injection. Previously gated for TCR- CD45+ cells. c) CD11b expression on TCR- OX33- MHCII+ cell as frequencies of total cells (n = 5 per group). d) The distribution of DC subsets in spleen day 3 after oil injection. The displayed distribution is for total cells and is a representative sample from 3 separate experiments (n = 5 per group). e) The relative expression of DC activation/differentiation regulating genes in the immune-precipitated CD4+ TCR- cells comparing expression day 0 to Day 3. Larger graph illustrates expression for both DA and Clec4bE3. Data from the two genotypes were pooled to give a general overview. The smaller upper graph describes relative gene expression for genes that were differentially expressed between DA and Clec4bE3. Significance stars depict Mann. Whitney Test * = p<0.05, ** = p<0.01 bars are for SEM (n = 5 per group).
Fig 5
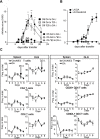
Fig 5. Arthritis transmitting T cells are induced already 5 days after oil injection.
a) Transfer arthritis development in recipients after injection with 15 x 106 spleen derived T cells from donor rats previously injected with mineral oil either 5 or 6 days beforehand. Donors and recipients are noted as d. and r. from either genotype; DA, or Clec4bE3(*E3). n = 5 for all groups. b) Transfer arthritis development in DA recipients after injection with 15 x 106 T cells from inguinal lymph nodes taken from donor rats day 6 after oil injection (both groups n = 5). c) Day to day distribution of T cell subsets as frequencies of total cell (n per time point = 5). Statistical analysis was performed using Mann-Whitney Test * = p<0.05 SEM. d) Day to day distribution of activation associated T cell markers as frequencies of total cells (n per time point = 5).
Fig 6
Fig 6. Clec4b regulates CD4+ myeloid cell mediated suppression of naïve T cells in mixed lymphocyte reactions.
a) Illustration of the gating for activated T cells, by first gating for live cells, then T cells, and CD4+CD25+ cells followed by proliferation as carboxyfluorescein succinimidyl ester (CFSE) low. And an illustration of CFSE histogram for two samples. b) Graph describes proliferation as CFSE low labeled CD4+CD25+ T cells from a) for Naïve or OIA Day 3 activated allogenic T cells and OIA Day 3 activated syngenic DA or Clec4bE3 T cells. The T cells have been co-cultured with OIA day 3 in vivo activated DCs from both genotypes, or cultured with naïve DCs from both genotypes (only for naïve allogenic T cells). c) In vitro stimulated Clec4b gene expression in CD4+ TCR- spleen cells, after 24 h culture with either Con A, TDM, mannan, CpG, LPS, complete media only (n = 5 per group) Mann. Whitney Test ** = p<0.01 SEM. d) Comparisons of T cell subset in co-cultures mixing naïve DA T cells, cultured with Con A stimulated selected DCs, either CD4+DCs or CD4-DCs from DA or Clec4bE3. Frequencies of total cells are displayed for the co-culture at different DC:T cell ratios explained in 3 graphs; total CD4+ cells; total CD25+ CD4+ T cells; and proliferating (CFSE low) CD25+ CD4+ T cells. (n = 10 for all groups) Mann Whitney Test * = p<0.05, ** = p<0.01, *** = p<0.001 and SEM. e) Describes two four-way grouped co-culture experiments comparing the proliferative regulation from either DA or *E3 (Clec4bE3) CD4+ DCs on bead selected CFSE labeled T cells from both rat strains and mixed in combinations in co-cultures for 72 h. n = 10 for all groups. 3 Graphs illustrate proliferative T cell subsets: total proliferating T cells, total CD4+ CD25+ T cells and the frequencies of proliferating CD4+ CD25+ T cells in all cells. Graphs describes regulation of proliferation on recently harvested naïve T cells by in vitro Con A activated CD4+DCs in different T cell to DC ratios/concentrations. Mann. Whitney Test * = p<0.05, ** = p<0.01, *** = p<0.001 and SEM.
Fig 7
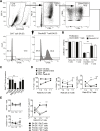
Fig 7. Clec4b regulate T cell proliferation also in vivo and the activation correlate with down-regulation of IL17 production.
DA rats were injected intradermally with oil and 4 days later the spleens were used as a source of oil primed T cells. These were CSFE labeled and injected intravenously into naïve DA and Clec4bE3 recipients that had been injected intradermaly with mineral oil the same day. a) Proliferation FACS plot describing CFSE intensity in CD4 versus CD8 T cells harvested from spleens of the recipients day 3 after oil injection. CFSE negative T cells are the recipient endogenous T cells. The CFSEhigh are the non-proliferating T cells from the donors and the CFSElow are the donor T cells that have been proliferating in the recipient. b) Histogram over the distribution of the three groups from a and how they differ in the expression of both Ki67 and MHCII on their surface. c) Graphs describing how the two donor groups, non-dividing and dividing T cells, differ in the expression of MHCII and Ki67 between DA and Clec4bE3 recipients. d,e) Illustration on how the expression of the two cytokines IFNg and IL17 is distributed between the three groups of differentially proliferating T cells between the Clec4b sufficient and deficient recipient rats. d) Illustrative FACS plot. e) Statistics analysis and graph. n = 4 for all groups, Mann Whitney Test * = p<0.05, ** = p<0.01, *** = p<0.001 and SEM.

References

    1. Theofilopoulos AN, Kono DH, Baccala R. The multiple pathways to autoimmunity. Nat Immunol. Nature Publishing Group, a division of Macmillan Publishers Limited. 2017. July;18(7):716–724. 10.1038/ni.3731 - DOI - PMC - PubMed
    1. Floreani A, Leung PSC, Gershwin ME. Environmental Basis of Autoimmunity. Clin Rev Allergy Immunol. Springer US; 2016. June;50(3):287–300. 10.1007/s12016-015-8493-8 - DOI - PubMed
    1. Kollias G, Papadaki P, Apparailly F, Vervoordeldonk MJ, Holmdahl R, Baumans V, et al. Animal models for arthritis: innovative tools for prevention and treatment. Ann Rheum Dis. BMJ Publishing Group Ltd; 2011. August;70(8):1357–62. 10.1136/ard.2010.148551 - DOI - PubMed
    1. Hoffmann MH, Bruns H, Bäckdahl L, Neregård P, Niederreiter B, Herrmann M, et al. The cathelicidins LL-37 and rCRAMP are associated with pathogenic events of arthritis in humans and rats. Ann Rheum Dis. 2013. July;72(7):1239–48. 10.1136/annrheumdis-2012-202218 - DOI - PubMed
    1. Vingsbo C, Sahlstrand P, Brun JG, Jonsson R, Saxne T, Holmdahl R. Pristane-induced arthritis in rats: a new model for rheumatoid arthritis with a chronic disease course influenced by both major histocompatibility complex and non-major histocompatibility complex genes. Am J Pathol. American Society for Investigative Pathology; 1996. November;149(5):1675–83. - PMC - PubMed

Publication types