. 2020 Jun 4;15(6):e0234062.
doi: 10.1371/journal.pone.0234062. eCollection 2020.

Exploration of the effects of the CYCLOPS gene RBM17 in hepatocellular carcinoma

Affiliations

Exploration of the effects of the CYCLOPS gene RBM17 in hepatocellular carcinoma

Can Li et al. PLoS One. .

Abstract

Background: Hepatocellular carcinoma (HCC) is one of the most lethal and malignant tumours worldwide. New therapeutic targets for HCC are urgently needed. CYCLOPS (copy number alterations yielding cancer liabilities owing to partial loss) genes have been noted to be associated with cancer-targeted therapies. Therefore, we intended to explore the effects of the CYCLOPS gene RBM17 on HCC oncogenesis to determine if it could be further used for targeted therapy.

Methods: We collected data on 12 types of cancer from the Cancer Genome Atlas (TCGA) and Gene Expression Omnibus (GEO) queries for comparison with adjacent non-tumour tissues. RBM17 expression levels, clinicopathological factors and survival times were analysed. RNAseq data were downloaded from the Encyclopaedia of DNA Elements database for molecular mechanism exploration. Two representative HCC cell models were built to observe the proliferation capacity of HCC cells when RBM17 expression was inhibited by shRBM17. Cell cycle progression and apoptosis were also examined to investigate the pathogenesis of RBM17.

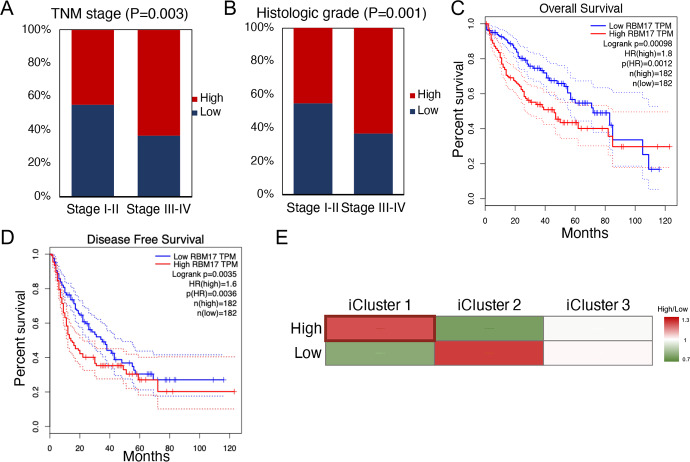
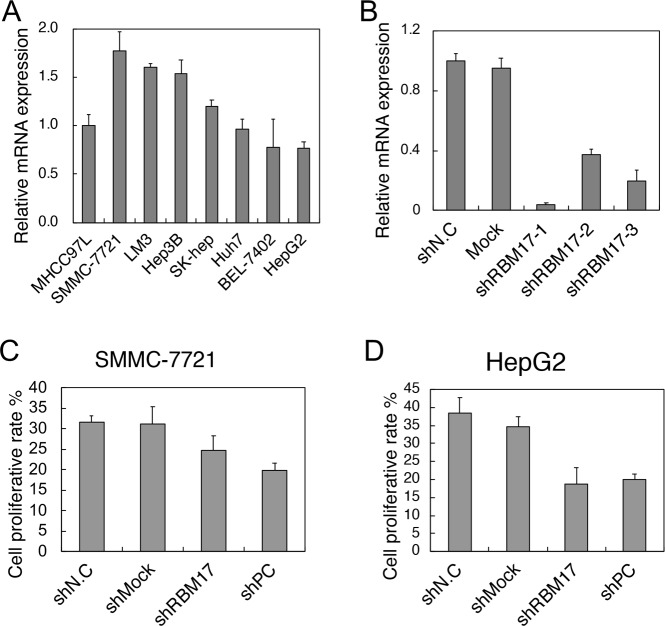
Results: Based on 6,136 clinical samples, RBM17 was markedly overexpressed in most cancers, especially HCC. Moreover, data from 442 patients revealed that high RBM17 expression levels were related to a worse prognosis. Overexpression of RBM17 was related to the iCluster1 molecular subgroup, TNM stage, and histologic grade. Pathway analysis of RNAseq data suggested that RBM17 was involved in mitosis. Further investigation revealed that the proliferation rates of HepG2 (P = 0.003) and SMMC-7721 (P = 0.030) cells were significantly reduced when RBM17 was knocked down. In addition, RBM17 knockdown also arrested the progression of the cell cycle, causing cells to halt at the G2/M phase. Increased apoptosis rates were also found in vitro.

Conclusion: These results suggest that RBM17 is a potential therapeutic target for HCC treatment.


Conflict of interest statement

The authors have declared that no competing interests exist.

Figures

Fig 1
Fig 1. RBM17 was highly expressed in tumour tissues, as verified by TCGA and GEO datasets.
(A) A total of 6,136 samples were analysed in 12 cancers from TCGA, including 5,504 tumour tissue samples and 632 non-tumour tissue samples. RBM17 was highly expressed in HCC and had low expression in kidney chromophobe tumours, with statistical significance (P < 0.05). (B) GSE6764 contained 23 normal tissue samples and 35 HCC cancer samples. RBM17 was overexpressed in HCC samples (P = 0.005). Meanwhile, the expression of RBM17 was higher in cirrhotic liver tissue than normal tissue. (C) For GSE45267, there were 41 normal tissues and 24 HCC tumour tissues. The violin plot revealed that the expression of RBM17 was obviously high in HCC cancer tissue (P = 1.02x10⁻⁹). (D) In GSE41804, 40 samples consisted of 20 normal tissues, 10 major HCC tissues, and 10 minor HCC tissues. Thereinto, major HCC refers to a single tumor nodule with a diameter of more than 5 cm. In comparison, minor HCC refers to a single tumor nodules with a maximum diameter of no more than 3 cm or two tumor nodules with a total diameter of no more than 3 cm. The t-test results revealed that major HCC (P = 0.035) and minor HCC (P = 0.022) samples had significantly higher RBM17 expression than normal tissue.
Fig 2
Fig 2. The association of RBM17 expression and clinical characteristics.
(A) The relationship between RBM17 expression levels and HCC histologic grades was significantly correlated (P = 0.001). (B) RBM17 overexpression was associated with the TNM stage (P = 0.003). (C) In the overall survival analysis, patients with high RBM17 expression had shorter survival than patients with low RBM17 expression (P = 0.001). (D) For disease-free patients, the ten-year survival rate of low RBM17-expressing patients was higher than that of the other patients (P = 0.004). (E) In iCluster1, most patients exhibited RBM17 overexpression showing with border, while downregulation was more prominent in iCluster2. iCluster3 showed no difference. Based on the chi-square test, iCluster1 and the combination of the remaining two clusters were significantly correlated (P = 0.017).
Fig 3
Fig 3. Cell proliferation rates of different cell lines with control and shRBM17 plasmids.
(A) Among eight cell lines, SMMC-7721 had the highest expression level, while HepG2 had the lowest. (B) We detected expression levels of three constructed plasmids in SMMC-7721 cell line. shRBM17-1 had the most significant effect with the lowest expression level among three shRBM17 plasmids, a mock plasmid, and a negative control plasmid. (C and D) shRBM17-1, shPC (FoxM1), shNC, and shMock were transfected into SMMC-7721 and HepG2 cell lines. After knockdown, HepG2 cell proliferation was reduced in both the SMMC-7721 cell line (P = 0.030) and the HepG2 cell line (P = 0.003).
Fig 4
Fig 4. DEGs identification and pathway analysis.
(A) The volcano plot for 1,106 significantly DEGs. There were 381 genes expressed at higher levels after RBM17 knockdown. In contrast, 725 genes showed lower expression. We verified the accuracy by RBM17 (orange spot). (B) Negative log base 10 Q-values from the pathway enrichment analysis are plotted, and P values of DEG-enriched pathways are sorted. Seven pathways were RNA-related, four pathways were protein-related, and one pathway was related to the cell cycle. (C) Ten core DEGs were involved in the mitosis pathway. A heat map of 10 core DEGs related to mitosis is plotted.
Fig 5
Fig 5. The effect of RBM17 silencing on cell cycle progression and apoptosis.
(A and B) We detected the cell cycle alteration after RBM17 knocking down by flow cytometry. A showed the control group of cell cycle condition. Stage G1 occupied 53.020%, stage S occupying 17.640%, and stage G2/M was 29.330%. B showed the results of shRBM17 group. Stage G1 occupied 59.880%, stage S occupying 19.050%, and stage G2/M occupied 21.070%. Comparing to the control group, the cells of shRBM17 group arrested in G1 phase and shrunk in the G2/M phase. (C) The combination of the cell cycle detection results of HepG2 and SMMC-7721. In SMMC-7721 control group, stage G1 occupied 56.530%, stage S occupying 14.460%, and stage G2/M was 29.020%. Meanwhile, stage G1 occupied 60.960%, stage S occupying 15.260%, and stage G2/M was 23.780% in SMMC-7721 shRBM17 group. (D) We detected the apoptosis experiment on HepG2 cell line by flow cytometry. The abscissa and ordinate of the figures are the amounts of the Annexin V-FITC and PI, respectively. The sum of the fluorescence amount ratios occupied by Q2 and Q3 to infer the relative cell numbers of early and late apoptosis. In the control group, the percentages of cells in Q2 and Q3 were 0.706% and 0.449%, respectively. The sum of Q2 and Q3 was 1.155%. (E) In shRBM17-1-transfected HepG2 cells, Q2 occupied 17.100%, while Q3 occupied 9.030% of the total cells. Moreover, the sum of the two was 26.130%. (F) The combination of the apoptosis detection results of HepG2 and SMMC-7721. In the control group of SMMC-7721, the percentages of cells in Q2 and Q3 were 0.256% and 2.200%, respectively. The sum of Q2 and Q3 was 2.456%. In shRBM17-1 transfected SMMC-7721 cells, Q2 occupied 12.700%, while Q3 occupied 57.400% of the total cells. The sum of the two was 70.100%.

References

    1. El-Serag HB, Marrero JA, Rudolph L, Reddy KR. Diagnosis and Treatment of Hepatocellular Carcinoma. Gastroenterology. 2008;134: 1752–1763. 10.1053/j.gastro.2008.02.090 - DOI - PubMed
    1. Zhu RX, Seto WK, Lai CL, Yuen MF. Epidemiology of hepatocellular carcinoma in the Asia-Pacific region. Gut and Liver. 2016;10: 332–339. - PMC - PubMed
    1. Roquette R, Painho M, Nunes B. Spatial epidemiology of cancer: A review of data sources, methods and risk factors. Geospatial Health. 2017;12: 504 10.4081/gh.2017.504 - DOI - PubMed
    1. Di Bisceglie AM. Epidemiology and clinical presentation of hepatocellular carcinoma. Journal of Vascular and Interventional Radiology. 2002;13: S169–S171. - PubMed
    1. Kudo M. Systemic Therapy for Hepatocellular Carcinoma: 2017 Update. Oncology (Switzerland). 2017;93: 135–146. - PubMed

Publication types

MeSH terms