. 2020 Jun 4;15(6):e0233578.
doi: 10.1371/journal.pone.0233578. eCollection 2020.

Mechanistic dissection of the PD-L1:B7-1 co-inhibitory immune complex

Affiliations

Mechanistic dissection of the PD-L1:B7-1 co-inhibitory immune complex

Sarah C Garrett-Thomson et al. PLoS One. .

Abstract

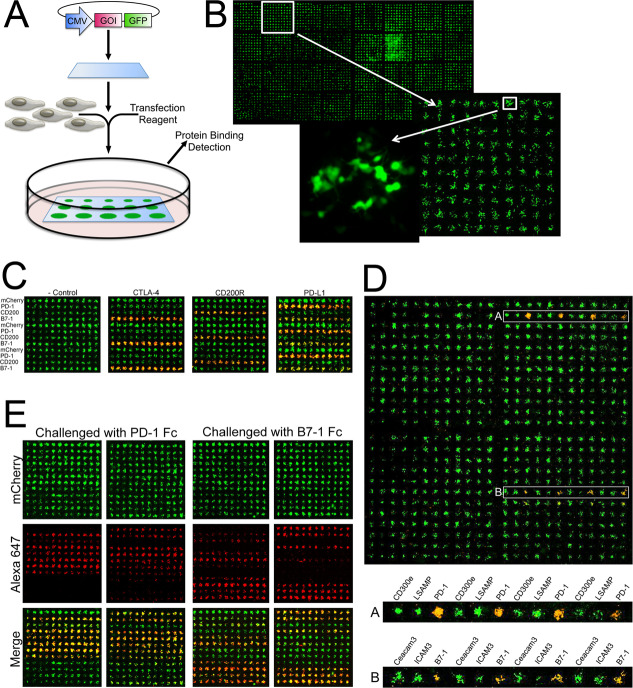
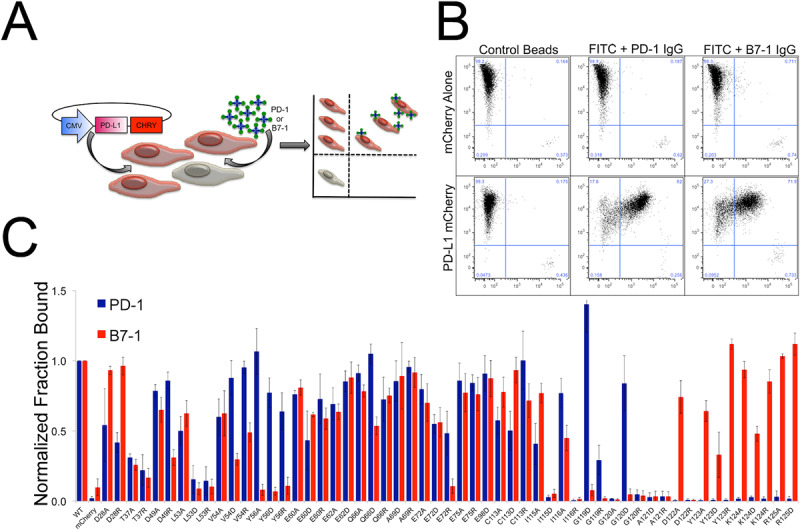
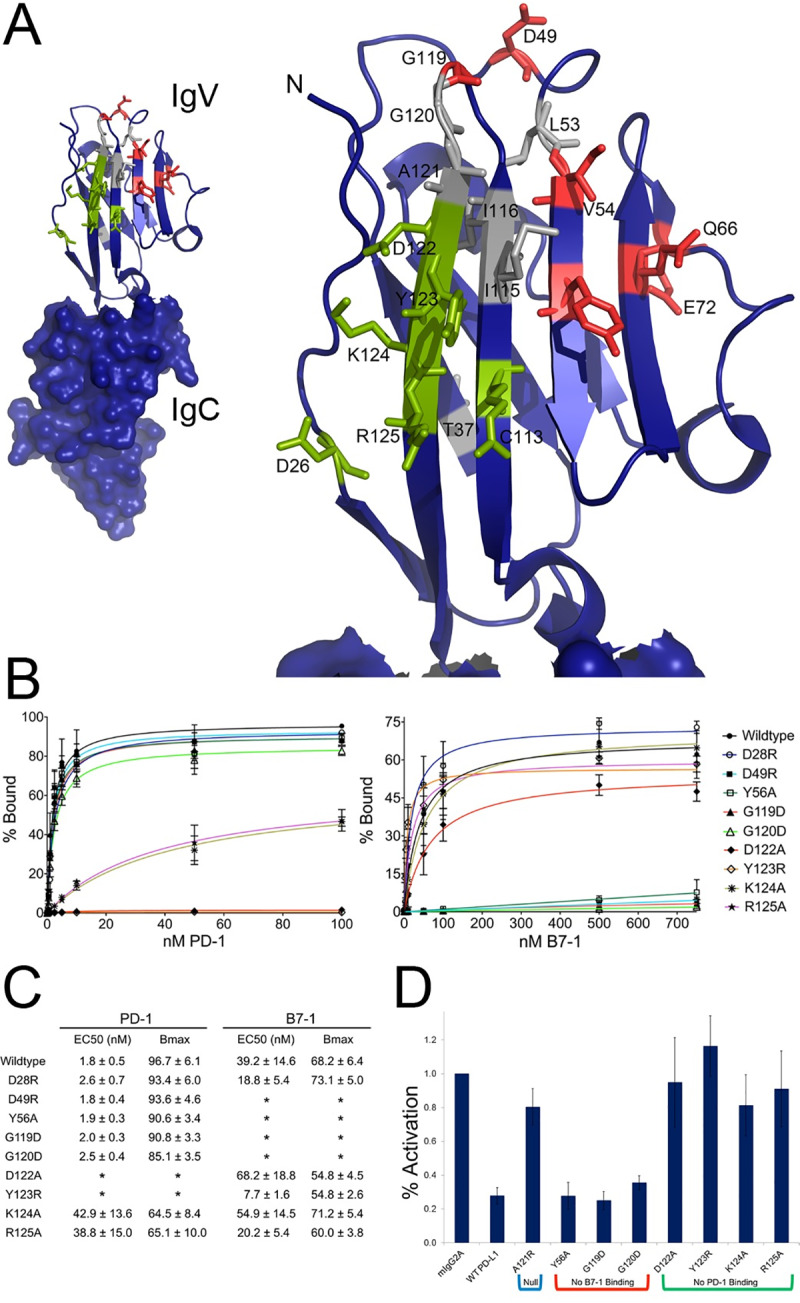
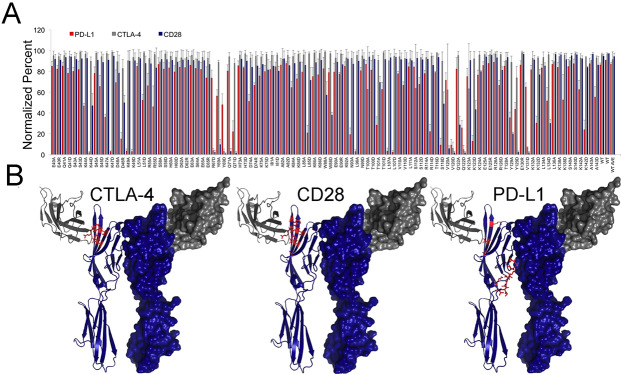
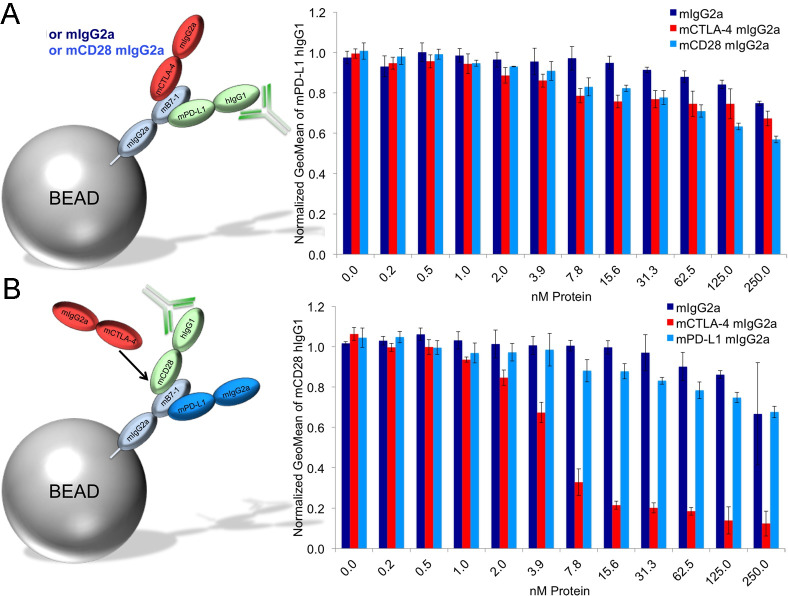
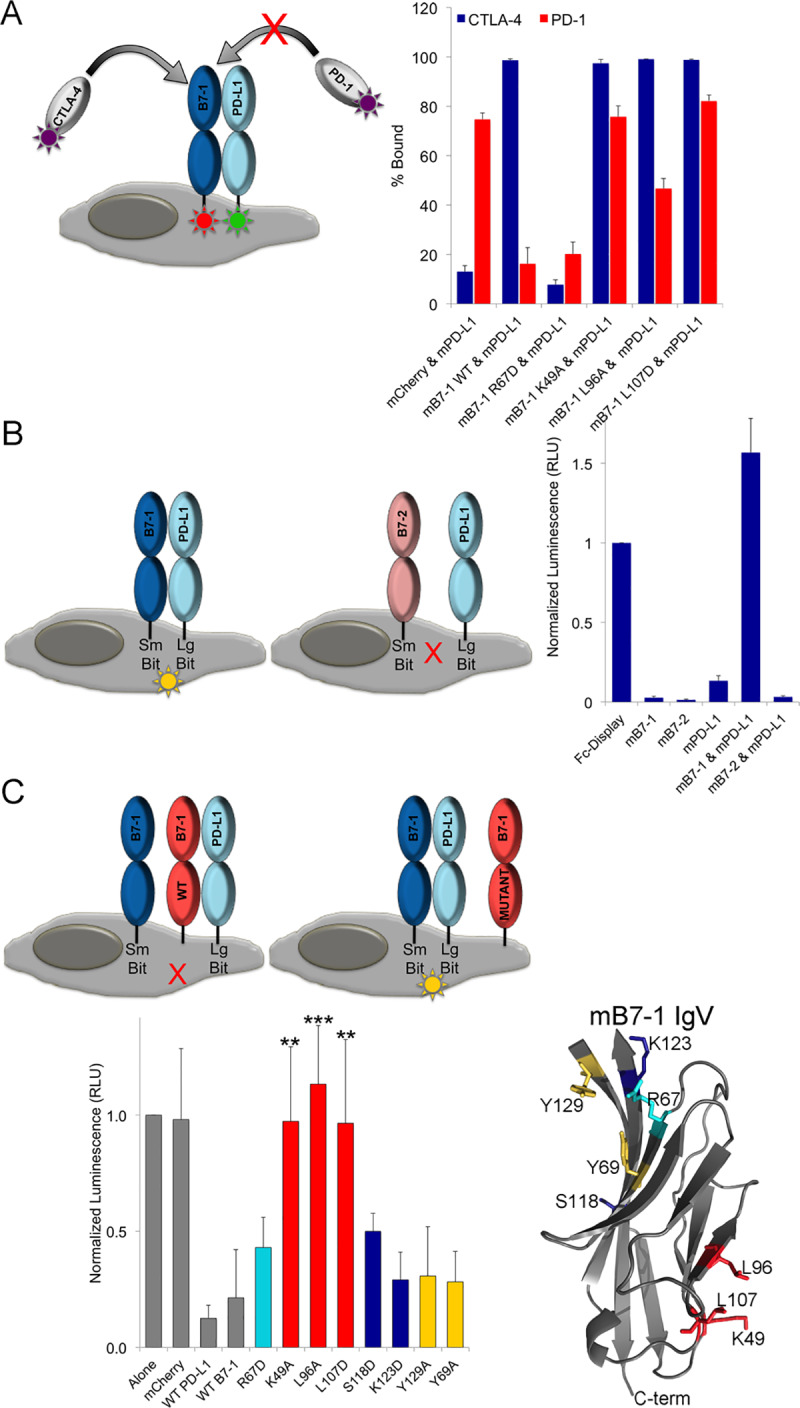
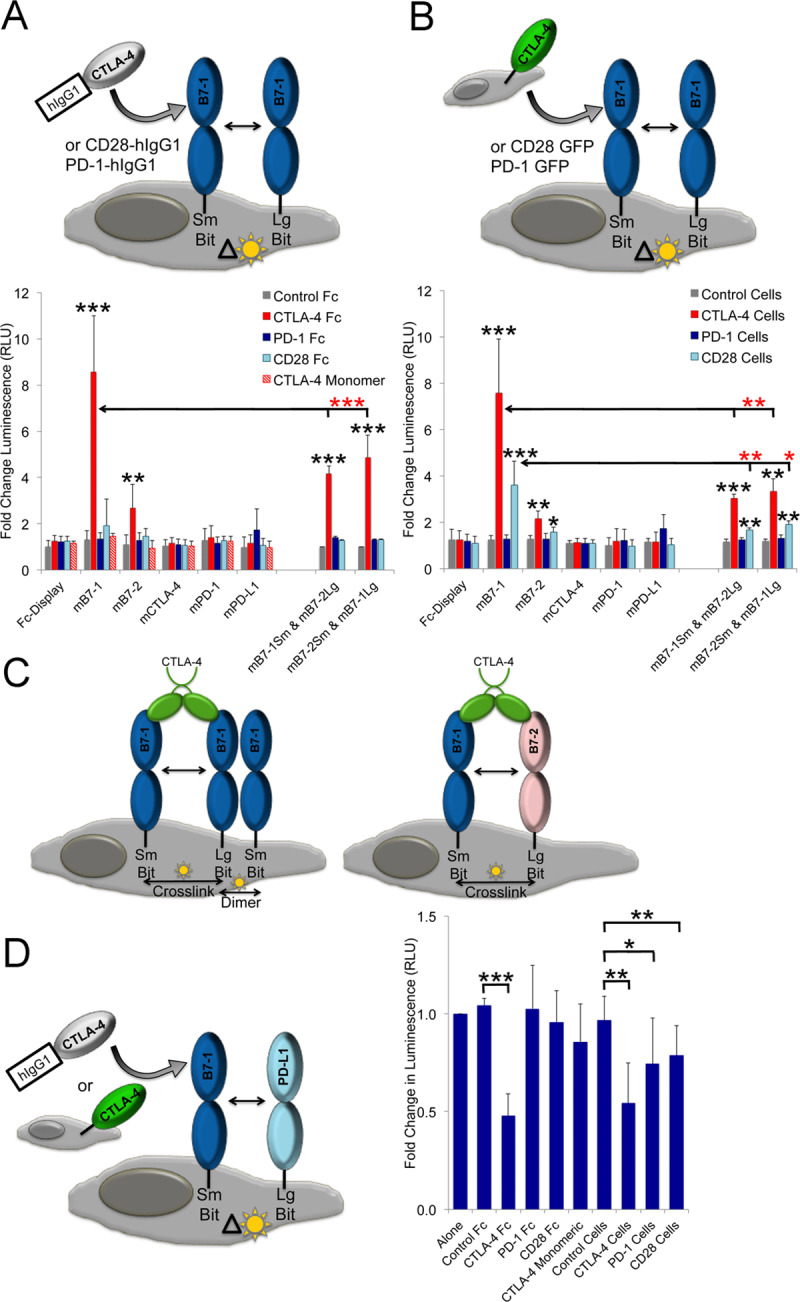
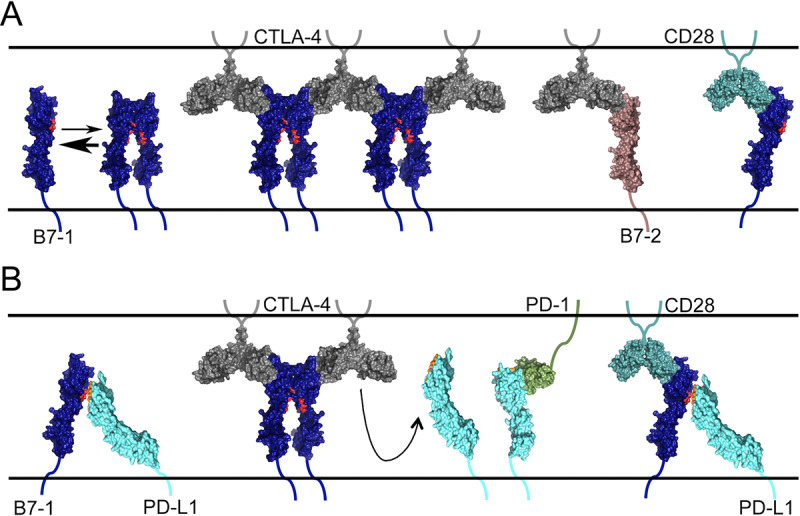
The B7 family represents one of the best-studied subgroups within the Ig superfamily, yet new interactions continue to be discovered. However, this binding promiscuity represents a major challenge for defining the biological contribution of each specific interaction. We developed a strategy for addressing these challenges by combining cell microarray and high-throughput FACS methods to screen for promiscuous binding events, map binding interfaces, and generate functionally selective reagents. Applying this approach to the interactions of mPD-L1 with its receptor mPD-1 and its ligand mB7-1, we identified the binding interface of mB7-1 on mPD-L1 and as a result generated mPD-L1 mutants with binding selectivity for mB7-1 or mPD-1. Next, using a panel of mB7-1 mutants, we mapped the binding sites of mCTLA-4, mCD28 and mPD-L1. Surprisingly, the mPD-L1 binding site mapped to the dimer interface surface of mB7-1, placing it distal from the CTLA-4/CD28 recognition surface. Using two independent approaches, we demonstrated that mPD-L1 and mB7-1 bind in cis, consistent with recent reports from Chaudhri A et al. and Sugiura D et al. We further provide evidence that while CTLA-4 and CD28 do not directly compete with PD-L1 for binding to B7-1, they can disrupt the cis PD-L1:B7-1 complex by reorganizing B7-1 on the cell surface. These observations offer new functional insights into the regulatory mechanisms associated with this group of B7 family proteins and provide new tools to elucidate their function in vitro and in vivo.


Conflict of interest statement

We acknowledge a relationship to Cue Biopharma, Inc. Technologies described in this manuscript were disclosed in PCT patent application nos. PCT/US2013/073275,PCT/US2015/035777, and PCT/US2017/33042, and their corresponding national and regional patents and patent applications, all of which are licensed to Cue Biopharma, Inc. Almo holds equity in Cue Biopharma, Inc. and is a member of its Scientific Advisory Board. However, this commercial affiliation does not alter our adherence to PLOS ONE policies on sharing data and materials.

Figures

Fig 1
Fig 1. The use of the cell microarray platform to identify secreted protein interactions.
A) Schematic for generating cell microarrays. B) For illustration, a GFP expression construct was “pinned” onto a glass surface to create an expression array. At high magnification individually transfected cells can be detected with each spot containing 50–80 cells. C) Slides were printed with alternating rows of plasmid DNA encoding mCherry fusion constructs of PD-1, CD200, B7-1 or mCherry alone. Printed slides were transfected and subsequently treated with Fc-fusions (~100nM) of IgG control, CTLA-4, CD200R and PD-L1. Fc-fusions were pre-incubated with Cy7 secondary antibody (~200 nM). for detection. For each array, significant binding of the Fc-fusion is detected for only those rows where its cognate receptor or ligand is present. D) Slides were printed with expression constructs for 144 human genes in the Ig superfamily. Each construct was printed in 4 replicates across a row resulting in a total array of 4 x 144 spots. This cell array was treated with 100 nM recombinant PD-L1-Fc pre-incubated with 200 nM Alexa 647 labeled anti-human IgG, washed and fixed with 4% formaldehyde (pseudo-colored red, single channel not shown). The overlaid green and red pseudo-colored images appear yellow/orange where binding is observed due to the merging of the green and red fluorescence signals. The rows labeled A and B contain the two known binding targets of PD-L1, PD-1 (A) and B7-1 (B). 10x magnification of the rows highlighted in clearly shows the positive signal observed for the PD-L1:PD-1 and PD-L1:B7-1 interactions as compared to the signal observed from the surrounding spots. E) Slides were printed with rows of plasmid (24 rows total) encoding (alternating between the right and left grids) WT PD-L1, mCherry (-control), D28A, D28R, D49A, D49R, V54A, V54R, Y56A, Y56D, Q66A, Q66D, E72A, E72R, G119D, G119R, G120D, D122A, Y123A, Y123R, K124A, K124D, R125A, R125D. The data shows two representative slides (2 grids/slide = 24 rows = mutants listed) queried with either PD-1 or B7-1 Fc-fusion protein detected with an anti-human Alexa 647 antibody.
Fig 2
Fig 2. Screening PD-L1 mutants using a high-throughput microbead binding FACS assay.
A) Schematic of the microbead FACS binding assay. B) Representative control microbead experiment. Cells expressing either mCherry alone (-control) or PD-L1 mCherry were queried with microbeads conjugated with control Fc, PD-1 Fc or B7-1 Fc fusion protein. The FACS data was gated for all live cells and shows binding of both PD-1 and B7-1 coated microbeads (upper right quadrant) to cells expressing wild type PD-L1. C) FACS microbead binding data for a panel of 54 PD-L1 mutants. Data shows the fraction of mCherry positive cells (PD-L1 expressing) bound to microbeads coated in either PD-1 (Blue) or B7-1 (Red) with binding normalized to wild type. PD-1 and B7-1 binding was done in parallel triplicate experiments with error bars representing the standard deviation.
Fig 3
Fig 3. Characterization of PD-L1 mutants with altered binding to PD-1 or B7-1.
A) The crystal structure of the PD-1: PD-L1 complex (PDB: 3SBW) showing just the PD-L1 IgC and IgV domains. The IgV domain was enlarged and residue that when mutated resulted in altered binding are labeled and colored accordingly, green = PD-1 binding affected, red = B7-1 binding affected, gray = both PD-1 and B7-1 binding affected. B) Data obtained from FACS titration experiments in which cells expressing either wild type PD-L1 or a mutant were titrated with increasing concentrations of recombinant PD-1 or B7-1 Fc-fusion protein. Binding was detected using an anti-mouse Alexa 488 secondary antibody. Data points show the average of three independent experiments with error bars showing the standard deviation. Curves show the fit of the data to a single-site binding model. C) Table of EC50 and Bmax values obtained from the FACS titration experiments in B. Here, EC50 refers to the effective concentration at which 50% binding was observed. Stars denote those titrations for which binding was so low (baseline) that the data could not be fit. D) Data shows the fraction of CSFE labeled CD4+ T-cells isolated from C57BL/6 mice activated after 4 days of stimulation with anti-CD3 in the presence of isotype control, wild type or mutant PD-L1 Fc-fusion protein. Activation was normalized to isotype control and represents three independent experiments.
Fig 4
Fig 4. Screening mB7-1 mutants for binding to mCTLA-4, mCD28 and mPD-L1.
A) HEK 293 Freestyle cells were transiently transfected with wild type or mutant mB7-1 mCherry constructs. 48 hours post transfection cells were diluted to 1x10^6 cells/mL and 0.5 μg of recombinant mCTLA-4, mCD28 and mPD-L1 fc-fusion protein were added to 100, 000 cells in 100uL in 96-well V-bottom plates. After binding for 1 hour at room temperature, mixing at 900rpm, cells were washed 2X with 1X PBS and 0.2% BSA and subsequently incubated with 0.25 μg of anti-mouse Alexa 488 (Invitrogen) for 30 min. After secondary antibody incubation cells were washed two more times with 1X PBS and 0.2% BSA and analyzed by flow cytometry to quantify the percent of mCherry positive cells (expression) positive for Alexa 488 staining (binding). Data shows three independent experiments with standard deviations. S3 Table highlights mutants in red showing <20% binding and in yellow showing <50 and >20% binding. B) Equivalent residues identified as critical for binding (<20% bound) CTLA-4, CD28 and PD-L1 were highlighted as red on the crystal structure of the hB7-1:hCTLA-4 (PDB: 1I8L).
Fig 5
Fig 5. PD-L1 does not compete with CTLA-4 or CD28 for binding to B7-1 on beads.
A) Cartoon depiction of the competition assay. Briefly, protein A beads were saturated with mB7-1 mIgG2a protein and subsequently incubated with 20nM mPD-L1 hIgG1 and either an increasing concentration of either mIgG2a, mCD28 mIgG2a or mCTLA-4 mIgG2a. Binding of mPD-L1 was monitored using an anti-human Alexa 488 antibody. B) Same as in A except that 20nM mCD28 hIgG1 was added to coated beads in the presence of increasing concentrations of mIgG2a, mCTLA-4 mIgG2a or mPD-L1 mIgG2a.
Fig 6
Fig 6. PD-L1 binds in cis to the dimer interface side of B7-1.
A) HEK 293 freestyle cells were transiently co-transfected with mB7-1 mCherry and mPD-L1 GFP constructs as depicted. 48 hours post transfection cells were incubated with mCTLA-4 hIgG1 or mPD-1 hIgG1 protein for 1 hour at room temperature with shaking and subsequently incubated with anti-human Alexa 647 secondary. Binding was determined by flow cytometry. Percent bound was calculated as the percent of all double mCherry and GFP positive cells also positive for Alexa 647 staining. Data represents three independent experiments with standard deviations. B) HEK 293 freestyle cells were co-transfected with SmBit and LgBit constructs as indicated. Two days post transfection cells were counted and 50,000 cells were incubated with 12.5 μL of diluted live glo nanoluciferase substrate (Promega) and incubated for 5 min. After incubation luminescence was detected on a Perkin Elmer Envision plate reader. Data was normalized to the luminescence observed for the displayed Fc-dimer constructs and represents 8 independent experiments and standard deviation. C) Same as in B) except that in addition to SmBit B7-1 and LgBit PD-L1, cells were also transfected with the additional constructs depicted. Data was normalized to the luminescence observed for cells expressing mB7-1 SmBit and mPD-L1 LgBit alone and represents 8 independent experiments with standard deviation.
Fig 7
Fig 7. Reorganization of cell surface B7-1 inhibits the cis interaction between PD-L1 and B7-1.
A) HEK 293 freestyle cells were co-transfected with SmBit and LgBit constructs as indicated. Two days post transfection 100,000 cells were incubated with 0.5 μg of recombinant CTLA, CD28 or PD-1 or control Fc-fusion protein in 150 μL reaction volume. After binding for 1 hour at room temperature a 50 μL aliquot from each binding reaction was removed and 12.5 μL of nanoluciferase substrate added. Data shows the fold change calculated as the ratio of stated condition to untreated cells and represents 8 independent experiments with standard deviations. B) Same as in A) except that 50,000 HEK 293 cells expressing either CTLA-4 GFP, CD28 GFP or PD-1 GFP or control were added as indicated. C) Same as in A) and B) except querying HEK 293 cells transiently transfected with B7-1 SmBit and PD-L1 LgBit constructs. Significance calculated by one-way Annova is indicated by stars, *** = P <0.001, ** = P<0.01 and * = P<0.05.
Fig 8
Fig 8. Proposed model for the regulation of the cis bound PD-L1:B7-1 complex.
A) B7-1 exists in a monomer-dimer equilibrium. Binding of CTLA-4 cross-links cell surface B7-1 thereby promoting and/or stabilizing B7-1 dimer formation. B7-2 does not dimerize and CD28 may not cross-link B7-1 to the same extent as CTLA-4. B) B7-1 and PD-L1 interact in cis and engagement of CTLA-4 with B7-1 inhibits PD-L1 binding, freeing it to bind PD-1. A tertiary complex may form between CD28, B7-1 and PD-L1 but has not been observed directly. The crystal structures used in the generation of this model cartoon include: 1DR9, 1I8L, 4R0l, 1I85, 4Z18 and 3SBW.

References

    1. Bour-Jordan H, Esensten JH, Martinez-Llordella M, Penaranda C, Stumpf M, et al. (2011) Intrinsic and extrinsic control of peripheral T-cell tolerance by costimulatory molecules of the CD28/ B7 family. Immunol Rev 241: 180–205. 10.1111/j.1600-065X.2011.01011.x - DOI - PMC - PubMed
    1. Nurieva RI, Liu X, Dong C (2009) Yin-Yang of costimulation: crucial controls of immune tolerance and function. Immunol Rev 229: 88–100. 10.1111/j.1600-065X.2009.00769.x - DOI - PMC - PubMed
    1. Wang S, Chen L (2004) T lymphocyte co-signaling pathways of the B7-CD28 family. Cell Mol Immunol 1: 37–42. - PubMed
    1. Chattopadhyay K, Lazar-Molnar E, Yan Q, Rubinstein R, Zhan C, et al. (2009) Sequence, structure, function, immunity: structural genomics of costimulation. Immunol Rev 229: 356–386. 10.1111/j.1600-065X.2009.00778.x - DOI - PMC - PubMed
    1. Zang X, Allison JP (2007) The B7 family and cancer therapy: costimulation and coinhibition. Clin Cancer Res 13: 5271–5279. 10.1158/1078-0432.CCR-07-1030 - DOI - PubMed

Publication types