. 2020 Jun 25;181(7):1612-1625.e13.
doi: 10.1016/j.cell.2020.05.017. Epub 2020 Jun 3.

Intratumoral CD4+ T Cells Mediate Anti-tumor Cytotoxicity in Human Bladder Cancer

Affiliations

Intratumoral CD4+ T Cells Mediate Anti-tumor Cytotoxicity in Human Bladder Cancer

David Y Oh et al. Cell. .

Abstract

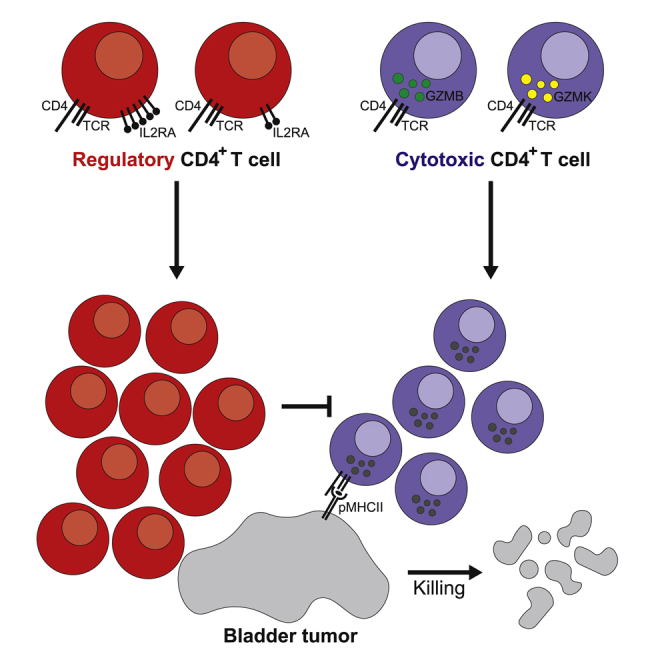
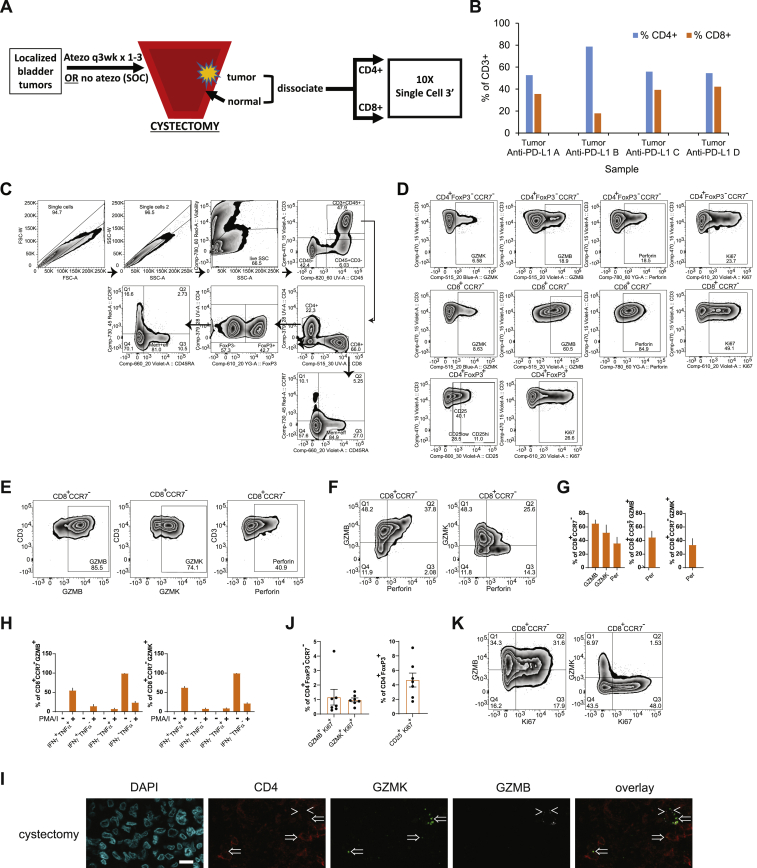
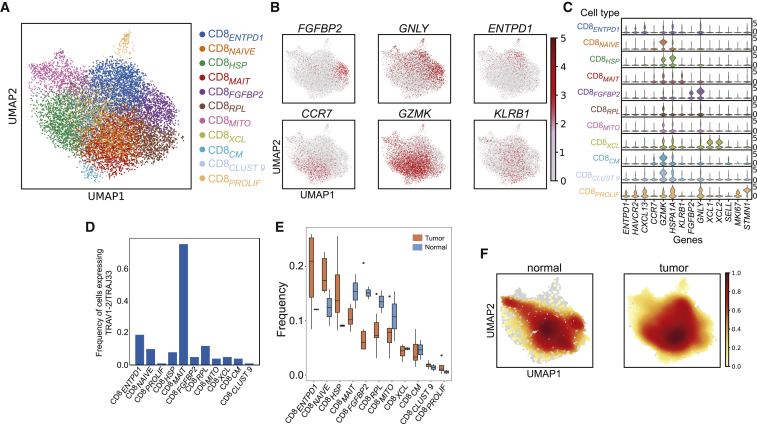
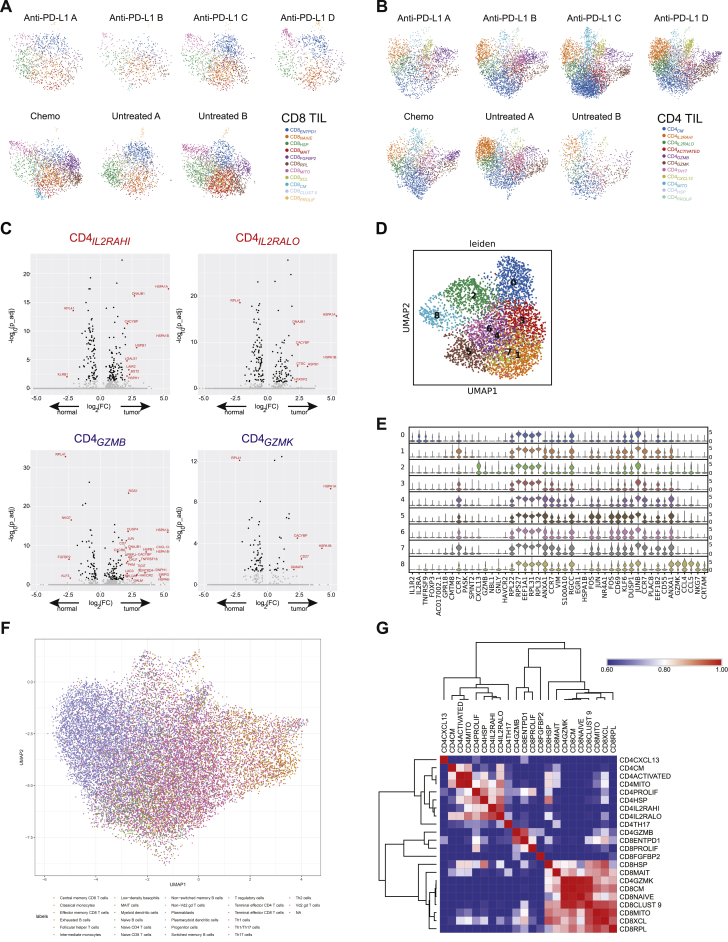
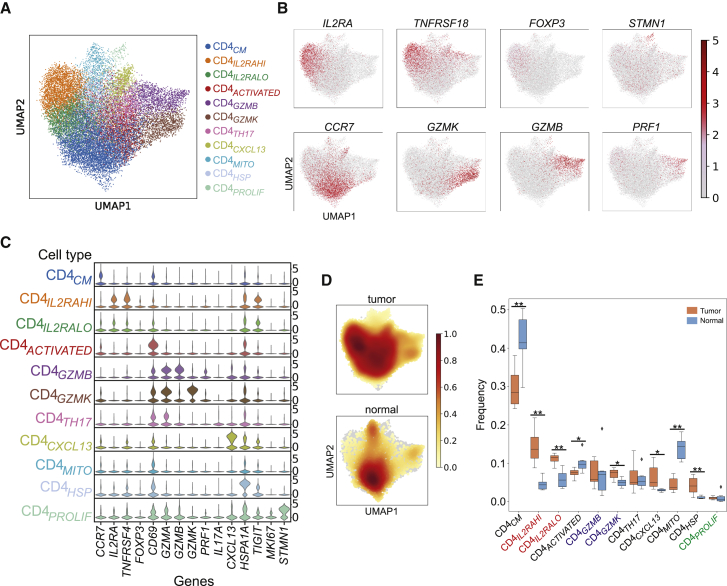
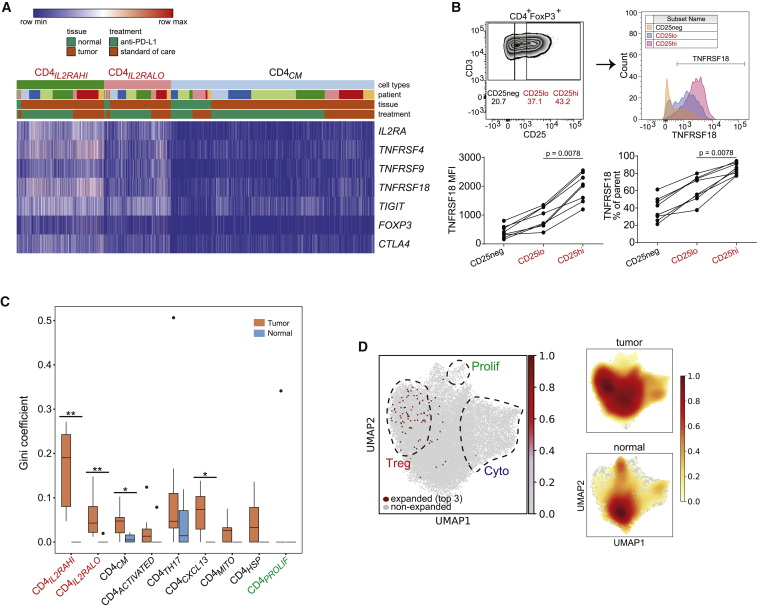
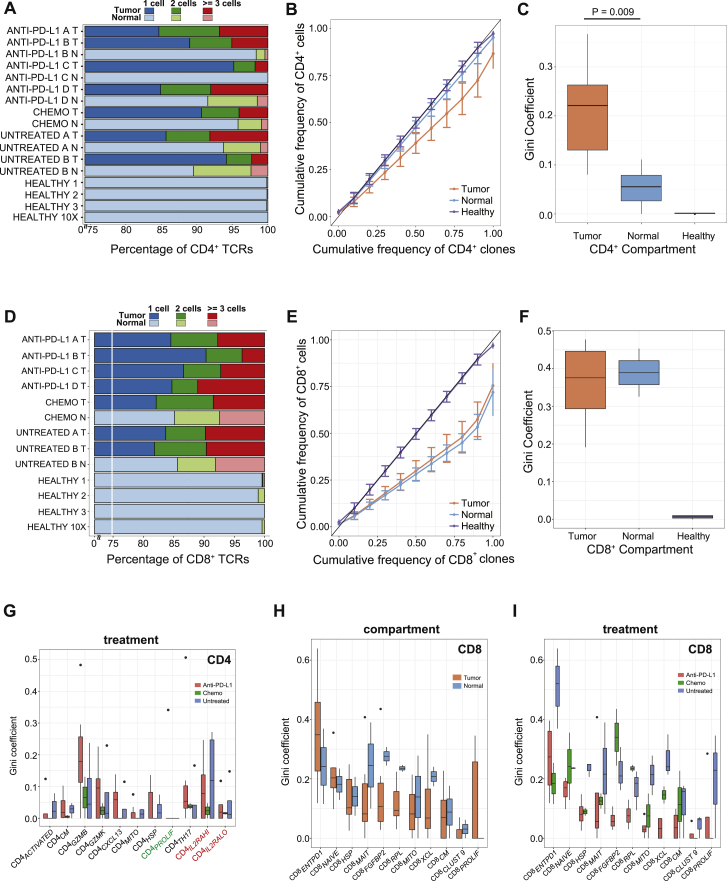
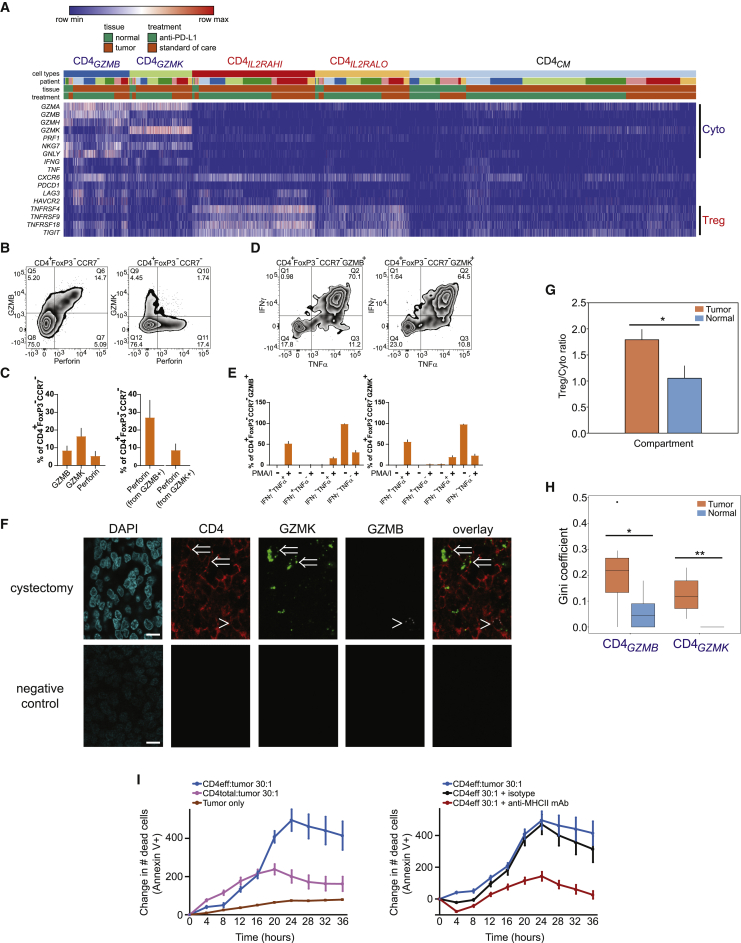
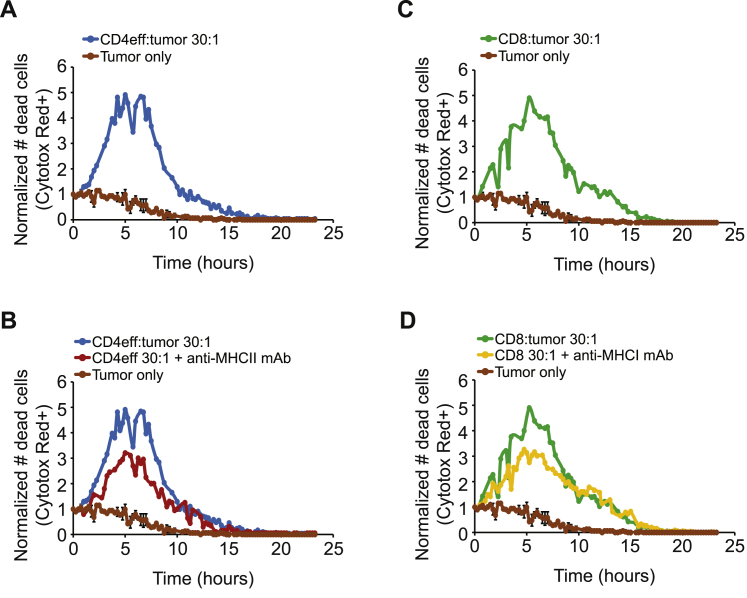
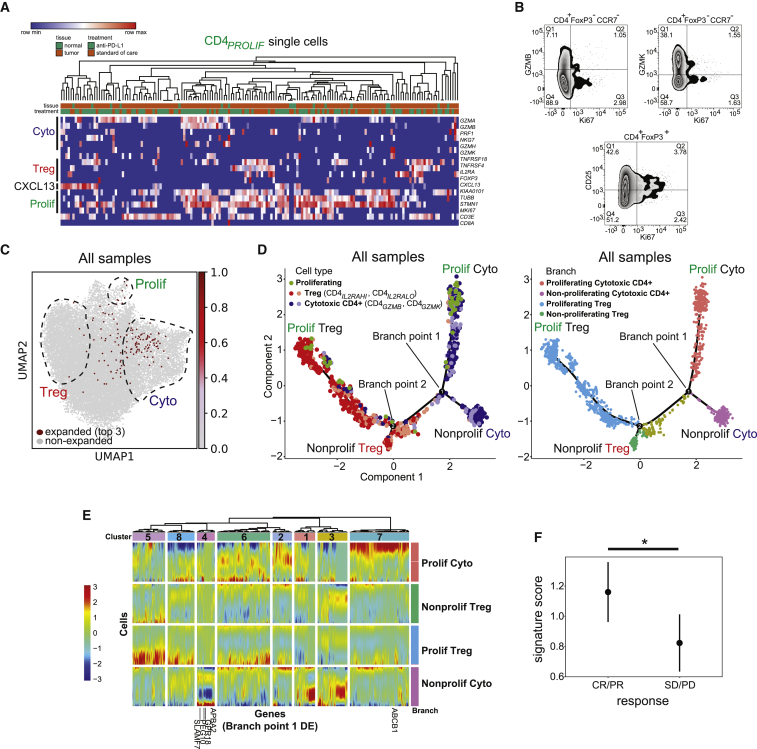
Responses to anti-PD-1 immunotherapy occur but are infrequent in bladder cancer. The specific T cells that mediate tumor rejection are unknown. T cells from human bladder tumors and non-malignant tissue were assessed with single-cell RNA and paired T cell receptor (TCR) sequencing of 30,604 T cells from 7 patients. We find that the states and repertoires of CD8+ T cells are not distinct in tumors compared with non-malignant tissues. In contrast, single-cell analysis of CD4+ T cells demonstrates several tumor-specific states, including multiple distinct states of regulatory T cells. Surprisingly, we also find multiple cytotoxic CD4+ T cell states that are clonally expanded. These CD4+ T cells can kill autologous tumors in an MHC class II-dependent fashion and are suppressed by regulatory T cells. Further, a gene signature of cytotoxic CD4+ T cells in tumors predicts a clinical response in 244 metastatic bladder cancer patients treated with anti-PD-L1.

Trial registration: ClinicalTrials.gov NCT02451423.

Keywords: Bladder cancer; PD-1 blockade; anti-PD-L1; checkpoint inhibition; cytotoxic CD4(+) T cells; predictive gene signature; single-cell sequencing.


Conflict of interest statement

Declaration of Interests D.Y.O. has received research support from Roche/Genentech and Merck and has served as a paid consultant for Maze Therapeutics. L.F. has received research support from Roche/Genentech, Abbvie, Bavarian Nordic, Bristol Myers Squibb, Janssen, and Merck. C.J.Y. is a co-founder of Dropprint Genomics.

Figures

None
Graphical abstract
Figure S1
Figure S1
Flow Cytometry and Immunofluorescence Validation of T Cell Phenotypes in Bladder Tumors, Related to Figures 1, 2, 3, 4, and 5 (A) Schematic of processing for paired tumor and adjacent non-malignant tissue from either anti-PD-L1-treated, or standard-of-care (untreated/chemotherapy-treated) cystectomy patients. FACS-sorted CD4+ or CD8+ T cells were subjected to droplet-based single-cell RNA sequencing (dscRNA-seq) with paired T cell receptor (TCR) sequencing as described in the text. (B) Parallel flow cytometry data from the same single-cell digest used for dscRNA-seq from 4 anti-PD-L1-treated tumors, showing the percentage of CD4+ or CD8+ T cells from total CD3+ cells. (C) Gating strategy for flow cytometric analysis of populations in CD4+ and CD8+ T cells from RNA-seq. CD4+ and CD8+ populations were gated out of CD3+ CD45+ single live cells. CD4+ cells were further gated as FoxP3- and FoxP3+. Treg cells are gated as FOXP3+ CD25+ cells. FOXP3- CD4+ and CD8+ cells were gated into central memory (CM, CCR7+ CD45RA-), and CCR7- cells (a combination of effector memory CCR7- CD45RA- and effector CCR7- CD45RA+). Boolean gating of CCR7- cells was used to obtain GZMK+, GZMB+ and Ki67+ populations for further marker analysis. Plots are shown here to demonstrate the presence of these populations. (D) Representative gates shown for each marker for CD4+ and CD8+ T cells were used for Boolean gating for the populations described above. (E) Flow cytometry staining of GZMB, GZMK, or perforin versus CD3 in CCR7- CD8+ T cells. Gates used for Boolean analysis are shown. (F) Flow cytometry staining of GZMB or GZMK co-expression with perforin in CCR7- CD8+ T cells. (G) Percentage of cells expressing GZMB, GZMK, or perforin from CCR7- CD8+ T cells by flow cytometry (left), and the percentage of cells co-expressing perforin within GZMB+ or GZMK+ CCR7- CD8+ T cells (right), are shown (N = 7 tumors, mean + SEM). (H) Percentages of cells expressing IFNγ, TNFα, or both from GZMB+ or GZMK+ CCR7- CD8+ T cells with and without stimulation (N = 11 tumors, mean + SEM). (I) Multiplex immunofluorescent staining of DAPI (blue), CD4 (red), GZMK (green), GZMB (white) and overlay without DAPI are shown from a cystectomy tumor region from an additional patient with parallel scRNA-seq and TCR-seq data (anti-PD-L1 D). CD4+ cells that co-express GZMK (arrows) or GZMB (arrowhead) are indicated. Scale bar, 10 μm. (J) Percentage of cells co-expressing Ki67 and either GZMB or GZMK from CCR7- CD4+ FOXP3- T cells (left), or Ki67 and CD25 from CD4+ FOXP3+ T cells (right), by flow cytometry are shown, with dots for values from individual tumors (N = 7 tumors, mean ± SEM). (K) Flow cytometry staining showing co-expression of GZMB and Ki67, or GZMK and Ki67, from CCR7- CD8+ T cells.
Figure 1
Figure 1
Bladder Cancer Contains Canonical CD8+ T Cell States (A) Uniform manifold approximation and projection (UMAP) plots of 10,762 single sorted CD3+ CD8+ T cells obtained from bladder tumors and adjacent non-malignant tissue (N = 7 patients). Phenotypic clusters are represented in distinct colors. (B) Relative intensity of expression of select genes superimposed on the UMAP projections in (A). (C) Violin plots showing the relative expression of select differentially expressed genes (columns) for each cluster shown in (A) (rows) (all Padj < 0.05). (D) The frequency of cells expressing MAIT-associated TRAV1-2/TRAJ33+ TCRs within each defined CD8+ phenotypic cluster. (E) The frequency of cells in individual clusters shown as a proportion of total CD8+ cells within tumor or non-malignant compartments across all patients (orange, tumor; blue, non-malignant). For each cluster, a box and whisker plot is shown with the median, interquartile range (IQR, a box with lower and upper bounds representing 25th and 75th percentiles, respectively), and 1.5 times the IQR (whiskers). Outlier points are shown if more than 1.5 times the IQR beyond the lower and upper quartiles. Statistical testing was done using an exact permutation test. (F) Density plots showing distribution of cells in tumor or non-malignant samples.
Figure S2
Figure S2
Clustering, Differential Expression, Annotation, and Correlation Analysis of T Cell Transcriptional Phenotypes, Related to Figures 1, 2, 3, and 4 (A-B) UMAP plots showing cluster representation for CD8+ (A) and CD4+ (B) TIL from individual patients. (C) Volcano plots showing adjusted P values versus log2(FC) for differential testing of genes between tumor and non-malignant compartments for regulatory T cell populations (top, CD4IL2RAHI, CD4IL2RALO) and cytotoxic CD4+ populations (bottom, CD4GZMB, CD4GZMK). Genes whose expression is significantly different between compartments with Padj < 0.05 and |log2(FC) > 1.4| are shown in red. (D-E) Unbiased clustering of CD4+ T cells from tumor and adjacent non-malignant tissue from a single patient (anti-PD-L1 C). (D) UMAP plot showing individual cells coded by cluster or by tissue of origin. (E) Violin plot showing top 5 differentially expressed marker genes for each unbiased cluster. (F) Annotations of single CD4+ T cells from tumor and adjacent non-malignant tissue using SingleR. (G) Correlation matrix of all CD4+ and CD8+ populations from tissue (combined tumor and non-malignant tissues) based on expression of shared genes. Pearson correlation coefficient is shown. Populations were arranged based on hierarchical clustering using Euclidean distance metric.
Figure 2
Figure 2
CD4+ T Cells in Bladder Tumors Are Composed of Multiple Distinct Functional States (A) UMAP plots of 19,842 single sorted CD3+ CD4+ T cells obtained from bladder tumors and adjacent non-malignant tissue (N = 7 patients). Each distinct phenotypic cluster identified using Leiden clustering is identified with a distinct color. Annotation of each unbiased cluster was performed by manual inspection of the highest-ranked differentially expressed genes for each cluster and using reference signature-based correlation methods (SingleR) as described in the text. (B) Relative intensity of expression of select genes superimposed on the UMAP projections shown in (A). (C) Violin plot showing relative expression of select differentially expressed genes (columns) for each cluster shown in (A) (rows) (all Padj < 0.05). (D) Density plots showing distribution of cells in tumor or non-malignant samples. (E) The frequency of cells in individual CD4+ T cell states defined by scRNA-seq clustering is shown as a proportion of total CD4+ cells within either tumor or non-malignant compartments across all patients (orange, tumor; blue, non-malignant). A box and whisker plot is shown with formatting as in Figure 1E. p < 0.05, ∗∗p < 0.01 by exact permutation test.
Figure 3
Figure 3
Regulatory CD4+ T Cells Are Heterogeneous, Enriched, and Clonally Expanded in Bladder Tumors (A) Heatmap showing the expression of select regulatory T cell marker genes (rows) for individual single cells (columns) within the CD4IL2RAHI and CD4IL2RLO clusters compared with the CD4CM cluster. Cells were grouped based on their annotations by tissue (tumor or non-malignant), treatment, and patient. Log2-transformed expression of each gene was row scaled. (B) Flow cytometry staining of CD4+ FOXP3+ TILs from a bladder tumor, showing the gating strategy for CD25neg, CD25low, and CD25hi (top left), and histograms of TNFRSF18 staining from each CD25 gate (top right). Mean fluorescence intensity of TNFRSF18 and percent TNFRSF18+ from the parental gate are shown for CD25 gates across samples (N = 7 tumors, mean ± SEM). p < 0.05 by Wilcoxon paired t test. (C) Gini coefficients for regulatory populations (CD4ILRA2HI and CD4IL2RALO, red labels at far left) and other CD4+ T cell populations within tumor and non-malignant compartments across all samples. For each cluster, a box and whisker plot is shown with the median, IQR (box), and 1.5 times the IQR (whiskers), with outliers exceeding 1.5 times the IQR beyond lower and upper quartiles. p < 0.05, ∗∗p < 0.01 by exact permutation test. N = 7 tumor samples and 6 non-malignant samples. (D) Left: single cells expressing the top 3 most expanded clonotypes found in the combined regulatory populations (CD4ILRA2HI and CD4IL2RALO) are shown in red in the same UMAP space as in Figure 2A. The regions composed of regulatory, cytotoxic, and proliferating T cells are outlined and superimposed on the UMAP projection. Right: density plots for total CD4+ T cell distribution within tumor and non-malignant compartments are reproduced from Figure 2D for ease of visual comparison.
Figure S3
Figure S3
T Cell Receptor Repertoire Analysis of CD4+ and CD8+ Bladder Tumor- and Non-malignant Tissue-Infiltrating T Cells, Related to Figures 3 and 4 (A) The percentage of unique paired TRA and TRB CDR3 nucleotide sequences that are expressed by one cell (blue), shared by two cells (green), or shared by three or more cells (red) is indicated for CD4+ T cells from individual tumor (darker shades) and non-malignant tissues (lighter shades) from anti-PD-L1-treated (“PD-L1”), untreated, and chemotherapy-treated (“chemo”) patients. Triplicate control samples from a single healthy donor’s CD4+ T cells sorted from peripheral blood and processed for scRNA-seq and TCR in identical fashion in separate sequencing runs is shown (“healthy 1-3”), as well as reference publicly available data from peripheral blood CD4+ from a healthy donor. (B) Lorenz curves showing the cumulative frequency distributions for unique CD4+ T cells and unique CD4+ T cell clonotypes for tumor, non-malignant tissues, and healthy donor blood. Mean ± SD is shown. (C) Gini coefficients for CD4+ T cell clonotypes from tumor, non-malignant tissues, and healthy donor blood, calculated from the Lorenz curves in (D); p = 0.009 by Wilcoxon with Benjamini-Hochberg correction for tumor versus non-malignant tissues. For (D) and (E): N = 7 tumor samples; 6 non-malignant samples, 4 healthy donor samples (3 triplicates from one healthy donor, 1 dataset from 10X Genomics). (D-F) Paired TRA/TRB clonotype sharing between cells, Lorenz curves, and Gini coefficients for CD8+ clonotype data as in (A-C). (G) Gini coefficients for tissue-infiltrating CD4+ in individual populations, separated by treatment type. (H-I) Gini coefficients for CD8+ T cells in individual populations, separated by tumor versus non-malignant tissue (H) and treatment type (I). All box and whisker plots are formatted as in Figure 3C.
Figure 4
Figure 4
Multiple Cytotoxic CD4+ T Cell States Are Enriched and Clonally Expanded in Bladder Tumors and Possess Lytic Capacity against Tumors (A) Heatmap showing the expression of select cytotoxic or regulatory T cell marker genes (rows) for individual single cells (columns) within the cytotoxic CD4GZMB and CD4GZMK clusters compared with regulatory (CD4IL2RAHI and CD4IL2RLO) and CD4CM clusters. Cells were grouped based on their annotations by tissue (tumor or non-malignant), treatment, and patient. Log2-transformed expression of each gene was row scaled. (B) Flow cytometry staining of GZMB, perforin, or GZMK in CCR7 CD4+ FOXP3 T cells. (C) Percentage of cells expressing GZMB, GZMK, or perforin from CCR7 CD4+ FOXP3 T cells by flow cytometry (left) and the percentage of cells co-expressing perforin within GZMB+ or GZMK+ CCR7 CD4+ FOXP3 T cells (right) (N = 7 tumors, mean + SEM). (D) Representative flow cytometry staining of IFNγ and TNF-α expression in GZMB+ or GZMK+ CCR7 CD4+ FOXP3 T cells stimulated with PMA and ionomycin. (E) Percentages of cells expressing IFNγ, TNF-α, or both from GZMB+ or GZMK+ CCR7 CD4+ FOXP3 T cells with and without stimulation (N = 11 tumors, mean + SEM). (F) Multiplex immunofluorescent staining of DAPI (blue), CD4 (immunohistochemistry, red), GZMK (RNAscope probe, green), and GZMB (RNAscope probe, white) and overlay without DAPI from a cystectomy tumor region from a patient with parallel scRNA-seq and TCR-seq data (anti-PD-L1 C, top row) and from a corresponding tumor field with negative control staining (bottom row). CD4+ cells that co-express GZMK (arrows) or GZMB (arrowhead) are indicated. Scale bar, 10 μm. (G) The ratio of abundances of all regulatory T cell populations (CD4ILRAHI and CD4IL2RALO) to all cytotoxic CD4+ populations (CD4GZMB and CD4GZMK) across all tumor and non-malignant samples (mean + SEM shown; p < 0.05 by unpaired t test, assuming unequal variance). (H) Gini coefficients for each of the cytotoxic CD4+ populations within tumor and non-malignant compartments across all samples (box and whisker plot is shown with formatting as in Figure 3C; p < 0.05, ∗∗p < 0.01, exact permutation test, N = 7 tumor samples and 6 non-malignant samples). (I) Left panel: quantitation of Annexin V+ apoptotic cells over time from a time-lapse cytotoxicity experiment with tumor cells cultured alone or with bulk CD4+ TILs (CD4total) or CD4+ TILs depleted of regulatory T cells (CD4eff) at a 30:1 effector:target ratio. Right panel: CD4eff TILs and tumor cells (30:1 effector:target ratio) were co-cultured with a pan-anti-MHC class II antibody or isotype control. All traces were from the same culture and cytotoxicity assay from the same patient. All traces show relative change in cell death from time point 0. Cytotoxicity with CD4eff is representative of independent experiments from 4 different patients. Mean ± SEM from multiple technical replicates for each experiment is shown.
Figure S4
Figure S4
Autologous MHC-Dependent Killing of Bladder Tumors by CD4+ and CD8+ TIL, Related to Figure 5 Analysis of the increase in the number of dead cells over time from the same killing assay for CD4eff TIL (ie cultures with Tregs sorted out during expansion) at 30:1 effector:target ratio (A), CD4eff TIL at 30:1 effector:target ratio with a pan-anti-MHCII antibody (B), CD8+ TIL at 30:1 effector:target ratio (C), or CD8+ TIL at 30:1 effector:target ratio with a pan-anti-MHCI antibody (D), are shown. Control traces from separate wells with tumor only are included. All traces were normalized to the number of dead cells per mm2 at time point 0. Experiments were done using Cytotox Red. The observation of autologous tumor killing by CD4+ and CD8+ TIL above the background level of spontaneous death is representative of 2 independent experiments involving distinct aliquots from the same patient.
Figure 5
Figure 5
Proliferating CD4+ T Cells Contain Regulatory and Cytotoxic Cell States (A) Heatmap showing expression of select cytotoxic, regulatory, and proliferating marker genes (rows) for individual single cells (columns) within the CD4PROLIF cluster. Samples were hierarchically clustered. Log2-transformed expression of each gene was row scaled. (B) Representative flow cytometry staining from a bladder tumor showing expression of CD25, GZMB, GZMK, and Ki67. (C) Single cells expressing the top 3 most expanded clonotypes found in the CD4PROLIF T cell population are shown in red in the same UMAP space as in Figure 2A. The regions composed of proliferating, regulatory, and cytotoxic T cells are outlined and superimposed on the UMAP projection for visualization. (D) Left panel: pseudotime trajectories derived from all tumors (N = 7 samples) and non-malignant samples (N = 6 samples). Cells with expanded TCRs from the proliferating (CD4PROLIF, green), regulatory (CD4IL2RAHI and CD4IL2RALO, shades of red), and cytotoxic (CD4GZMB and CD4GZMK, shades of purple) states were used for this analysis. Specific branches corresponding to proliferating cytotoxic cells (top right), non-proliferating cytotoxic cells (bottom right), proliferating regulatory cells (top left), and non-proliferating regulatory cells (bottom left) are labeled. Right panel: branches are color-coded according to the above proliferating or non-proliferating identities. Also labeled are branch points that discriminate proliferating and non-proliferating cytotoxic CD4+ T cells (branch point 1) and proliferating and non-proliferating regulatory T cells (branch point 2). (E) Heatmap showing all differentially expressed genes (columns) between branches for branch point 1 across cells in the pseudotime analysis (rows). Cells are grouped by their proliferating or non-proliferating branch assignments, color-coded at the right of the heatmap and corresponding to colors in (D). Genes are grouped by color-coded clusters (1–8) shown at the top of the plot, which result from hierarchical clustering based on co-regulation in specific branches. (F) Cytotoxic CD4+ T cell gene signature scores were plotted in clinical responders (complete response or partial response) versus non-responders (stable disease or progressive disease) from baseline metastatic biopsies from bladder cancer patients with inflamed tumors on the IMvigor210 clinical trial (N = 62 tumors). The signature score was obtained from the IMvigor210 bulk RNA-seq dataset for the cytotoxic CD4+ T cell-specific genes derived from non-proliferating (cluster 4) and proliferating (cluster 7) cytotoxic CD4+ clusters from the pseudotime analysis shown below the heatmap in (E). Median ± SEM is shown; p = 0.037 by two-tailed t test.

Comment in

References

    1. Aran D., Looney A.P., Liu L., Wu E., Fong V., Hsu A., Chak S., Naikawadi R.P., Wolters P.J., Abate A.R. Reference-based analysis of lung single-cell sequencing reveals a transitional profibrotic macrophage. Nat. Immunol. 2019;20:163–172. - PMC - PubMed
    1. Arlehamn C.L., Seumois G., Gerasimova A., Huang C., Fu Z., Yue X., Sette A., Vijayanand P., Peters B. Transcriptional profile of tuberculosis antigen-specific T cells reveals novel multifunctional features. J. Immunol. 2014;193:2931–2940. - PMC - PubMed
    1. Ayers M., Lunceford J., Nebozhyn M., Murphy E., Loboda A., Kaufman D.R., Albright A., Cheng J.D., Kang S.P., Shankaran V. IFN-γ-related mRNA profile predicts clinical response to PD-1 blockade. J. Clin. Invest. 2017;127:2930–2940. - PMC - PubMed
    1. Baras A.S., Drake C., Liu J.J., Gandhi N., Kates M., Hoque M.O., Meeker A., Hahn N., Taube J.M., Schoenberg M.P. The ratio of CD8 to Treg tumor-infiltrating lymphocytes is associated with response to cisplatin-based neoadjuvant chemotherapy in patients with muscle invasive urothelial carcinoma of the bladder. OncoImmunology. 2016;5:e1134412. - PMC - PubMed
    1. Bolotin D.A., Poslavsky S., Mitrophanov I., Shugay M., Mamedov I.Z., Putintseva E.V., Chudakov D.M. MiXCR: software for comprehensive adaptive immunity profiling. Nat. Methods. 2015;12:380–381. - PubMed

Publication types

MeSH terms

Substances

Associated data