

Characterization of miRNAs in Cultured Atlantic Salmon Head Kidney Monocyte-Like and Macrophage-Like Cells
- PMID: 32498303
- PMCID: PMC7312525
- DOI: 10.3390/ijms21113989
Characterization of miRNAs in Cultured Atlantic Salmon Head Kidney Monocyte-Like and Macrophage-Like Cells
Abstract
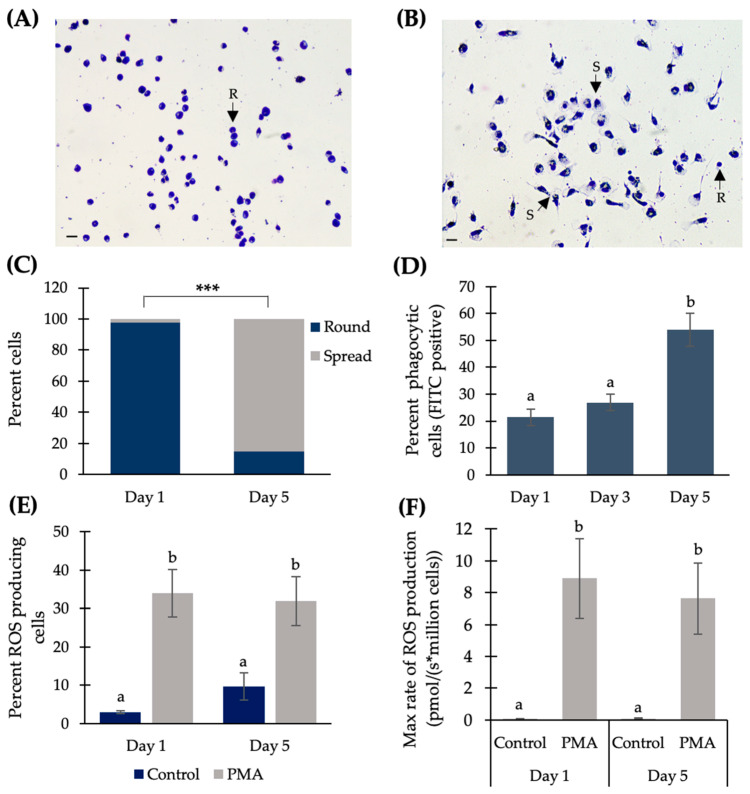
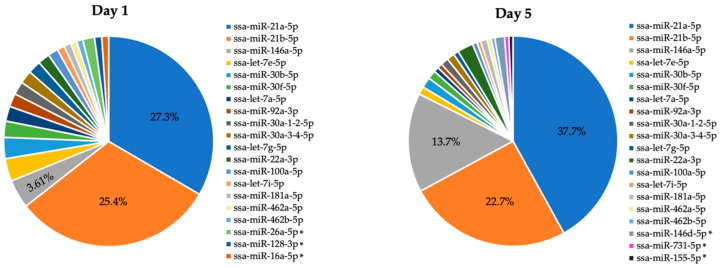
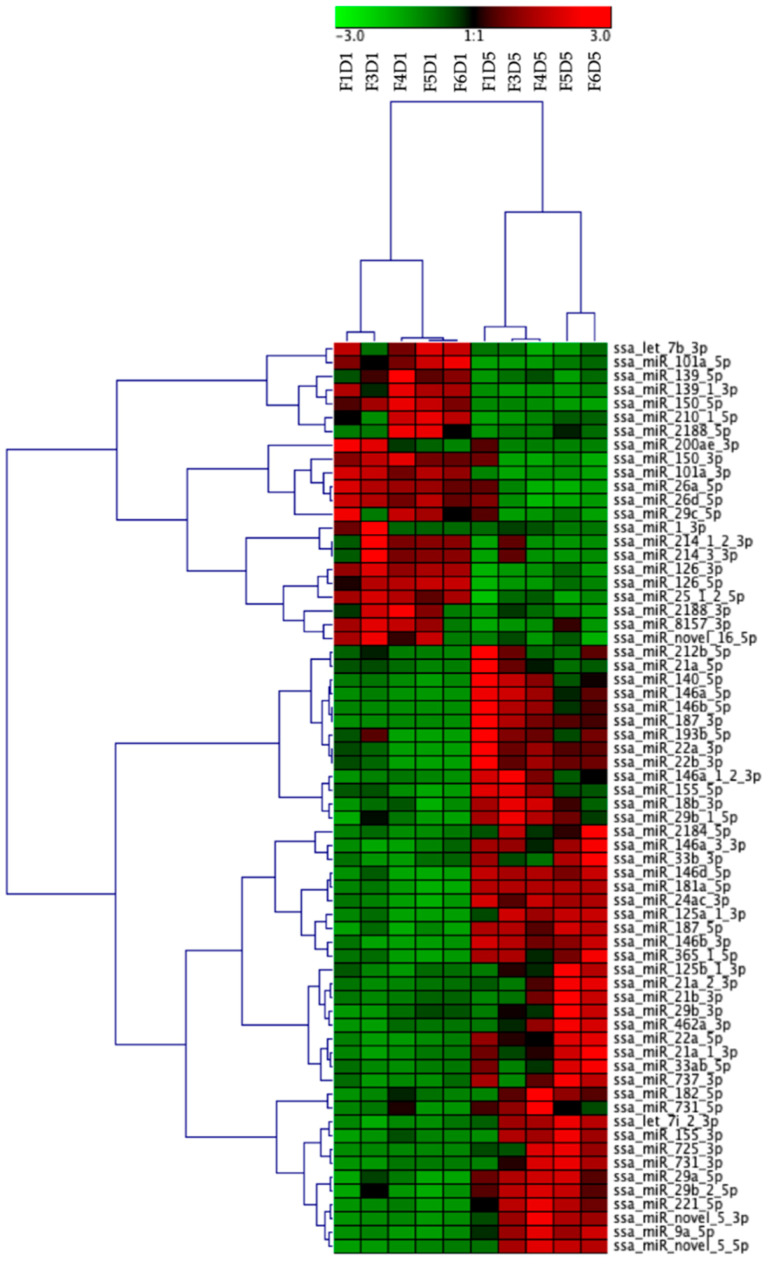
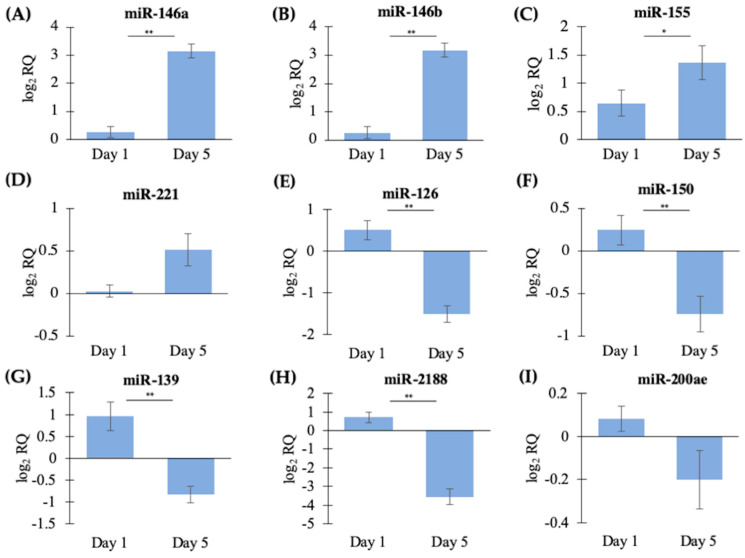
Macrophages are among the first cells to respond to infection and disease. While microRNAs (miRNAs) are involved in the process of monocyte-to-macrophage differentiation in mammals, less is known in teleost fish. Here, Atlantic salmon head kidney leukocytes (HKLs) were used to study the expression of miRNAs in response to in vitro culture. The morphological analysis of cultures showed predominantly monocyte-like cells on Day 1 and macrophage-like cells on Day 5, suggesting that the HKLs had differentiated from monocytes to macrophages. Day 5 HKLs also contained a higher percentage of phagocytic cells. Small RNA sequencing and qPCR analysis were applied to examine the miRNA diversity and expression. There were 370 known mature Atlantic salmon miRNAs in HKLs. Twenty-two miRNAs (15 families) were downregulated while 44 miRNAs (25 families) were upregulated on Day 5 vs. Day 1. Mammalian orthologs of many of the differentially expressed (DE) miRNAs are known to regulate macrophage activation and differentiation, while the teleost-specific miR-2188, miR-462 and miR-731 were also DE and are associated with immune responses in fish. In silico predictions identified several putative target genes of qPCR-validated miRNAs associated with vertebrate macrophage differentiation. This study identified Atlantic salmon miRNAs likely to influence macrophage differentiation, providing important knowledge for future functional studies.
Keywords: Atlantic salmon; cell differentiation; head kidney culture; macrophages; miRNA; sequencing.
Conflict of interest statement
The authors declare no conflict of interest.
Figures
Similar articles
-
Transcriptome Profiling of Atlantic Salmon Adherent Head Kidney Leukocytes Reveals That Macrophages Are Selectively Enriched During Culture.Front Immunol. 2021 Aug 16;12:709910. doi: 10.3389/fimmu.2021.709910. eCollection 2021. Front Immunol. 2021. PMID: 34484211 Free PMC article.
-
Characterization of miRNAs in Extracellular Vesicles Released From Atlantic Salmon Monocyte-Like and Macrophage-Like Cells.Front Immunol. 2020 Nov 11;11:587931. doi: 10.3389/fimmu.2020.587931. eCollection 2020. Front Immunol. 2020. PMID: 33262769 Free PMC article.
-
Discovery of microRNAs associated with the antiviral immune response of Atlantic cod macrophages.Mol Immunol. 2018 Jan;93:152-161. doi: 10.1016/j.molimm.2017.11.015. Epub 2017 Nov 27. Mol Immunol. 2018. PMID: 29190475
-
miRNA in Macrophage Development and Function.Antioxid Redox Signal. 2016 Nov 20;25(15):795-804. doi: 10.1089/ars.2016.6728. Epub 2016 Aug 19. Antioxid Redox Signal. 2016. PMID: 27353423 Free PMC article. Review.
-
MicroRNA regulation of macrophages in human pathologies.Cell Mol Life Sci. 2016 Sep;73(18):3473-95. doi: 10.1007/s00018-016-2254-6. Epub 2016 May 2. Cell Mol Life Sci. 2016. PMID: 27137182 Free PMC article. Review.
Cited by
-
Expression Analysis in Atlantic Salmon Liver Reveals miRNAs Associated with Smoltification and Seawater Adaptation.Biology (Basel). 2022 Apr 30;11(5):688. doi: 10.3390/biology11050688. Biology (Basel). 2022. PMID: 35625416 Free PMC article.
-
Why Does Piscirickettsia salmonis Break the Immunological Paradigm in Farmed Salmon? Biological Context to Understand the Relative Control of Piscirickettsiosis.Front Immunol. 2022 Mar 21;13:856896. doi: 10.3389/fimmu.2022.856896. eCollection 2022. Front Immunol. 2022. PMID: 35386699 Free PMC article. Review.
-
Expression Analysis of Moritella viscosa-Challenged Atlantic Salmon Identifies Disease-Responding Genes, MicroRNAs and Their Predicted Target Genes and Pathways.Int J Mol Sci. 2022 Sep 23;23(19):11200. doi: 10.3390/ijms231911200. Int J Mol Sci. 2022. PMID: 36232504 Free PMC article.
-
Macrophage Heterogeneity in the Intestinal Cells of Salmon: Hints From Transcriptomic and Imaging Data.Front Immunol. 2021 Dec 23;12:798156. doi: 10.3389/fimmu.2021.798156. eCollection 2021. Front Immunol. 2021. PMID: 35003123 Free PMC article.
-
Transcriptome Profiling of Atlantic Salmon Adherent Head Kidney Leukocytes Reveals That Macrophages Are Selectively Enriched During Culture.Front Immunol. 2021 Aug 16;12:709910. doi: 10.3389/fimmu.2021.709910. eCollection 2021. Front Immunol. 2021. PMID: 34484211 Free PMC article.
References
MeSH terms
Substances
Grants and funding
- 280839/E40/Norwegian Research Council grant to R.A.
- HNP-2015/10026/High North Programme of Norway grant to R.A. and M.L.R
- Discovery Grant to M.L.R. (341304-2012)/Natural Sciences and Engineering Research Council of Canada
- Discovery Grant to S.L.C. (2017-04630)/Natural Sciences and Engineering Research Council of Canada
- PGS D fellowship to N.C.S./Natural Sciences and Engineering Research Council of Canada
LinkOut - more resources
Full Text Sources
