. 2020 Jun 2;12(6):1650.
doi: 10.3390/nu12061650.

Heightened Plasma Levels of Transforming Growth Factor Beta (TGF-β) and Increased Degree of Systemic Biochemical Perturbation Characterizes Hepatic Steatosis in Overweight Pediatric Patients: A Cross-Sectional Study

Affiliations

Heightened Plasma Levels of Transforming Growth Factor Beta (TGF-β) and Increased Degree of Systemic Biochemical Perturbation Characterizes Hepatic Steatosis in Overweight Pediatric Patients: A Cross-Sectional Study

Junaura R Barretto et al. Nutrients. .

Abstract

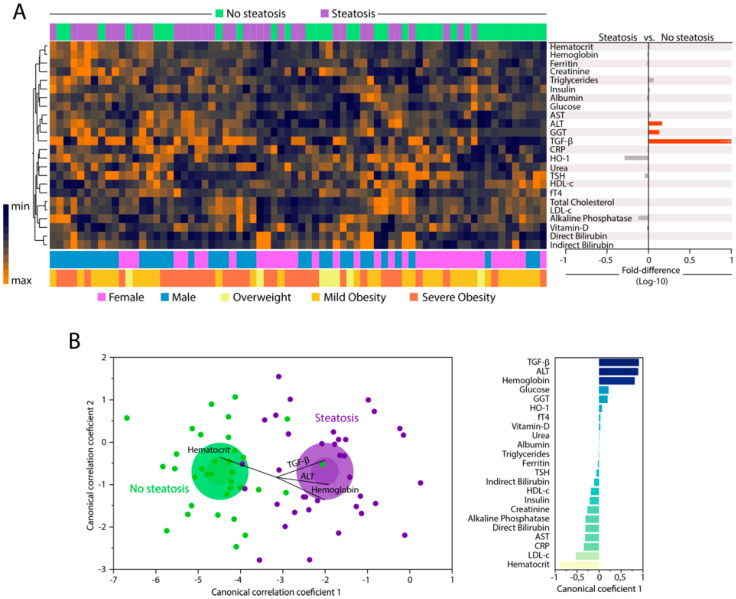
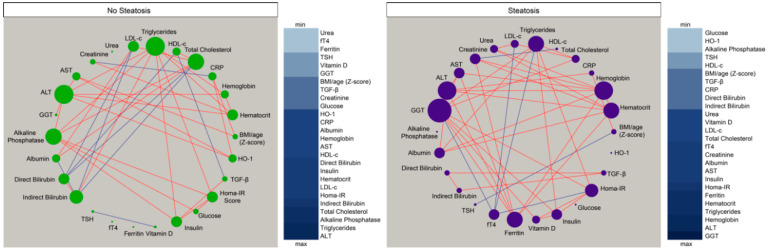
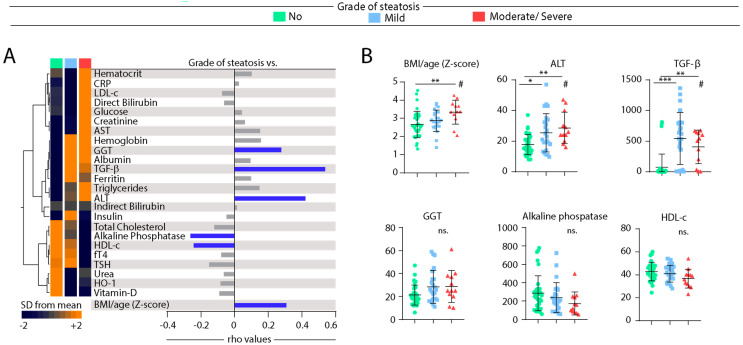
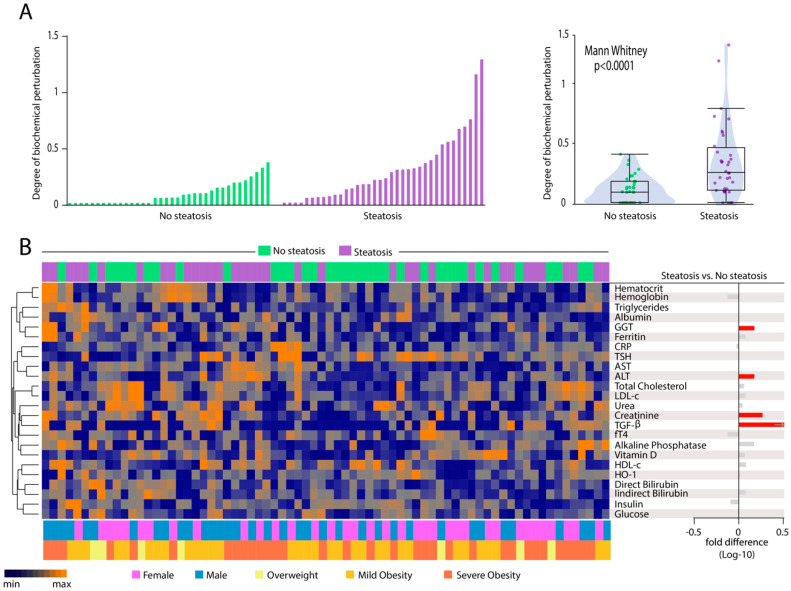
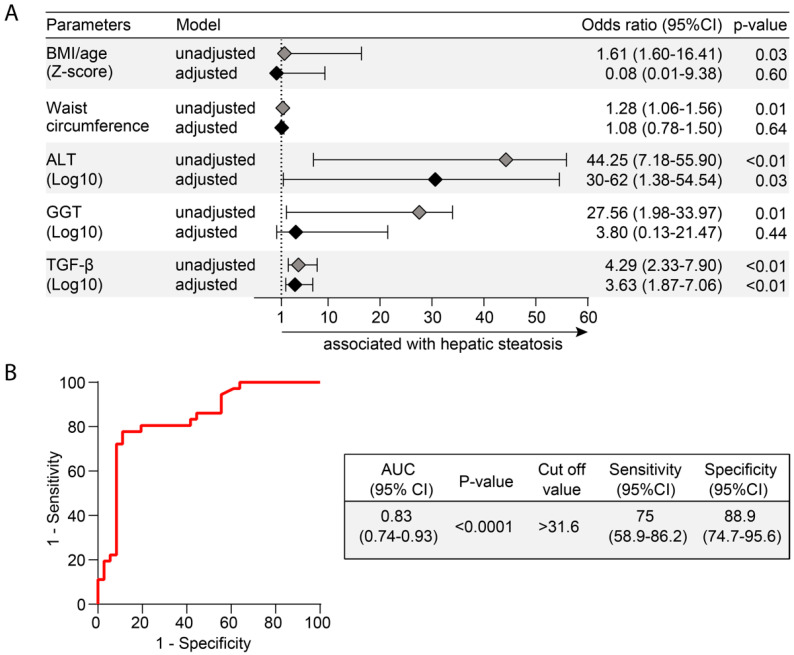
Nonalcoholic Fatty Liver Disease (NAFLD) is a common cause of chronic liver disease in childhood and strongly associated with obesity. Routine biochemical non-invasive tests remain with low accuracy for diagnosis of NAFLD. We performed a cross-sectional study to examine potential associations between anthropometric and biochemical parameters, specially TGF-β, a prognosis marker for hepatic steatosis (HS). Between May and October 2019, seventy-two overweight adolescents were enrolled, of which 36 had hepatic steatosis. Hepatic, lipidic and glycemic profiles, and levels of vitamin D, ferritin and TGF-β were analyzed. Hierarchical cluster and a discriminant model using canonical correlations were employed to depict the overall expression profile of biochemical markers and the biochemical degree of perturbation. Median values of alanine aminotransferase (ALT), gamma glutamyl transpeptidase (GGT), and TGF-β were higher in the adolescents with HS. Values of body mass index (BMI)/age and ALT, but not of TGF-β, were gradually increased proportionally to augmentation of steatosis severity. In a multivariate analysis, TGF-β plasma concentrations were associated with occurrence of hepatic steatosis independent of other covariates. Discriminant analysis confirmed that TGF-β concentrations can identify HS cases. Our data reveal that HS patients exhibit a distinct biosignature of biochemical parameters and imply TGF-β as an important biomarker to evaluate risk of steatosis development.

Keywords: cross-sectional studies; non-alcoholic fatty liver disease; pediatric obesity; systemic biochemical perturbation; transaminases; transforming growth factor beta.


Conflict of interest statement

The authors declare no conflict of interest.

Figures

Figure 1
Figure 1
Changes in biochemical proteins of peripheral blood distinguish patients with and without hepatic steatosis. Plasma was assessed in samples from patients without hepatic steatosis (n = 36) and patients with hepatic steatosis (n = 36). Data were Log10 transformed and z-score normalized. (A) Left panel: In hierarchical cluster analysis (Ward’s method with 100X bootstrap) was employed to depict the overall expression of plasma proteins in study population. Right panel: Average fold-difference values in plasma proteins levels for patients with hepatic steatosis and without steatosis group. Differences which reached statistical significance with the Mann-Whitney U test adjusted for multiple comparisons using the Holm-Bonferroni’s method (Adjusted p < 0.05) are represented in colored bars. (B) Left panel: In an exploratory approach, a sparse canonical correlation analysis (sCCA) was employed to test whether experimental groups could be distinguished based on correlation profiles of the combined circulating markers. Vector analysis was used to plot the direction of influence of the most significant parameters in the canonical space. Right panel: Canonical coefficient scores were calculated to identify the biomarkers responsible for the difference between groups in the sCCA model. Abbreviations (alphabetic order): ALT: alanine aminotransferase; AST: aspartate aminotransferase; CRP: C-reactive protein; fT4: free thyroxine; GGT: gamma-glutamyl transferase; HDL-c: high density cholesterol; HO-1: heme oxygenase-1; TGF-β: transforming growth factor β; TSH: thyroid-stimulating hormone.
Figure 2
Figure 2
Hepatic steatosis leads consistent changes in correlations between plasma proteins concentrations. Network analysis of the biomarker correlation matrices was performed with bootstrap (100×). Significant correlations (p < 0.05) are shown. Each circle represents a different parameter. Circle size infers number of correlations involving each parameter. Lines represent the rho values. Red color infers positive correlation whereas blue color denotes negative correlations. Node analysis heatmap shows the number of statistically significant correlations involving each marker per clinical group. Abbreviations (alphabetic order): ALT: alanine aminotransferase; AST: aspartate aminotransferase; BMI: body mass index; CRP: C-reactive protein; fT4: free thyroxine; GGT: gamma-glutamyl transferase; HDL-c: high density cholesterol; HO-1: heme oxygenase-1; Homa-IR: homeostatic model assessment; TGF-β: transforming growth factor β; TSH: thyroid-stimulating hormone.
Figure 3
Figure 3
Spearman correlation of biochemical parameters in blood of patients according grade of hepatic steatosis. (A) Left panel: Data on each parameter was Log10 transformed. Mean values for each indicated clinical group were z-score normalized and a Hierarchical cluster analysis was performed to illustrate the overall biochemical profiles according the grade of diseases. Right panel: Correlation between grade of hepatic steatosis and biochemical parameters. Spearman correlation analysis was used, and rho values are shown. Blue lines represent correlations with statistical relevance. (B) Scatterplots of concentrations of indicated parameter which values presented statistically significant differences between the study groups using the Kruskal-Wallis test with Dunn’s multiple comparisons ad hoc test (* p < 0.05, ** p < 0.01, *** p < 0.001, ns: nonsignificant) # represent statistical significance (p < 0.05) of non-parametric linear trend ad hoc test. Bars represent median values whereas whiskers represent the interquartile ranges. Abbreviations (alphabetic order): ALT: alanine aminotransferase; AST: aspartate aminotransferase; BMI: body mass index; CRP: C-reactive protein; fT4: free thyroxine; GGT: gamma-glutamyl transferase; HDL-c: high density cholesterol; HO-1: heme oxygenase-1; TGF-β: transforming growth factor β; TSH: thyroid-stimulating hormone.
Figure 4
Figure 4
Hepatic steatosis is associated with increases in degree of biochemical perturbation. (A) Left panel: Histograms show the single sample degree of biochemical perturbation (DBP) score values relative to each study group as indicated. Right panel: Box plots represent the distribution of the DBP between study groups. Values were compared between patients with and without steatosis using Mann Whitney U test. (B) Left panel: A hierarchical cluster analysis (Ward’s method) was employed to show the molecular degree of perturbation of each biochemical marker. Right panel: Average fold-difference values in DBP for patients with hepatic steatosis and without steatosis group. Abbreviations (alphabetic order): ALT: alanine aminotransferase; AST: aspartate aminotransferase; CRP: C-reactive protein; fT4: free thyroxine; GGT: gamma-glutamyl transferase; HDL-c: high density cholesterol; HO-1: heme oxygenase-1; TGF-β: transforming growth factor β; TSH: thyroid-stimulating hormone.
Figure 5
Figure 5
Biochemical parameters associated with hepatic steatosis. (A) Multivariable regression model of variables that were statistically significant (p < 0.05) in univariate comparisons (see univariate comparisons in Tables S1 and S2). (B) Receiver Operator Characteristic (ROC) curves were employed to test the performance of TGF-β to distinguish patients with or without hepatic steatosis. Abbreviations (alphabetic order): ALT: alanine aminotransferase; AST: aspartate aminotransferase; AUC: area under the curve; BMI: body mass index; 95% CI: 95% confidence interval; GGT: gamma-glutamyl transferase; TGF-β: transforming growth factor β.

References

    1. Vos M.B., Abrams S.H., Barlow S.E., Caprio S., Daniels S.R., Kohli R., Mouzaki M., Sathya P., Schwimmer J.B., Sundaram S.S., et al. NASPGHAN Clinical Practice Guideline for the Diagnosis and Treatment of Nonalcoholic Fatty Liver Disease in Children: Recommendations from the Expert Committee on NAFLD (ECON) and the North American Society of Pediatric Gastroenterology, Hepatology and Nutrition (NASPGHAN) J. Pediatr. Gastroenterol. Nutr. 2017;64:319–334. doi: 10.1097/MPG.0000000000001482. - DOI - PMC - PubMed
    1. Sheka A.C., Adeyi O., Thompson J., Hameed B., Crawford P.A., Ikramuddin S. Nonalcoholic Steatohepatitis: A Review. JAMA. 2020;323:1175–1183. doi: 10.1001/jama.2020.2298. - DOI - PubMed
    1. Nobili V., Alkhouri N., Alisi A., Della Corte C., Fitzpatrick E., Raponi M., Dhawan A. Nonalcoholic fatty liver disease: A challenge for pediatricians. JAMA Pediatr. 2015;169:170–176. doi: 10.1001/jamapediatrics.2014.2702. - DOI - PubMed
    1. Anderson E.L., Howe L.D., Jones H.E., Higgins J.P., Lawlor D.A., Fraser A. The Prevalence of Non-Alcoholic Fatty Liver Disease in Children and Adolescents: A Systematic Review and Meta-Analysis. PLoS ONE. 2015;10:e0140908. doi: 10.1371/journal.pone.0140908. - DOI - PMC - PubMed
    1. Draijer L., Benninga M., Koot B. Pediatric NAFLD: An overview and recent developments in diagnostics and treatment. Expert Rev. Gastroenterol. Hepatol. 2019;13:447–461. doi: 10.1080/17474124.2019.1595589. - DOI - PubMed