Review
. 2020 Jun 2;20(11):3149.
doi: 10.3390/s20113149.

Monitoring with In Vivo Electrochemical Sensors: Navigating the Complexities of Blood and Tissue Reactivity

Affiliations
Review

Monitoring with In Vivo Electrochemical Sensors: Navigating the Complexities of Blood and Tissue Reactivity

Pankaj Vadgama. Sensors (Basel). .

Abstract

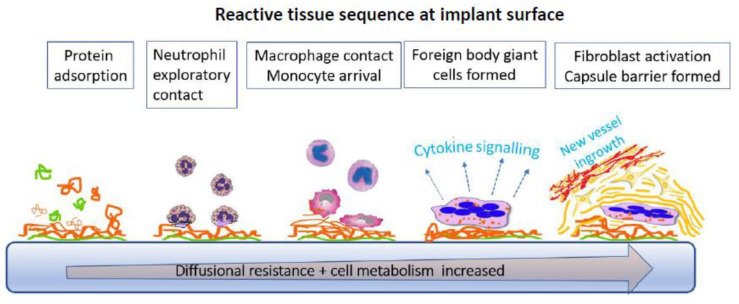
The disruptive action of an acute or critical illness is frequently manifest through rapid biochemical changes that may require continuous monitoring. Within these changes, resides trend information of predictive value, including responsiveness to therapy. In contrast to physical variables, biochemical parameters monitored on a continuous basis are a largely untapped resource because of the lack of clinically usable monitoring systems. This is despite the huge testing repertoire opening up in recent years in relation to discrete biochemical measurements. Electrochemical sensors offer one of the few routes to obtaining continuous readout and, moreover, as implantable devices information referable to specific tissue locations. This review focuses on new biological insights that have been secured through in vivo electrochemical sensors. In addition, the challenges of operating in a reactive, biological, sample matrix are highlighted. Specific attention is given to the choreographed host rejection response, as evidenced in blood and tissue, and how this limits both sensor life time and reliability of operation. Examples will be based around ion, O2, glucose, and lactate sensors, because of the fundamental importance of this group to acute health care.

Keywords: O2; foreign body reaction; glucose; ion selective electrodes; lactate; metabolite sensors; sensor biocompatibility.


Conflict of interest statement

The author declares no conflict of interest, and neither sponsors nor any other party had a role into the materials collection or interpretation in this review.

Figures

Figure 1
Figure 1
Arterial blood pH monitored extracorporeally at a carotid artery loop in an anaesthetised cat using a glass pH electrode. End tidal CO2 was monitored by an infrared CO2 analyser. Administration of 2% CO2 led to increased end tidal CO2 and a drop in arterial pH. The pH trace also shows breath to breath arterial pH oscillations. Adapted from [12].
Figure 2
Figure 2
Double lumen intravascularly placed O2 catheter with haemo-protective NO delivery used in rabbit jugular vein. (-) NO flow protected O2 sensor, (-) control O2 sensor. Blue filled circles are intermittently sampled venous blood pO2 values assayed by in vitro analyser. (A) 100% inspired O2 was switched to 21%. (B) Return to 100% inspired O2 Adapted from [38].
Figure 3
Figure 3
Schematic of progressive relaxation of adsorbed protein layer and increase in surface occupancy per molecule over time. Amount of protein needed for total confluent coverage (jamming) of surface is reduced as time of experimental observation increases. Adapted from [40].
Figure 4
Figure 4
Schematic of surface coagulation sequence. (A) Initial rapid protein deposition, in milliseconds, subject complex, competitive displacement/remodeling via the Vroman effect, e.g., fibrinogen displacement of albumin. (B) Surface activated C3 and Factor XII trigger complement and coagulation cascades, leading to protein/C3b coating (opsonisation) and fibrin directed at the surface. (C) Platelets contact with coated protein sets of adhesion response. (D) Platelet adhesion leads to activation and promotion of fibrin clot, later inflammatory cells incorporated.
Figure 5
Figure 5
Tissue pO2 changes monitored in single rat during haemorrhagic shock. Sensors at matched implantation sites in flank. Initial haemorrhage clamped at reduced BP (40 mmHg); saline only resuscitation stabilises BP (60–70 mmHg); haemorrhage to exsanguination with extreme, terminal drop in BP. Resuscitation regimen would lead to cumulative blood dilution, progressively lowering oxygen carrying capacity to peripheral tissue. Adapted from [52].
Figure 6
Figure 6
Rat cortical tissue pO2 at varying radial distances from (-) arteriole, (-) capillary, and (-) venule using 4 µm tip oxygen sensor showing exponential reduction with distance from vessel axis. Inset shows microsensor (S) on 30 µm diameter arteriole with subsequent vessel dilatation after delivery from nearby micropipette (P). Adapted from [58].
Figure 7
Figure 7
Percentage frequencies of pO2 measured across (A) Normal uterine cervix (seven patients, 432 samples), (B) Cervical cancer (150 patients, 13596 samples). Shaded areas highlight percentage prevalence of extreme tissue hypoxia of <5 mmHg. Each set of data represents combined data points from multiple patient samples. Adapted from [68].
Figure 8
Figure 8
Auxiliary oxygen sensor current decay in subcutaneously implanted glucose sensors in pigs. Data represent one week moving averages of daily mean sampled currents and the spread of data for 60 electrodes. Adapted from [96].
Figure 9
Figure 9
Schematic of tissue foreign body response in sequence: (1) Rapid protein deposition masks sensor surface; deposited layer increases. (2) Tissue neutrophils sense the surface and send chemotactic signals, mast cells promote inflammatory background. (3) Macrophages accumulate with population reinforcement by blood monocytes. (4) Failure to degrade surface stimulates more powerful multinucleated giant cell formation from macrophages, with enhanced signalling. (5) End stage of more quiescent collagen formation and cumulative barrier formation by fibroblasts with parallel neovasularisation.
Figure 10
Figure 10
(A) Schematic of subcutaneously implanted glucose needle electrode within open ended cannula for delivering fluid around the implanted sensor to create a limited hydrated zone. (B) Subcutaneous glucose monitoring in rat (formula image
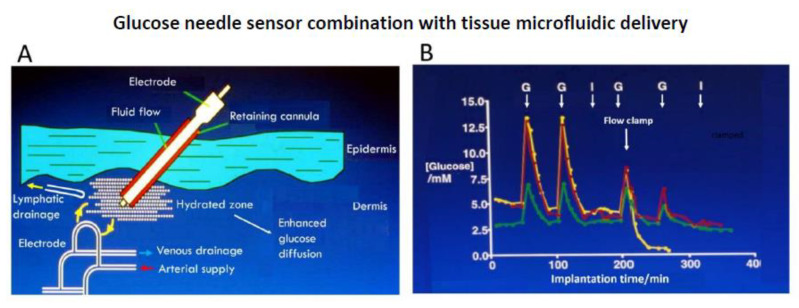
) venous blood glucose, tissue glucose at 60 µL/h microflow (formula image) and at a constrained flow of 10 µL/h (formula image) showing underestimated glucose and total loss of response with clamped flow. Bolus tail vein administration of glucose (G) and insulin (I). Adapted from [83].

Similar articles

Cited by

References

    1. Walker J.L., Brown H.M. Intracellular ionic activity measurements in nerve and muscle. Physiol. Rev. 1977;57:729–778. doi: 10.1152/physrev.1977.57.4.729. - DOI - PubMed
    1. Land S.C., Porterfield D.M., Sanger R.H., Smith P.J.S. The self-referencing oxygen-selective microelectrode: Detection of transmembrane oxygen flux from single cells. J. Exp. Biol. 1999;202:211–218. - PubMed
    1. Wians E.H. Clinical Laboratory Tests: Which, Why, and What Do The Results Mean? Labmedicine. 2009;40:105–113. doi: 10.1309/LM404L0HHUTWWUDD. - DOI
    1. Rodenburg R.J.T., Schoonderwoerd G.C., Tiranti V., Taylor R.W., Rotig A., Valente L., Invernizzi F., Chretien D., He L., Backx G., et al. A multi-center comparison of diagnostic methods for the biochemical evaluation of suspected mitochondrial disorders. Mitochondrion. 2013;13:36–43. doi: 10.1016/j.mito.2012.11.004. - DOI - PMC - PubMed
    1. Laje R., Agostino P.V., Golombek D.A. The Times of Our Lives: Interaction among Different Biological Periodicities. Front. Integr. Neurosci. 2018;12 doi: 10.3389/fnint.2018.00010. - DOI - PMC - PubMed

LinkOut - more resources