

Quantitative and Qualitative Perturbations of CD8+ MAITs in Healthy Mycobacterium tuberculosis-Infected Individuals
- PMID: 32499216
- PMCID: PMC7543048
- DOI: 10.4049/immunohorizons.2000031
Quantitative and Qualitative Perturbations of CD8+ MAITs in Healthy Mycobacterium tuberculosis-Infected Individuals
Erratum in
-
Correction: Quantitative and Qualitative Perturbations of CD8+ MAITs in Healthy Mycobacterium tuberculosis-Infected Individuals.Immunohorizons. 2020 Jul 22;4(7):442-443. doi: 10.4049/immunohorizons.2000064. Immunohorizons. 2020. PMID: 32699177 Free PMC article. No abstract available.
Abstract
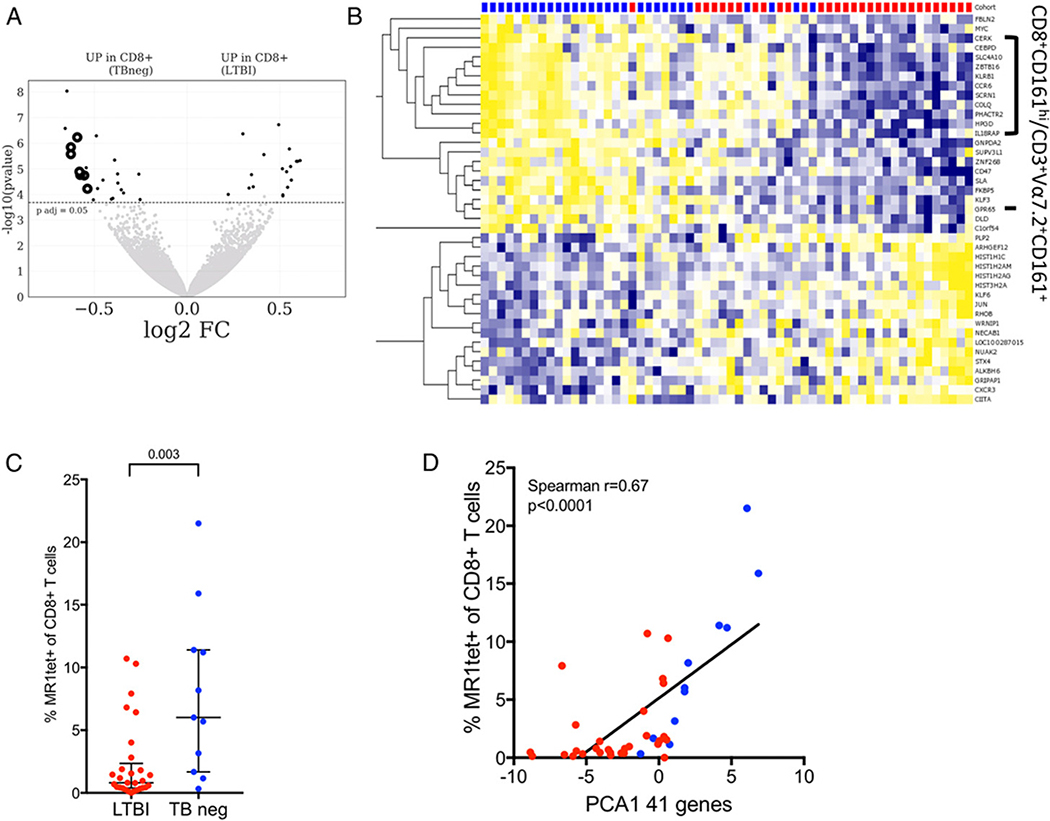
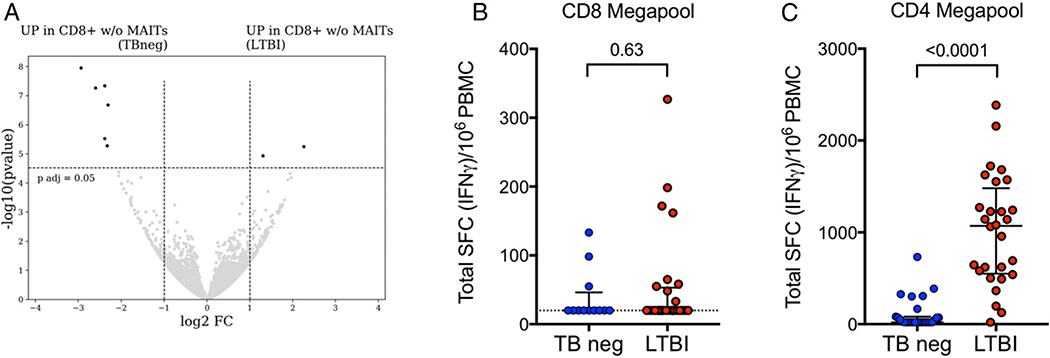
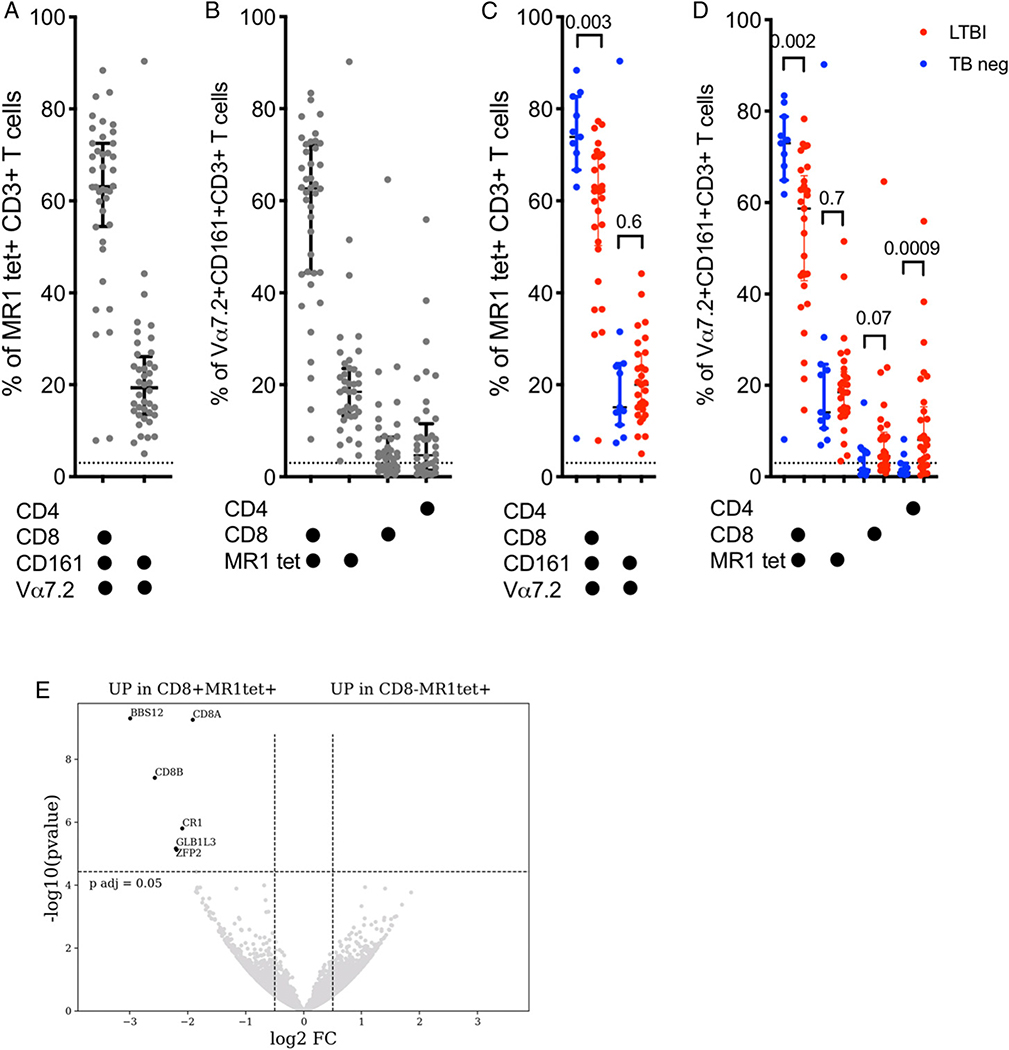
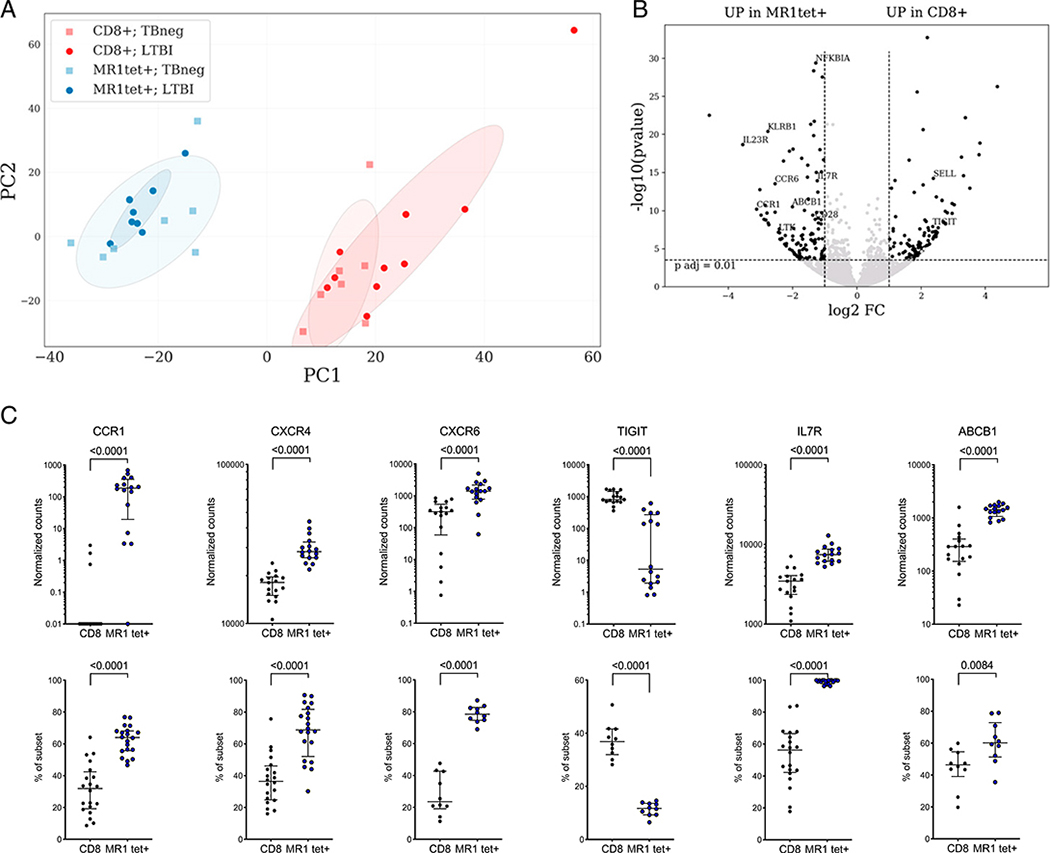
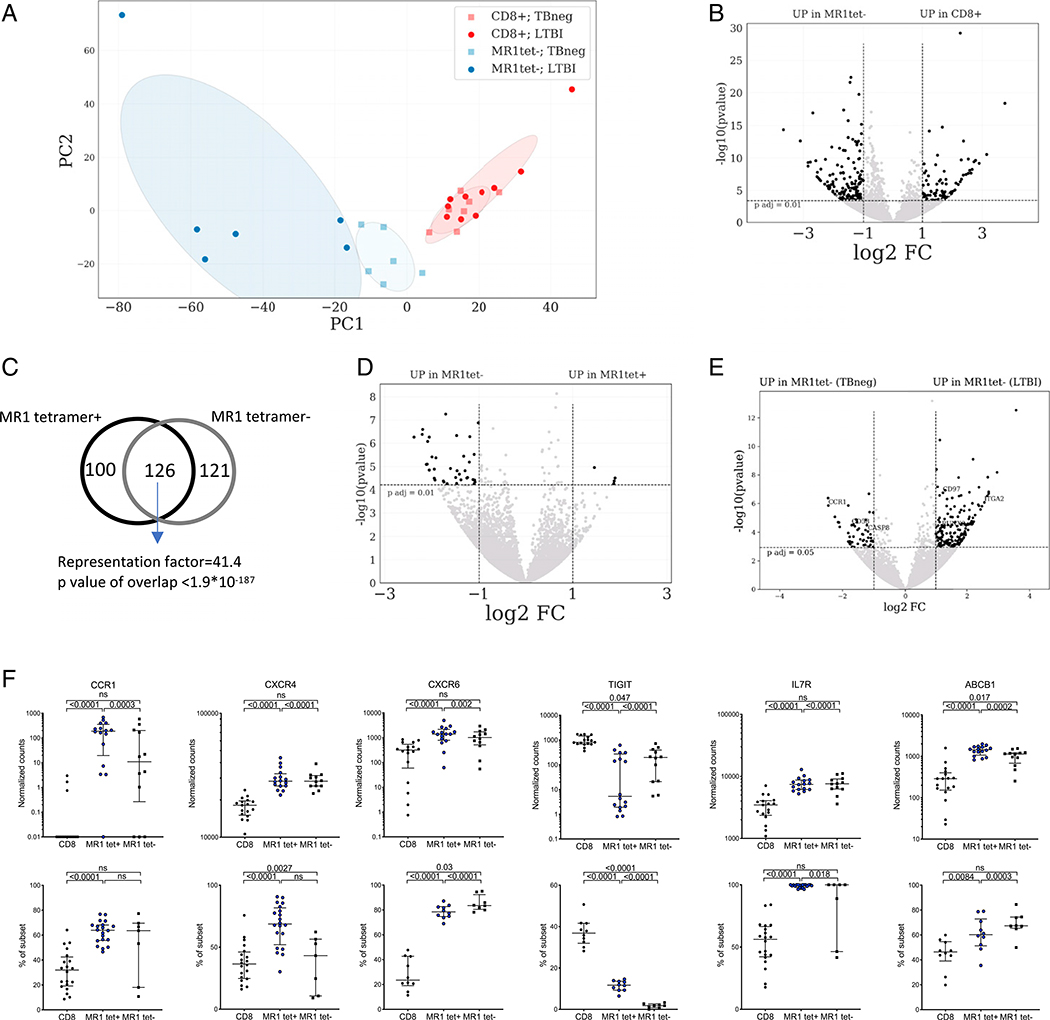
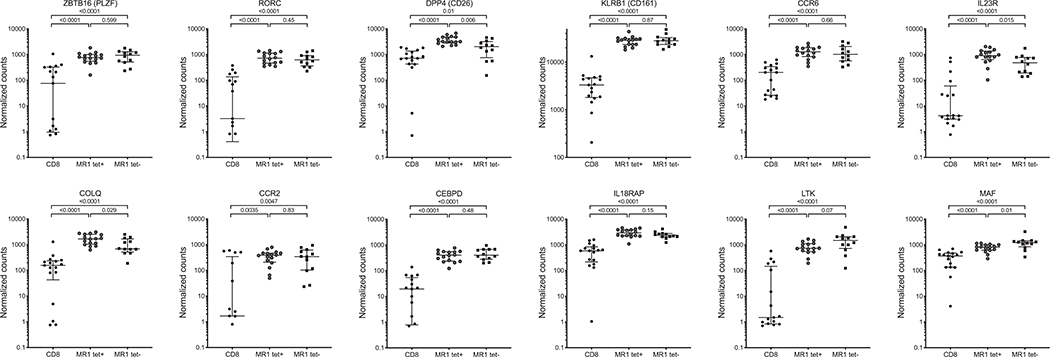
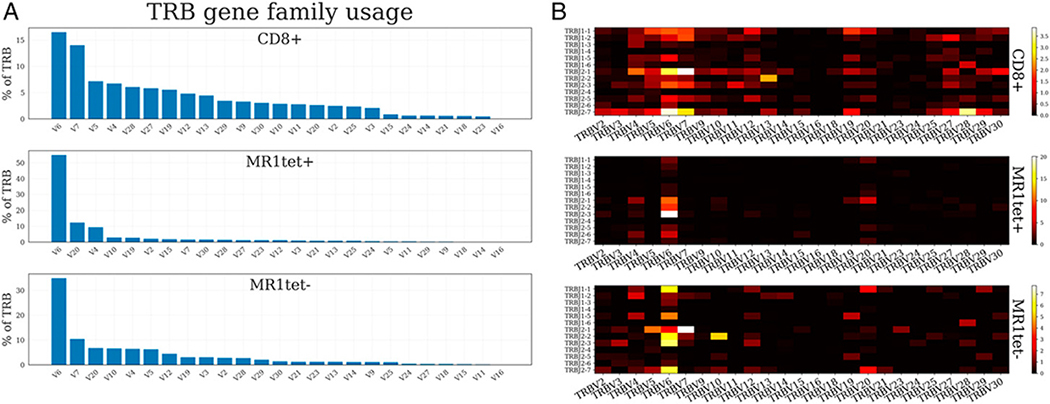
CD8 T cells are considered important contributors to the immune response against Mycobacterium tuberculosis, yet limited information is currently known regarding their specific immune signature and phenotype. In this study, we applied a cell population transcriptomics strategy to define immune signatures of human latent tuberculosis infection (LTBI) in memory CD8 T cells. We found a 41-gene signature that discriminates between memory CD8 T cells from healthy LTBI subjects and uninfected controls. The gene signature was dominated by genes associated with mucosal-associated invariant T cells (MAITs) and reflected the lower frequency of MAITs observed in individuals with LTBI. There was no evidence for a conventional CD8 T cell-specific signature between the two cohorts. We, therefore, investigated MAITs in more detail based on Vα7.2 and CD161 expression and staining with an MHC-related protein 1 (MR1) tetramer. This revealed two distinct populations of CD8+Vα7.2+CD161+ MAITs: MR1 tetramer+ and MR1 tetramer-, which both had distinct gene expression compared with memory CD8 T cells. Transcriptomic analysis of LTBI versus noninfected individuals did not reveal significant differences for MR1 tetramer+ MAITs. However, gene expression of MR1 tetramer- MAITs showed large interindividual diversity and a tuberculosis-specific signature. This was further strengthened by a more diverse TCR-α and -β repertoire of MR1 tetramer- cells as compared with MR1 tetramer+ Thus, circulating memory CD8 T cells in subjects with latent tuberculosis have a reduced number of conventional MR1 tetramer+ MAITs as well as a difference in phenotype in the rare population of MR1 tetramer- MAITs compared with uninfected controls.
Copyright © 2020 The Authors.
Conflict of interest statement
DISCLOSURES
The authors have no financial conflicts of interest.
Figures
Similar articles
-
MR1-restricted mucosal-associated invariant T (MAIT) cells respond to mycobacterial vaccination and infection in nonhuman primates.Mucosal Immunol. 2017 May;10(3):802-813. doi: 10.1038/mi.2016.91. Epub 2016 Oct 19. Mucosal Immunol. 2017. PMID: 27759023 Free PMC article.
-
Postnatal Expansion, Maturation, and Functionality of MR1T Cells in Humans.Front Immunol. 2020 Sep 16;11:556695. doi: 10.3389/fimmu.2020.556695. eCollection 2020. Front Immunol. 2020. PMID: 33042140 Free PMC article.
-
Peripheral blood MR1 tetramer-positive mucosal-associated invariant T-cell function is modulated by mammalian target of rapamycin complex 1 in patients with active tuberculosis.Immunology. 2024 Nov;173(3):497-510. doi: 10.1111/imm.13834. Epub 2024 Jul 18. Immunology. 2024. PMID: 39022997
-
The Diverse Family of MR1-Restricted T Cells.J Immunol. 2018 Nov 15;201(10):2862-2871. doi: 10.4049/jimmunol.1801091. J Immunol. 2018. PMID: 30397170 Review.
-
MR1-restricted T cells: the new dawn of cancer immunotherapy.Biosci Rep. 2020 Nov 27;40(11):BSR20202962. doi: 10.1042/BSR20202962. Biosci Rep. 2020. PMID: 33185693 Free PMC article. Review.
Cited by
-
High-parameter phenotypic characterization reveals a subset of human Th17 cells that preferentially produce IL17 against M. tuberculosis antigen.bioRxiv [Preprint]. 2024 Mar 6:2023.01.06.523027. doi: 10.1101/2023.01.06.523027. bioRxiv. 2024. Update in: Front Immunol. 2024 Apr 18;15:1378040. doi: 10.3389/fimmu.2024.1378040. PMID: 36711855 Free PMC article. Updated. Preprint.
-
Mucosal-associated invariant T cells restrict reactive oxidative damage and preserve meningeal barrier integrity and cognitive function.Nat Immunol. 2022 Dec;23(12):1714-1725. doi: 10.1038/s41590-022-01349-1. Epub 2022 Nov 21. Nat Immunol. 2022. PMID: 36411380 Free PMC article.
-
High-parameter phenotypic characterization reveals a subset of human Th17 cells that preferentially produce IL-17 against M. tuberculosis antigen.Front Immunol. 2024 Apr 18;15:1378040. doi: 10.3389/fimmu.2024.1378040. eCollection 2024. Front Immunol. 2024. PMID: 38698866 Free PMC article.
-
Clinical manifestations and immune response to tuberculosis.World J Microbiol Biotechnol. 2023 May 24;39(8):206. doi: 10.1007/s11274-023-03636-x. World J Microbiol Biotechnol. 2023. PMID: 37221438 Free PMC article. Review.
-
The role of donor-unrestricted T-cells, innate lymphoid cells, and NK cells in anti-mycobacterial immunity.Immunol Rev. 2021 May;301(1):30-47. doi: 10.1111/imr.12948. Epub 2021 Feb 2. Immunol Rev. 2021. PMID: 33529407 Free PMC article. Review.
References
-
- World Health Organization. 2018. Global Tuberculosis Report 2018. World Health Organization, Geneva, Switzerland.
-
- Barnes PF, Bloch AB, Davidson PT, and Snider DE Jr. 1991. Tuberculosis in patients with human immunodeficiency virus infection. N. Engl. J. Med. 324: 1644–1650. - PubMed
-
- Flynn JL, and Chan J. 2001. Immunology of tuberculosis. Annu. Rev. Immunol. 19: 93–129. - PubMed
Publication types
MeSH terms
Substances
Grants and funding
LinkOut - more resources
Full Text Sources
Molecular Biology Databases
Research Materials
