. 2020 Sep;10(9):1282-1295.
doi: 10.1158/2159-8290.CD-20-0329. Epub 2020 Jun 4.

Changes in Aged Fibroblast Lipid Metabolism Induce Age-Dependent Melanoma Cell Resistance to Targeted Therapy via the Fatty Acid Transporter FATP2

Affiliations

Changes in Aged Fibroblast Lipid Metabolism Induce Age-Dependent Melanoma Cell Resistance to Targeted Therapy via the Fatty Acid Transporter FATP2

Gretchen M Alicea et al. Cancer Discov. 2020 Sep.

Erratum in

Abstract

Older patients with melanoma (>50 years old) have poorer prognoses and response rates to targeted therapy compared with young patients (<50 years old), which can be driven, in part, by the aged microenvironment. Here, we show that aged dermal fibroblasts increase the secretion of neutral lipids, especially ceramides. When melanoma cells are exposed to the aged fibroblast lipid secretome, or cocultured with aged fibroblasts, they increase the uptake of lipids via the fatty acid transporter FATP2, which is upregulated in melanoma cells in the aged microenvironment and known to play roles in lipid synthesis and accumulation. We show that blocking FATP2 in melanoma cells in an aged microenvironment inhibits their accumulation of lipids and disrupts their mitochondrial metabolism. Inhibiting FATP2 overcomes age-related resistance to BRAF/MEK inhibition in animal models, ablates tumor relapse, and significantly extends survival time in older animals. SIGNIFICANCE: These data show that melanoma cells take up lipids from aged fibroblasts, via FATP2, and use them to resist targeted therapy. The response to targeted therapy is altered in aged individuals because of the influences of the aged microenvironment, and these data suggest FATP2 as a target to overcome resistance.See related commentary by Montal and White, p. 1255.This article is highlighted in the In This Issue feature, p. 1241.


Figures

Figure 1.
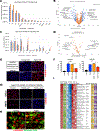
Figure 1.. Melanoma cells display elevated lipid levels when exposed to aged fibroblasts
A. Lipidomics analysis of different lipid class profiles between aged and young fibroblasts. B. Volcano plot analysis of young and aged fibroblasts. C. Secretome analysis of differentially secreted lipid class between aged and young fibroblasts. D. Analysis of young and aged fibroblasts conditioned media after 24hrs.E. Melanoma cells were cultured with young or aged conditioned media for 48hrs. Cells were subsequently stained with dapi and BODIPY 505/515 for lipid visualization and imaged by IF microscopy. F. Melanoma cells treated with 4nM ND646 in the presence of young and aged fibroblast conditioned media for 48hrs followed by Trypan blue exclusion analysis, (two-tailed unpaired-test,p=0.0001 p=0.0024 in order) G. Melanoma cells were cultured with aged fibroblast conditioned media where FASN has been knocked down and cultured for 48 hrs H. Young and aged fibroblasts stained with BODIPY-C12, washed and co-cultured with GFP-tagged melanoma cells. Image shown is a 24h timepoint of movies supplied as supplementary movies. I. Overlap of lipidomics analysis of fibroblast secretomes, and intracellular lipid composition of melanoma cells cultured with young or aged conditioned media for 48 hours. For lipid species, statistical analysis was performed using Perseus 1.6.7.0, as described in the methods.
Figure 2.
Figure 2.. FATP2 is upregulated in melanoma on the aged microenvironment.
A. Melanoma cells were cultured with DMEM, young or aged fibroblast conditioned media for 48 hrs. Cells were probed for FATP2 and FATP1 by immunoblotting. B. TCGA of FATP2 expression in primary melanoma. C. TCGA data analysis of transporters FATP1,3–6 and CD36 in primary melanoma D. Immunofluorescence microscopy of melanoma cells cultured with young and aged fibroblasts CM stained with BODIPY 505/515. E. FATP2 staining in melanoma skin reconstructs made with young or aged fibroblasts. F. FATP2 staining in tumor tissue from young and aged mice. G. Melanoma cells were treated with vehicle control or lipofermata (5uM) for 48hrs. Cells were subsequently stained with dapi and bodipy 505/515 for lipid visualization and imaged by IF microscopy. H. Yumm 1.7 melanoma cells were subcutaneously injected in young (8weeks) and aged (52weeks) mice. A separate cohort of aged mice bearing Yumm 1.7 tumors was treated with lipofermata (2mg/kg, twice a day for two weeks). Tumors were stained with Oil Red O to determine lipid accumulation.
Figure 3.
Figure 3.. In vitro inhibition of FATP2 increases response to BRAFi/MEKi therapy.
A. Melanoma cells grown in 3D spheroids were treated with PLX4720 (3μM), PD0325901 (500nM) and/or Lipofermata (5μM) in the presence of young and aged conditioned media for 48 hrs. Spheroids were subsequently stained with a viability stained and imaged with IF microscopy. Calcein-AM staining (green) signifies viable cells and TOPRO3 staining (red) signifies dead cells. B. Melanoma cells with FATP2 knockdown or empty vector grown in 3D spheroids were treated with PLX4720 (3μM), PD0325901 (500nM). Spheroids were subsequently stained with a viability stained and imaged with IF microscopy. Calcein AM staining (green) signifies viable cells and TOPRO3 staining (red) signifies dead cells C. Western analysis of CPT1 in melanoma cells exposed to young and aged fibroblast conditioned media. D. Melanoma cells exposed to non-CM, young or aged CM for 5 days with or without the CPT1 inhibitor Etomixir. Oxygen consumption rate (OCR) was measured after the treatment of oligomycin (1μM), FCCP (1.5μM) and rotenone/antimycin A (0.5μM). E. Melanoma cells exposed to non-CM, young or aged CM for 3 days prior to treatment with BRAFi/MEKi, Lipofermata or BRAFi/MEKi/Lipofermata treatment for 2 days. Oxygen consumption rate (OCR) was measured after the treatment of oligomycin (1uM), FCCP (1.5uM) and rotenone/antimycin A (0.5μM). F. Human melanoma samples stained with FATP2 and H-Score of patient samples stained with FATP2 plotted against survival in days (Mann-Whitey test, *Signifies p < 0.05). G. Pre and post treatment PDX tissue was stained with FATP2. H. Yumm1.7 melanoma cells were made resistant to the PLX4720/ PD0325901 combination therapy and grown in spheroids. Lipofermata was added to the combination of PLX/PD, and spheroids were assessed for live/ dead staining as described in A. I. Trypan blue viability assay after treatment of melanoma cells with control lipoprotein-depleted media, conditioned media from young fibroblasts, with and without PLX4720 (3μM), PD0325901 (500nM), and with PLX4720 (3μM), PD0325901 (500nM) in the presence of 14.8 ng/mL of ceramides. J. Spheroid assays of 1205LU cells after treatment with conditioned lipoprotein-depleted media from young fibroblasts, with and without PLX4720 (3μM), PD0325901 (500nM), and with PLX4720 (3μM), PD0325901 (500nM) in the presence of 14.8 ng/mL of ceramides. Spheroids were subsequently stained with a viability stained and imaged with IF microscopy. Calcein-AM staining (green) signifies viable cells and TOPRO3 staining (red) signifies dead cells. For all panels, unless otherwise specified, two-tailed unpaired t-test, *=p<0.05; **=p<0.01; ***=p<0.001.
Figure 4.
Figure 4.. FATP2 inhibition enhances BRAF and MEK combinatorial therapy “in vivo”.
A. Yumm 1.7 melanoma cells were grown in young (8weeks). Mouse tumor growth in young mice after treatment with indicated drugs (n=8 per arm). B. Yumm 1.7 melanoma cells were injected in aged mice (52 weeks). Mouse tumor growth in aged and young mice after treatment with indicated drugs (n=8 per arm). C. Survival curve for treatment in figure 4a displaying the time it took for mice to reach death (defined as time when tumor volume exceeded 750mm3). D. Survival curve for treatment on figure 4b displaying the time it took for mice to reach death (defined as time when tumor volume exceeded 750mm3). E. Yumm1.7 FATP2 Tet- inducible cell line was subdermally injected in young mice (8 weeks). Mouse tumor growth in aged and young mice after treatment with indicated drugs in the presence of absence of doxycycline (n=8 per arm). F. Yumm1.7 FATP2 Tet- inducible cell line was subcutaneously injected in aged mice (8=52 weeks). Mouse tumor growth in aged and young mice after treatment with indicated drugs in the presence of absence of doxycycline (n=8 per arm). G. Survival curve for treatment in figure 4E displaying the time it took for mice to reach death (defined as time when tumor volume exceeded 750mm3). H. Survival curve for treatment in figure 4F displaying the time it took for mice to reach death (defined as time when tumor volume exceeded 750mm3). Statistics on all curves were obtained using a linear mixed effects model. N.S., not significant, **=p<0.01, ***p=<0.001. All error bars are standard error of the mean (SEM).

Comment in

References

    1. Jemal A et al. Recent trends in cutaneous melanoma incidence and death rates in the United States, 1992–2006. J Am Acad Dermatol 65, S17–25 e11–13, doi: 10.1016/j.jaad.2011.04.032 (2011). - DOI - PubMed
    1. Siegel RL, Miller KD & Jemal A Cancer statistics, 2020. CA Cancer J Clin 70, 7–30, doi: 10.3322/caac.21590 (2020). - DOI - PubMed
    1. Matthews NH, Li WQ, Qureshi AA, Weinstock MA & Cho E in Cutaneous Melanoma: Etiology and Therapy (eds Ward WH & Farma JM) (2017).
    1. Kaur A et al. sFRP2 in the aged microenvironment drives melanoma metastasis and therapy resistance. Nature 532, 250–254, doi: 10.1038/nature17392 (2016). - DOI - PMC - PubMed
    1. Macdonald JB et al. Malignant melanoma in the elderly: different regional disease and poorer prognosis. J Cancer 2, 538–543, doi: 10.7150/jca.2.538 (2011). - DOI - PMC - PubMed

Publication types

MeSH terms

Substances