. 2020 Jul 8;40(28):5480-5494.
doi: 10.1523/JNEUROSCI.0200-20.2020. Epub 2020 Jun 4.

Enduring Changes in Neuronal Function upon Systemic Inflammation Are NLRP3 Inflammasome Dependent

Affiliations

Enduring Changes in Neuronal Function upon Systemic Inflammation Are NLRP3 Inflammasome Dependent

Marianna M S Beyer et al. J Neurosci. .

Abstract

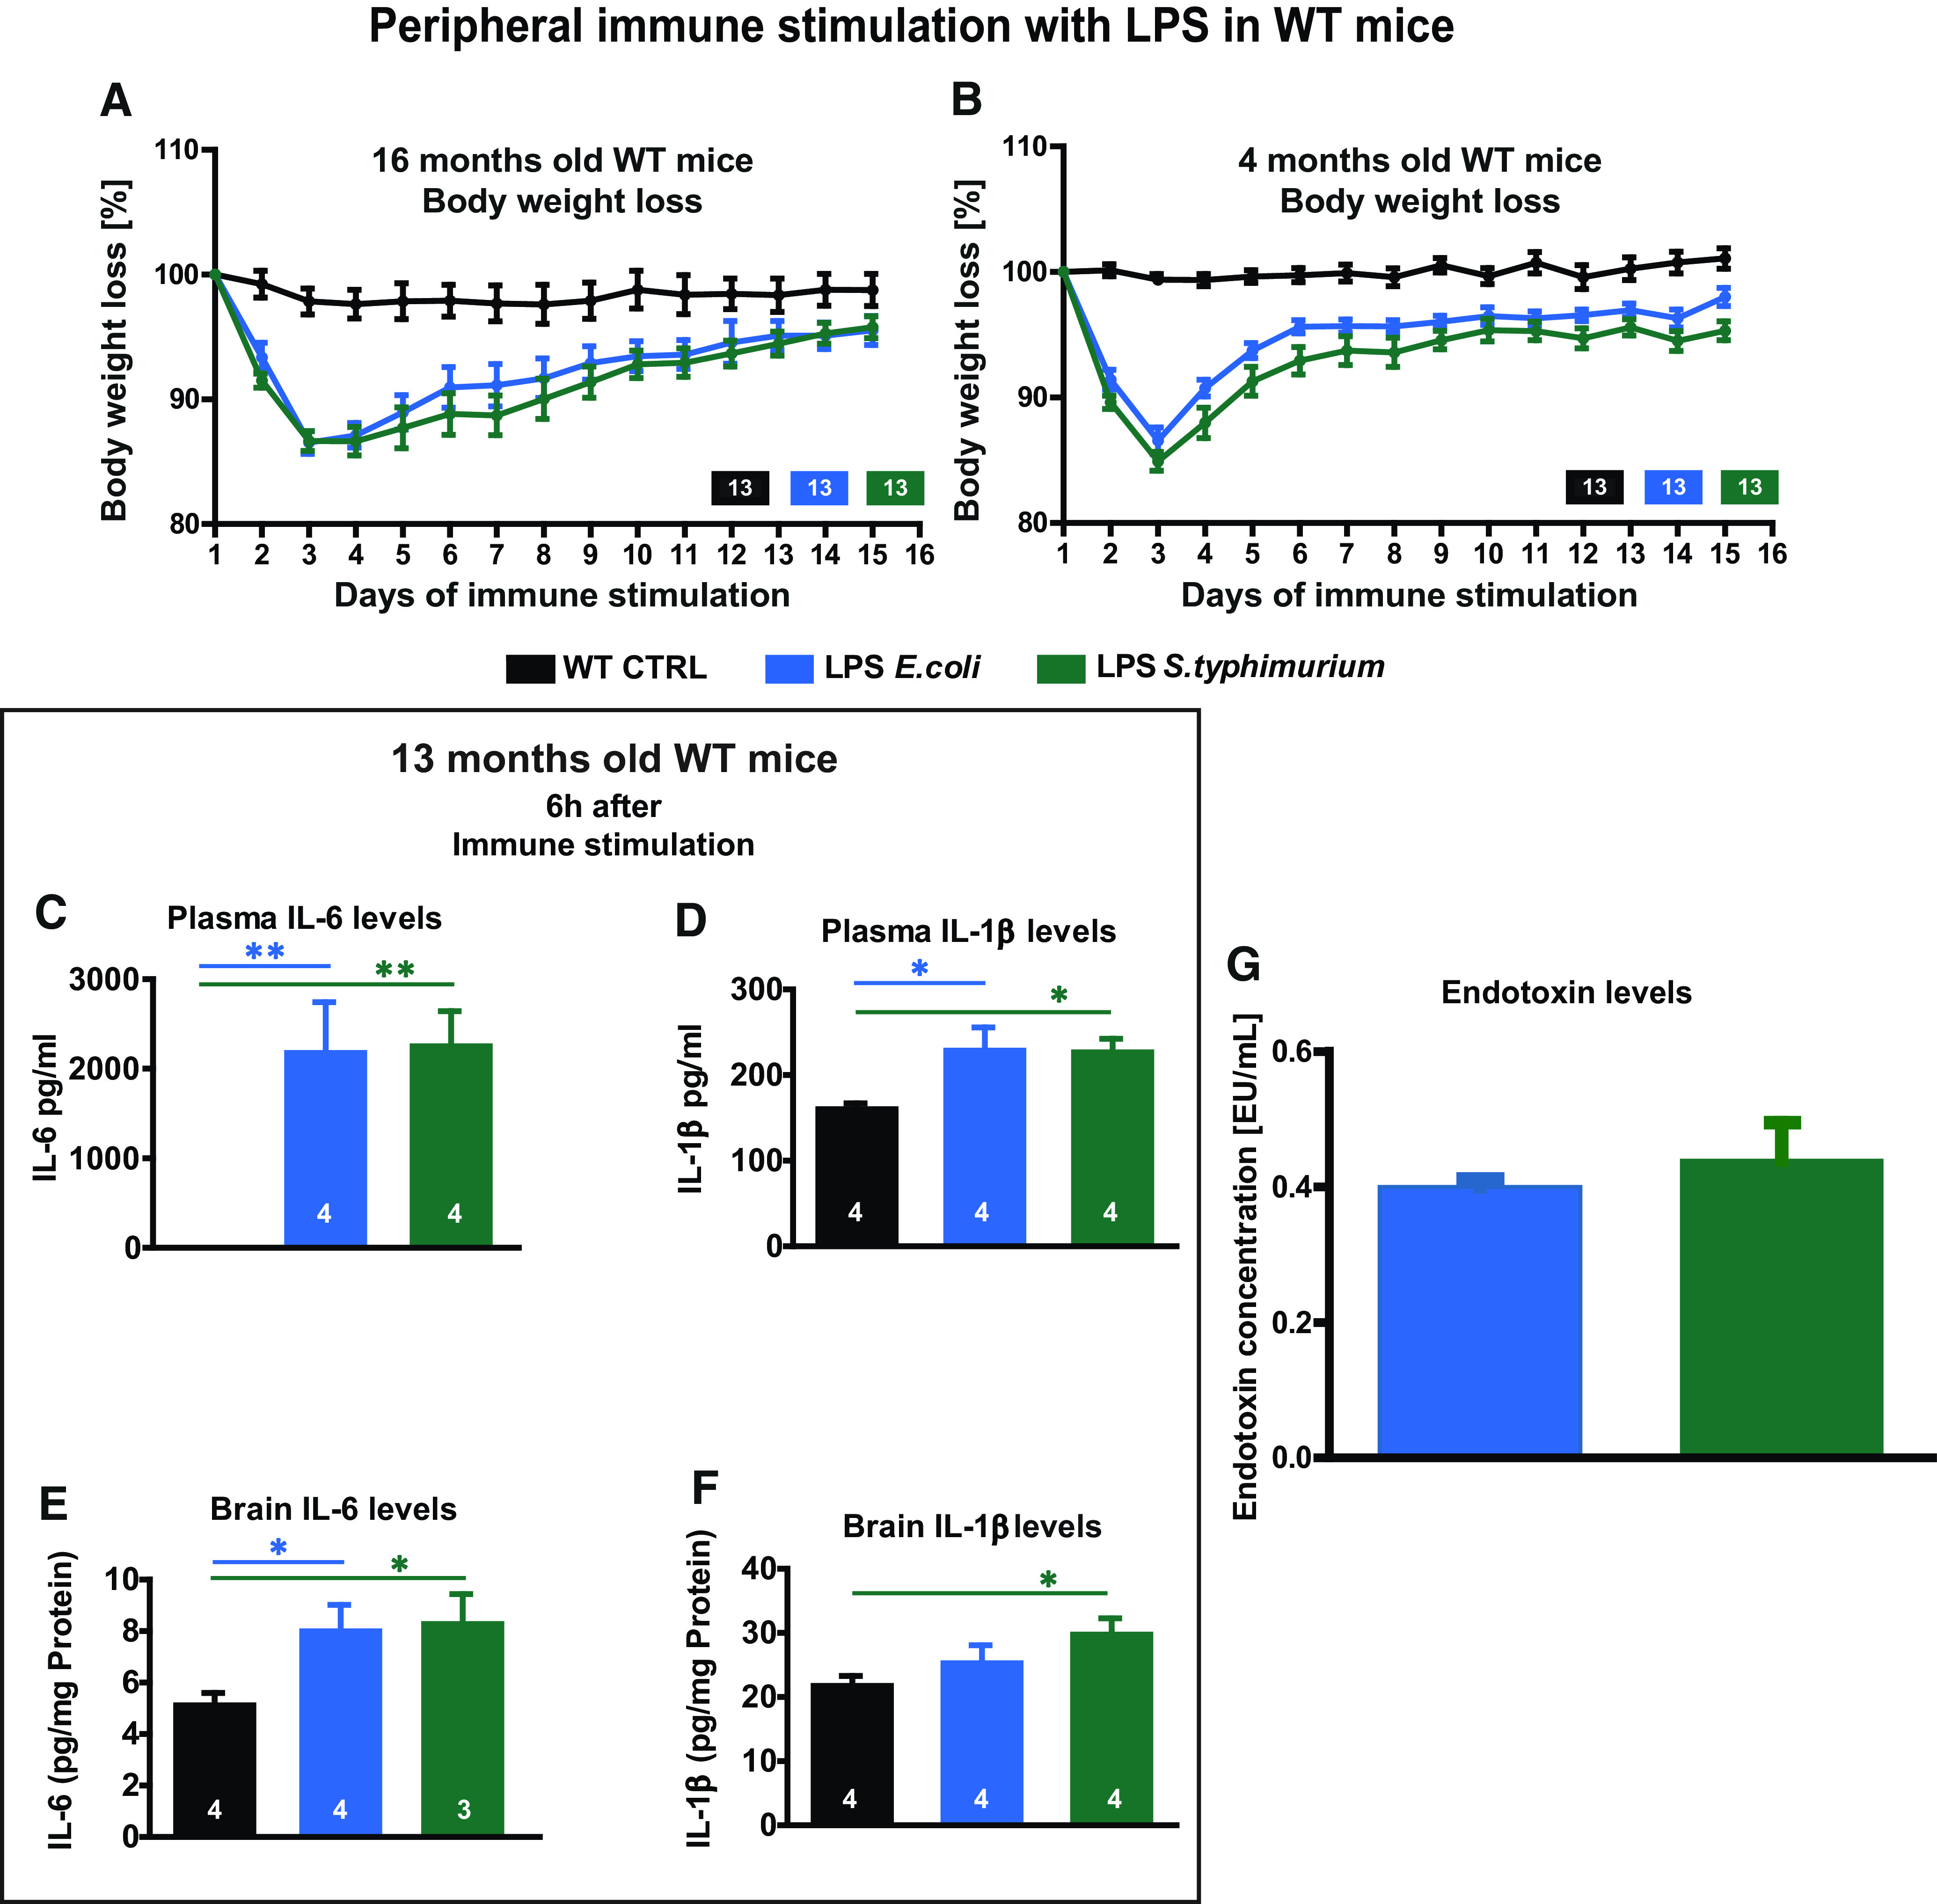
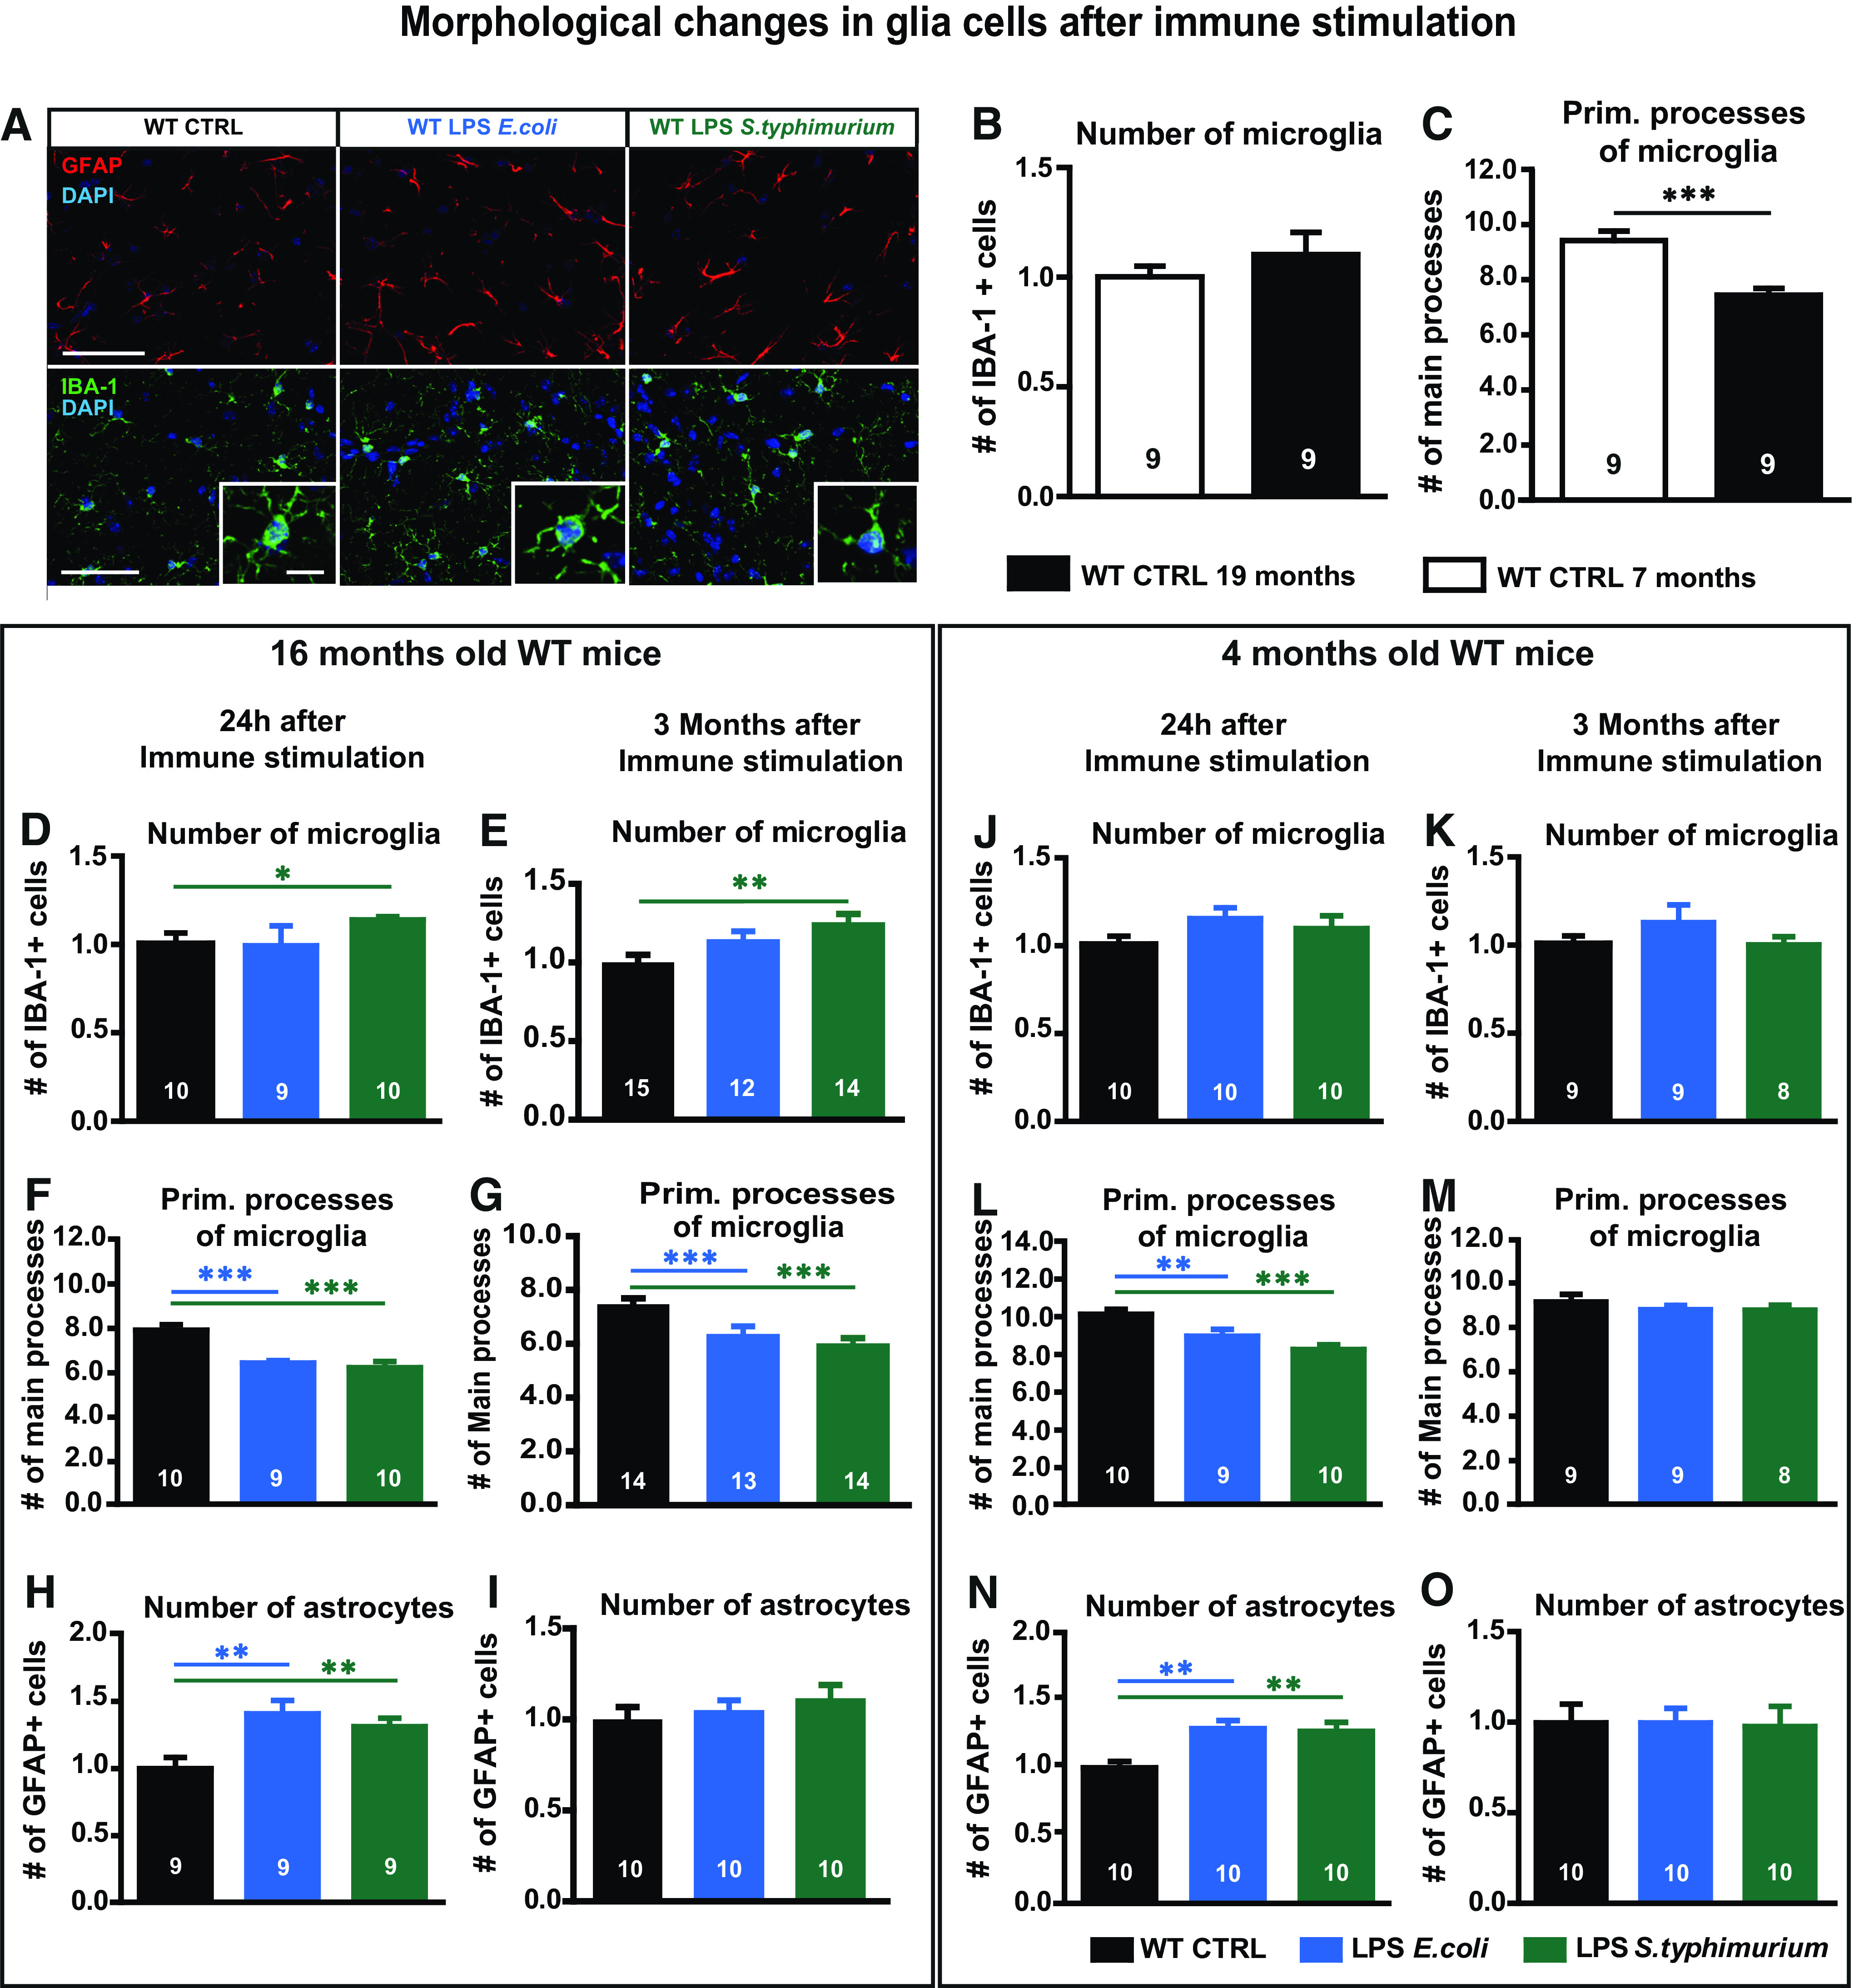
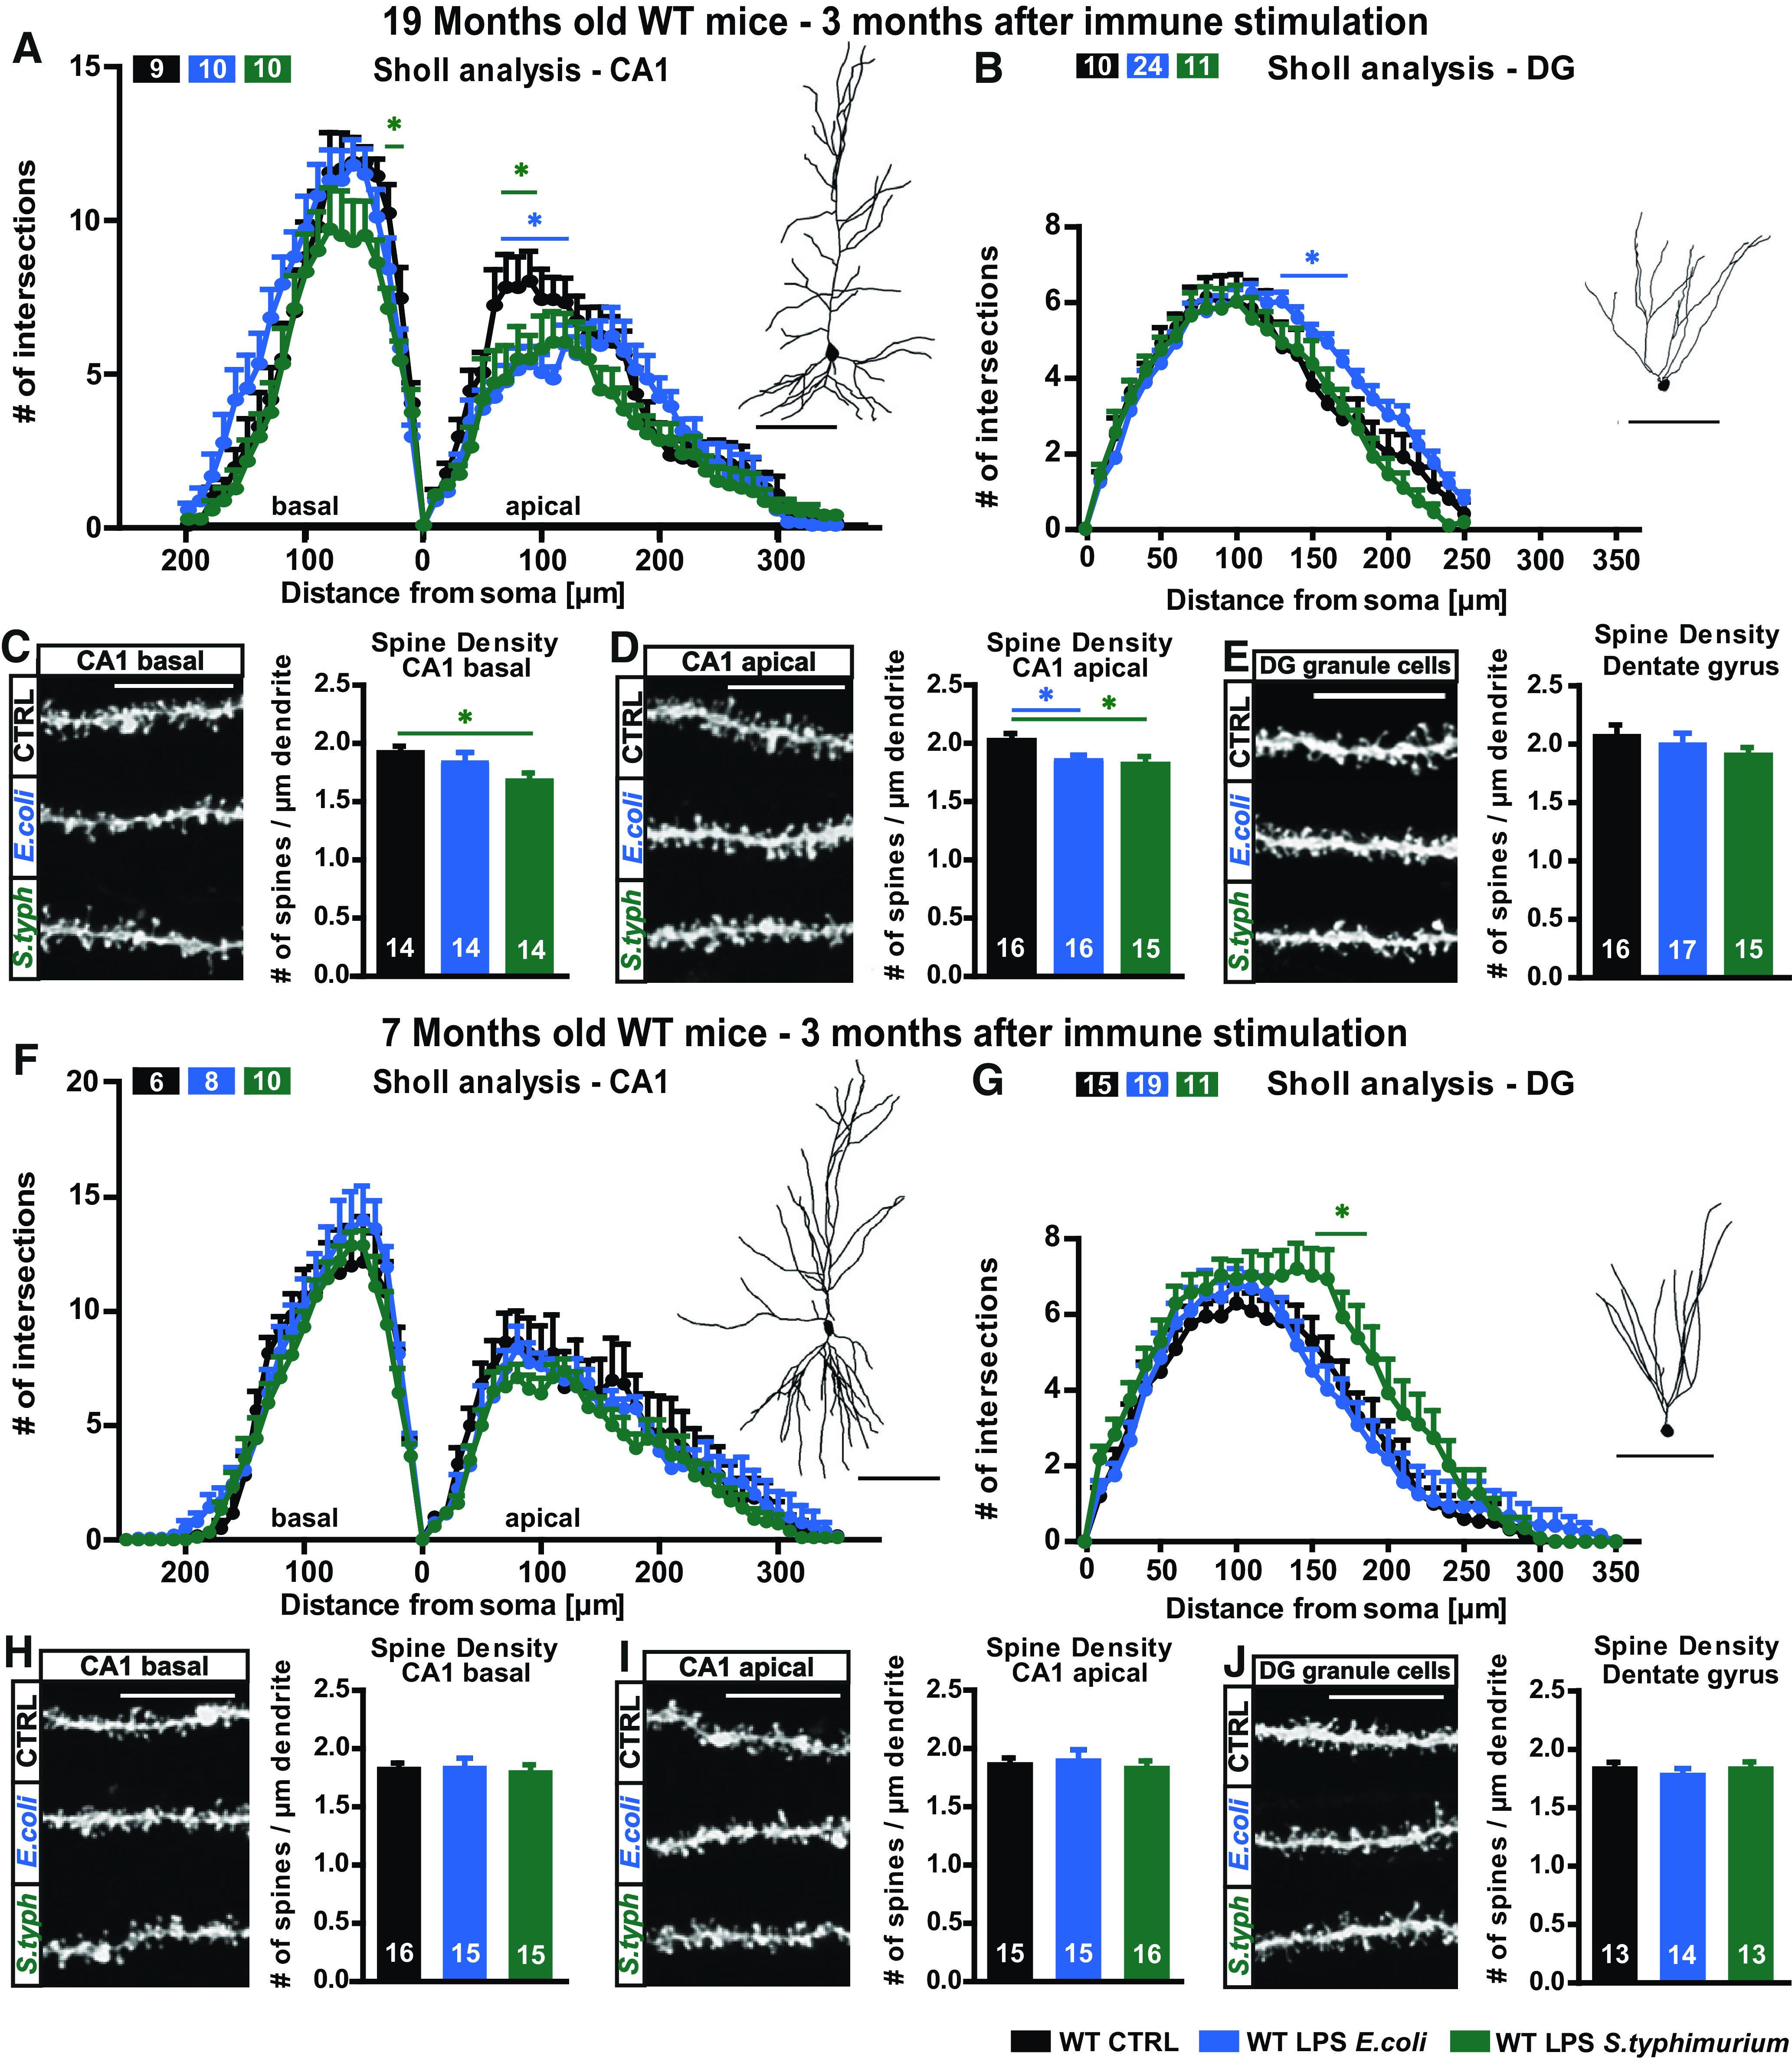
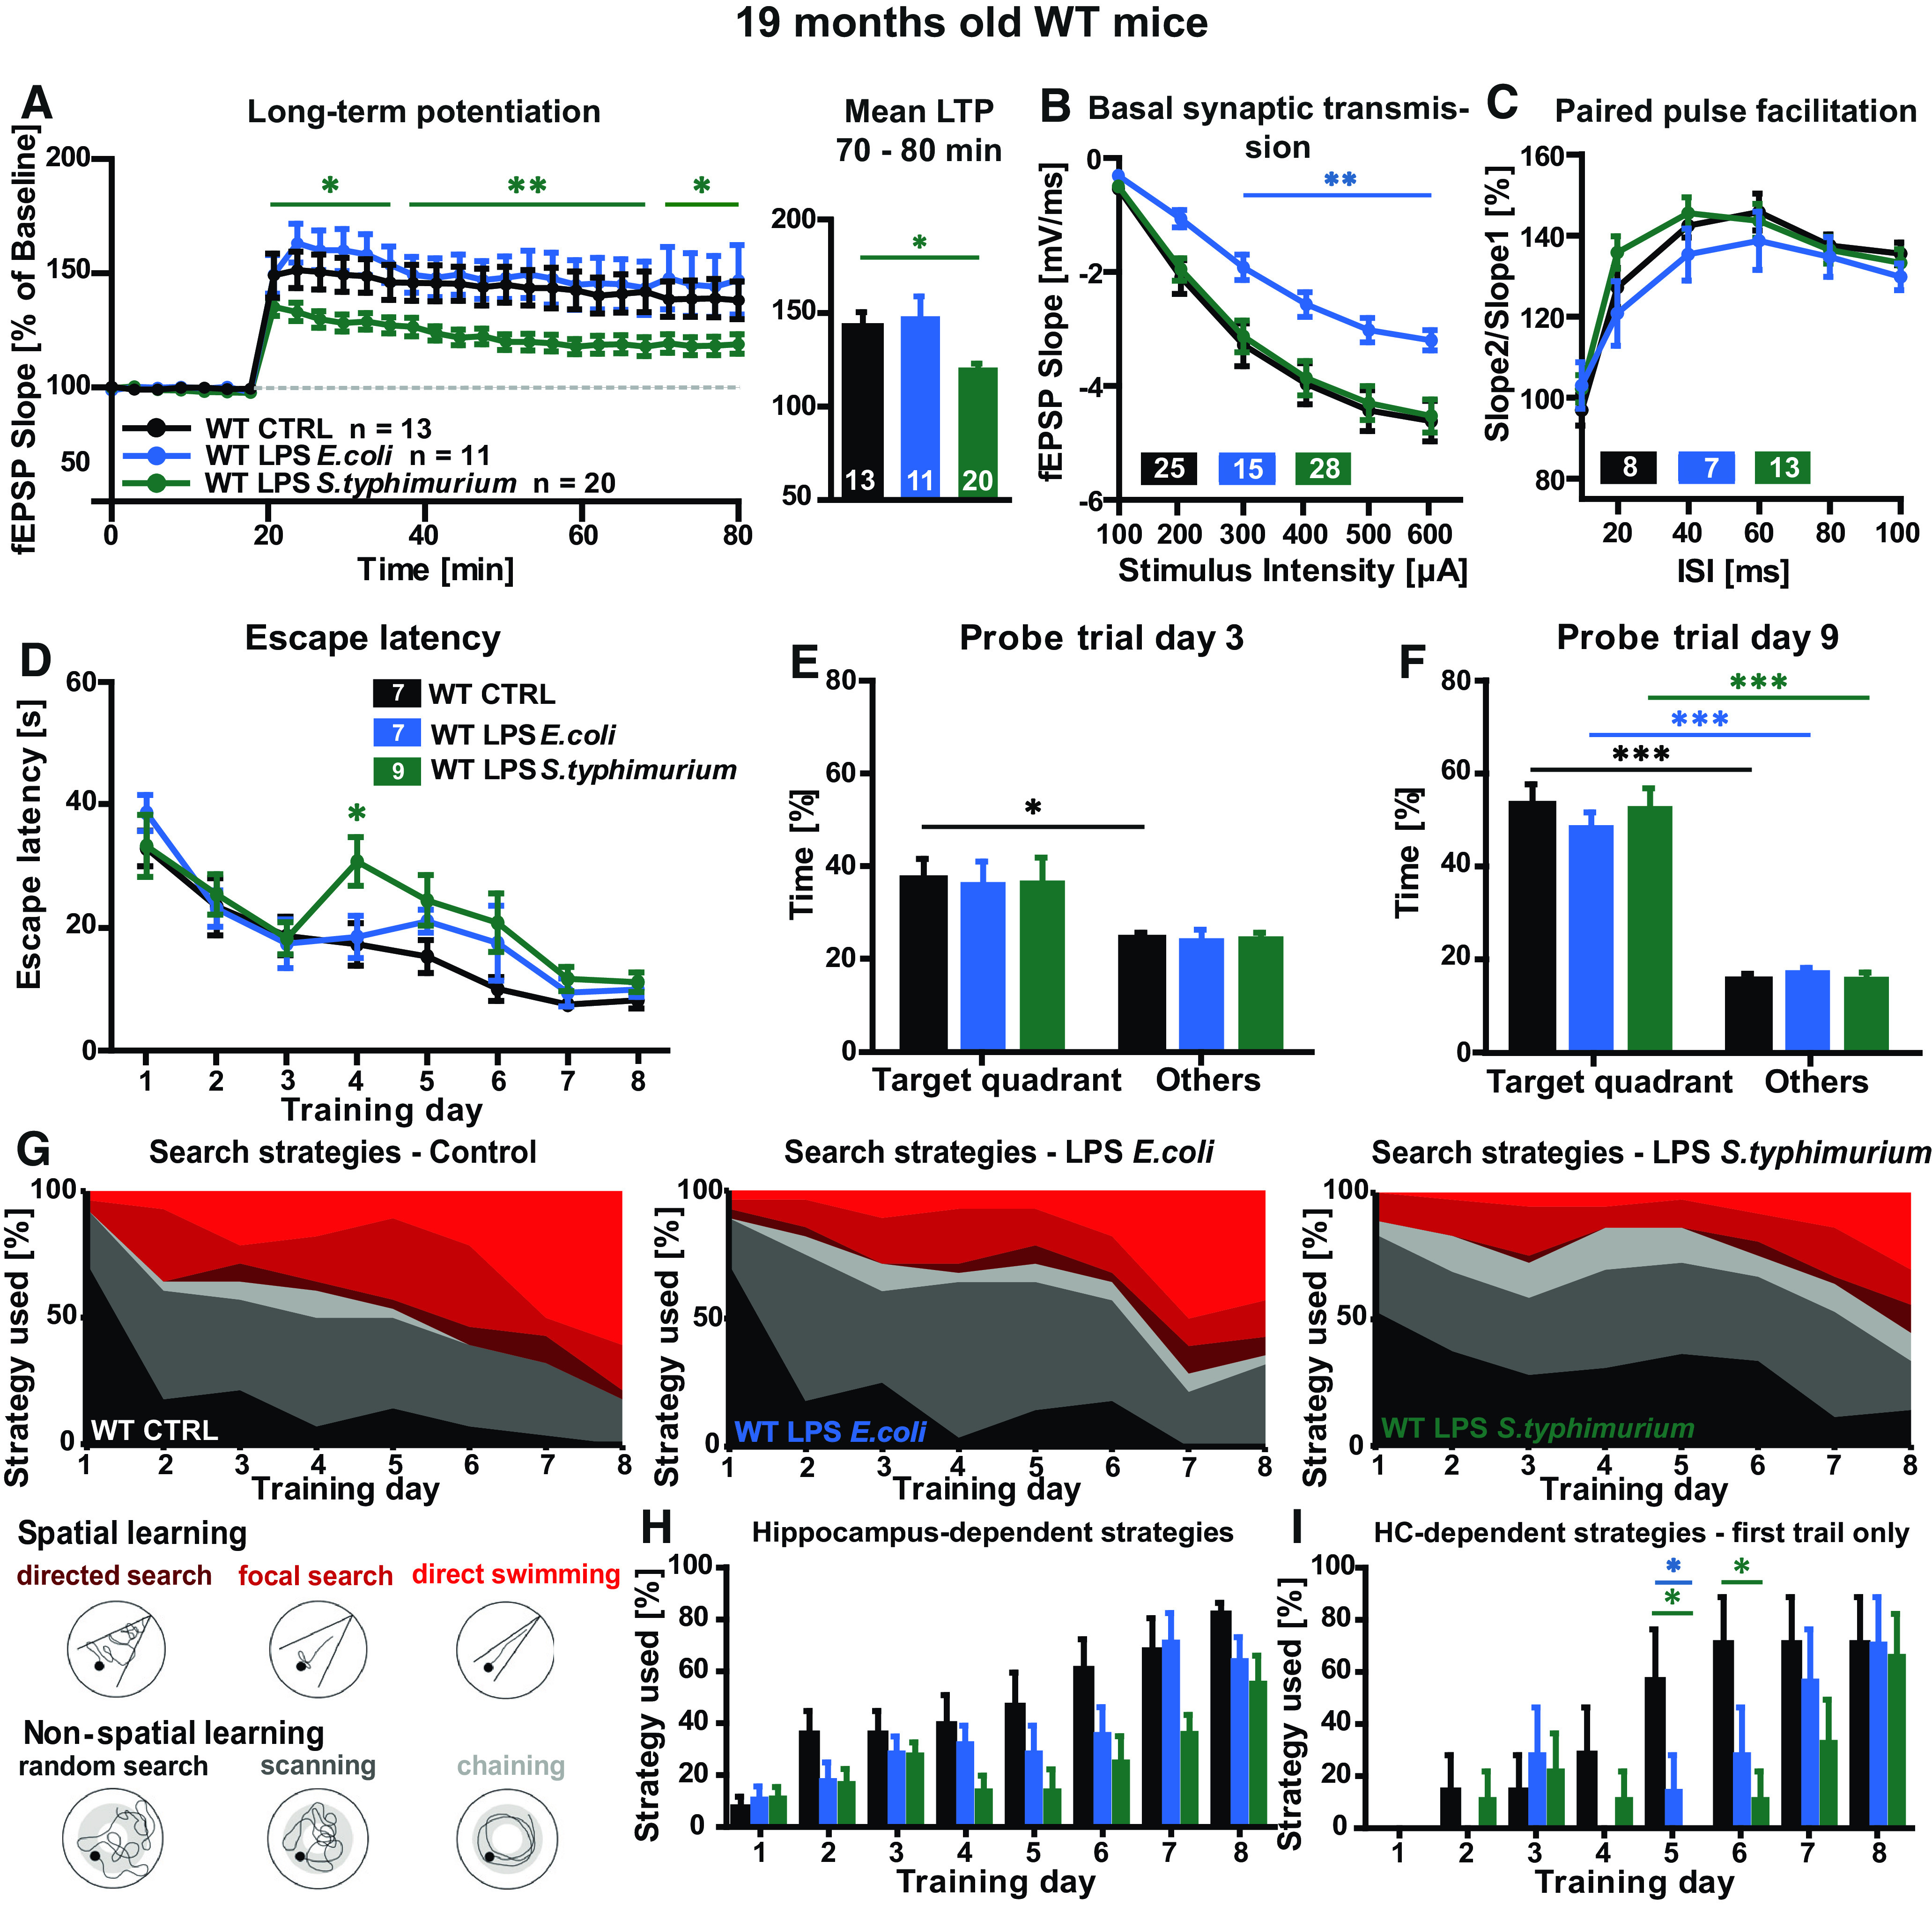
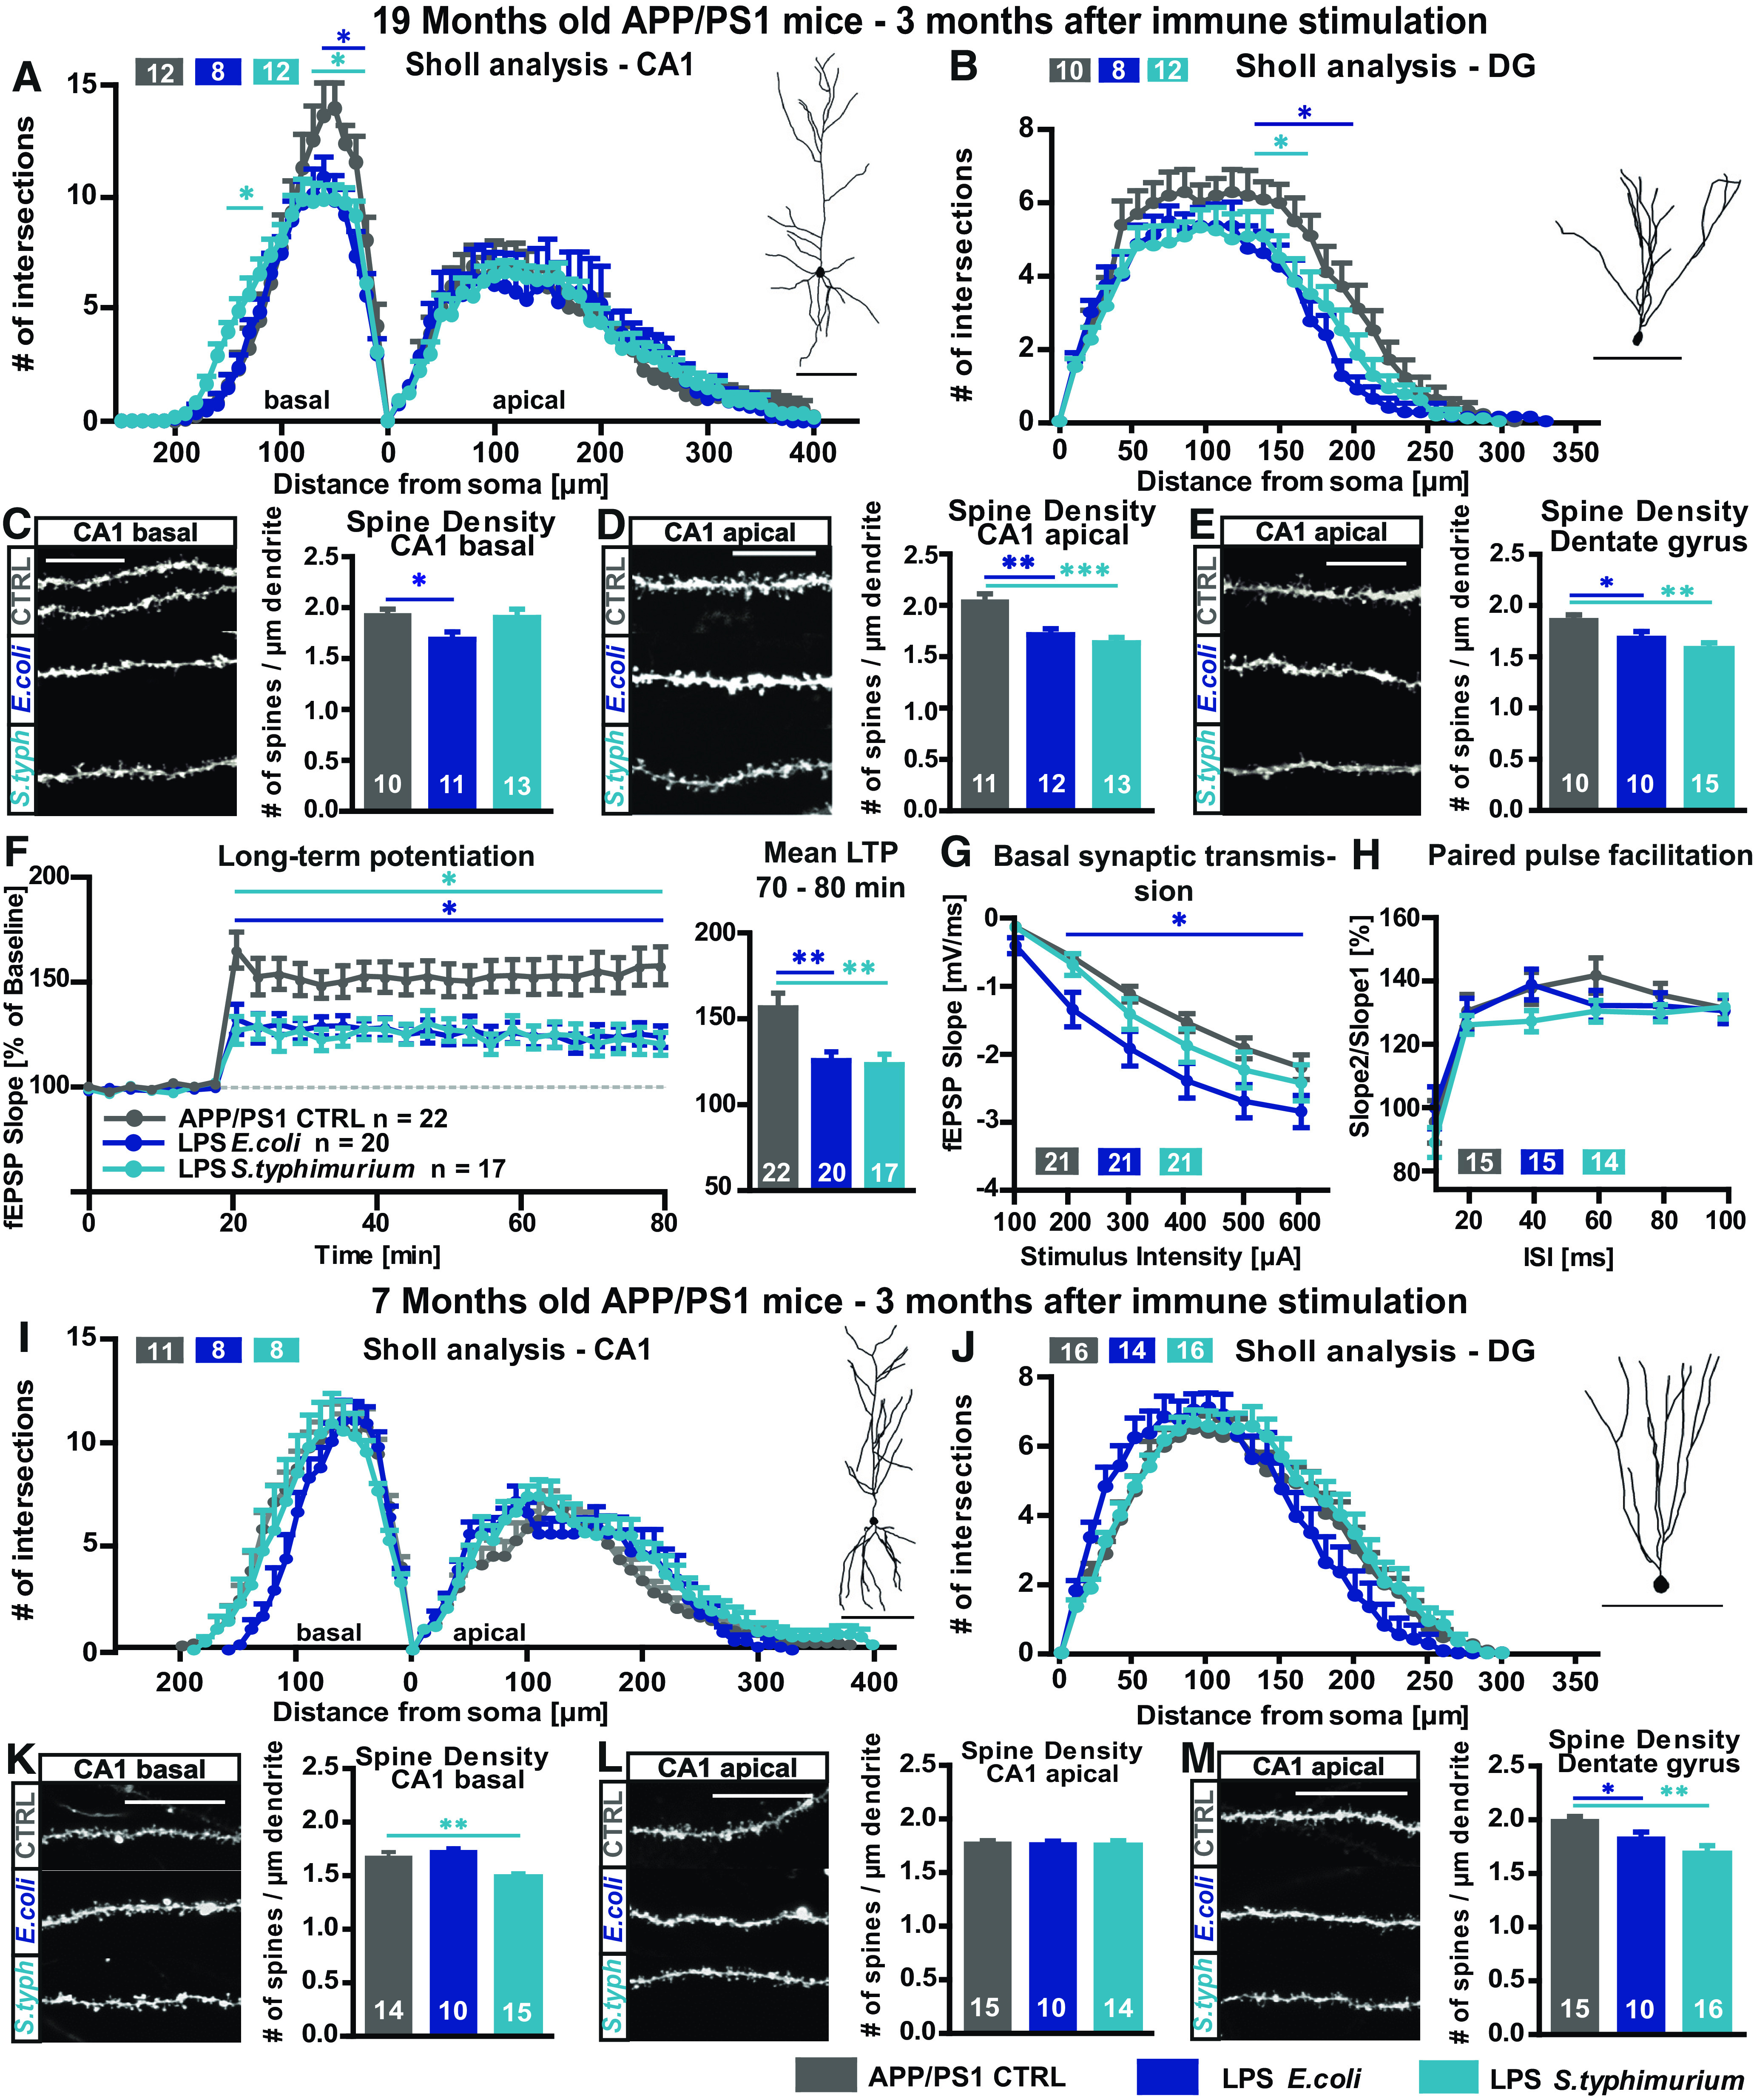
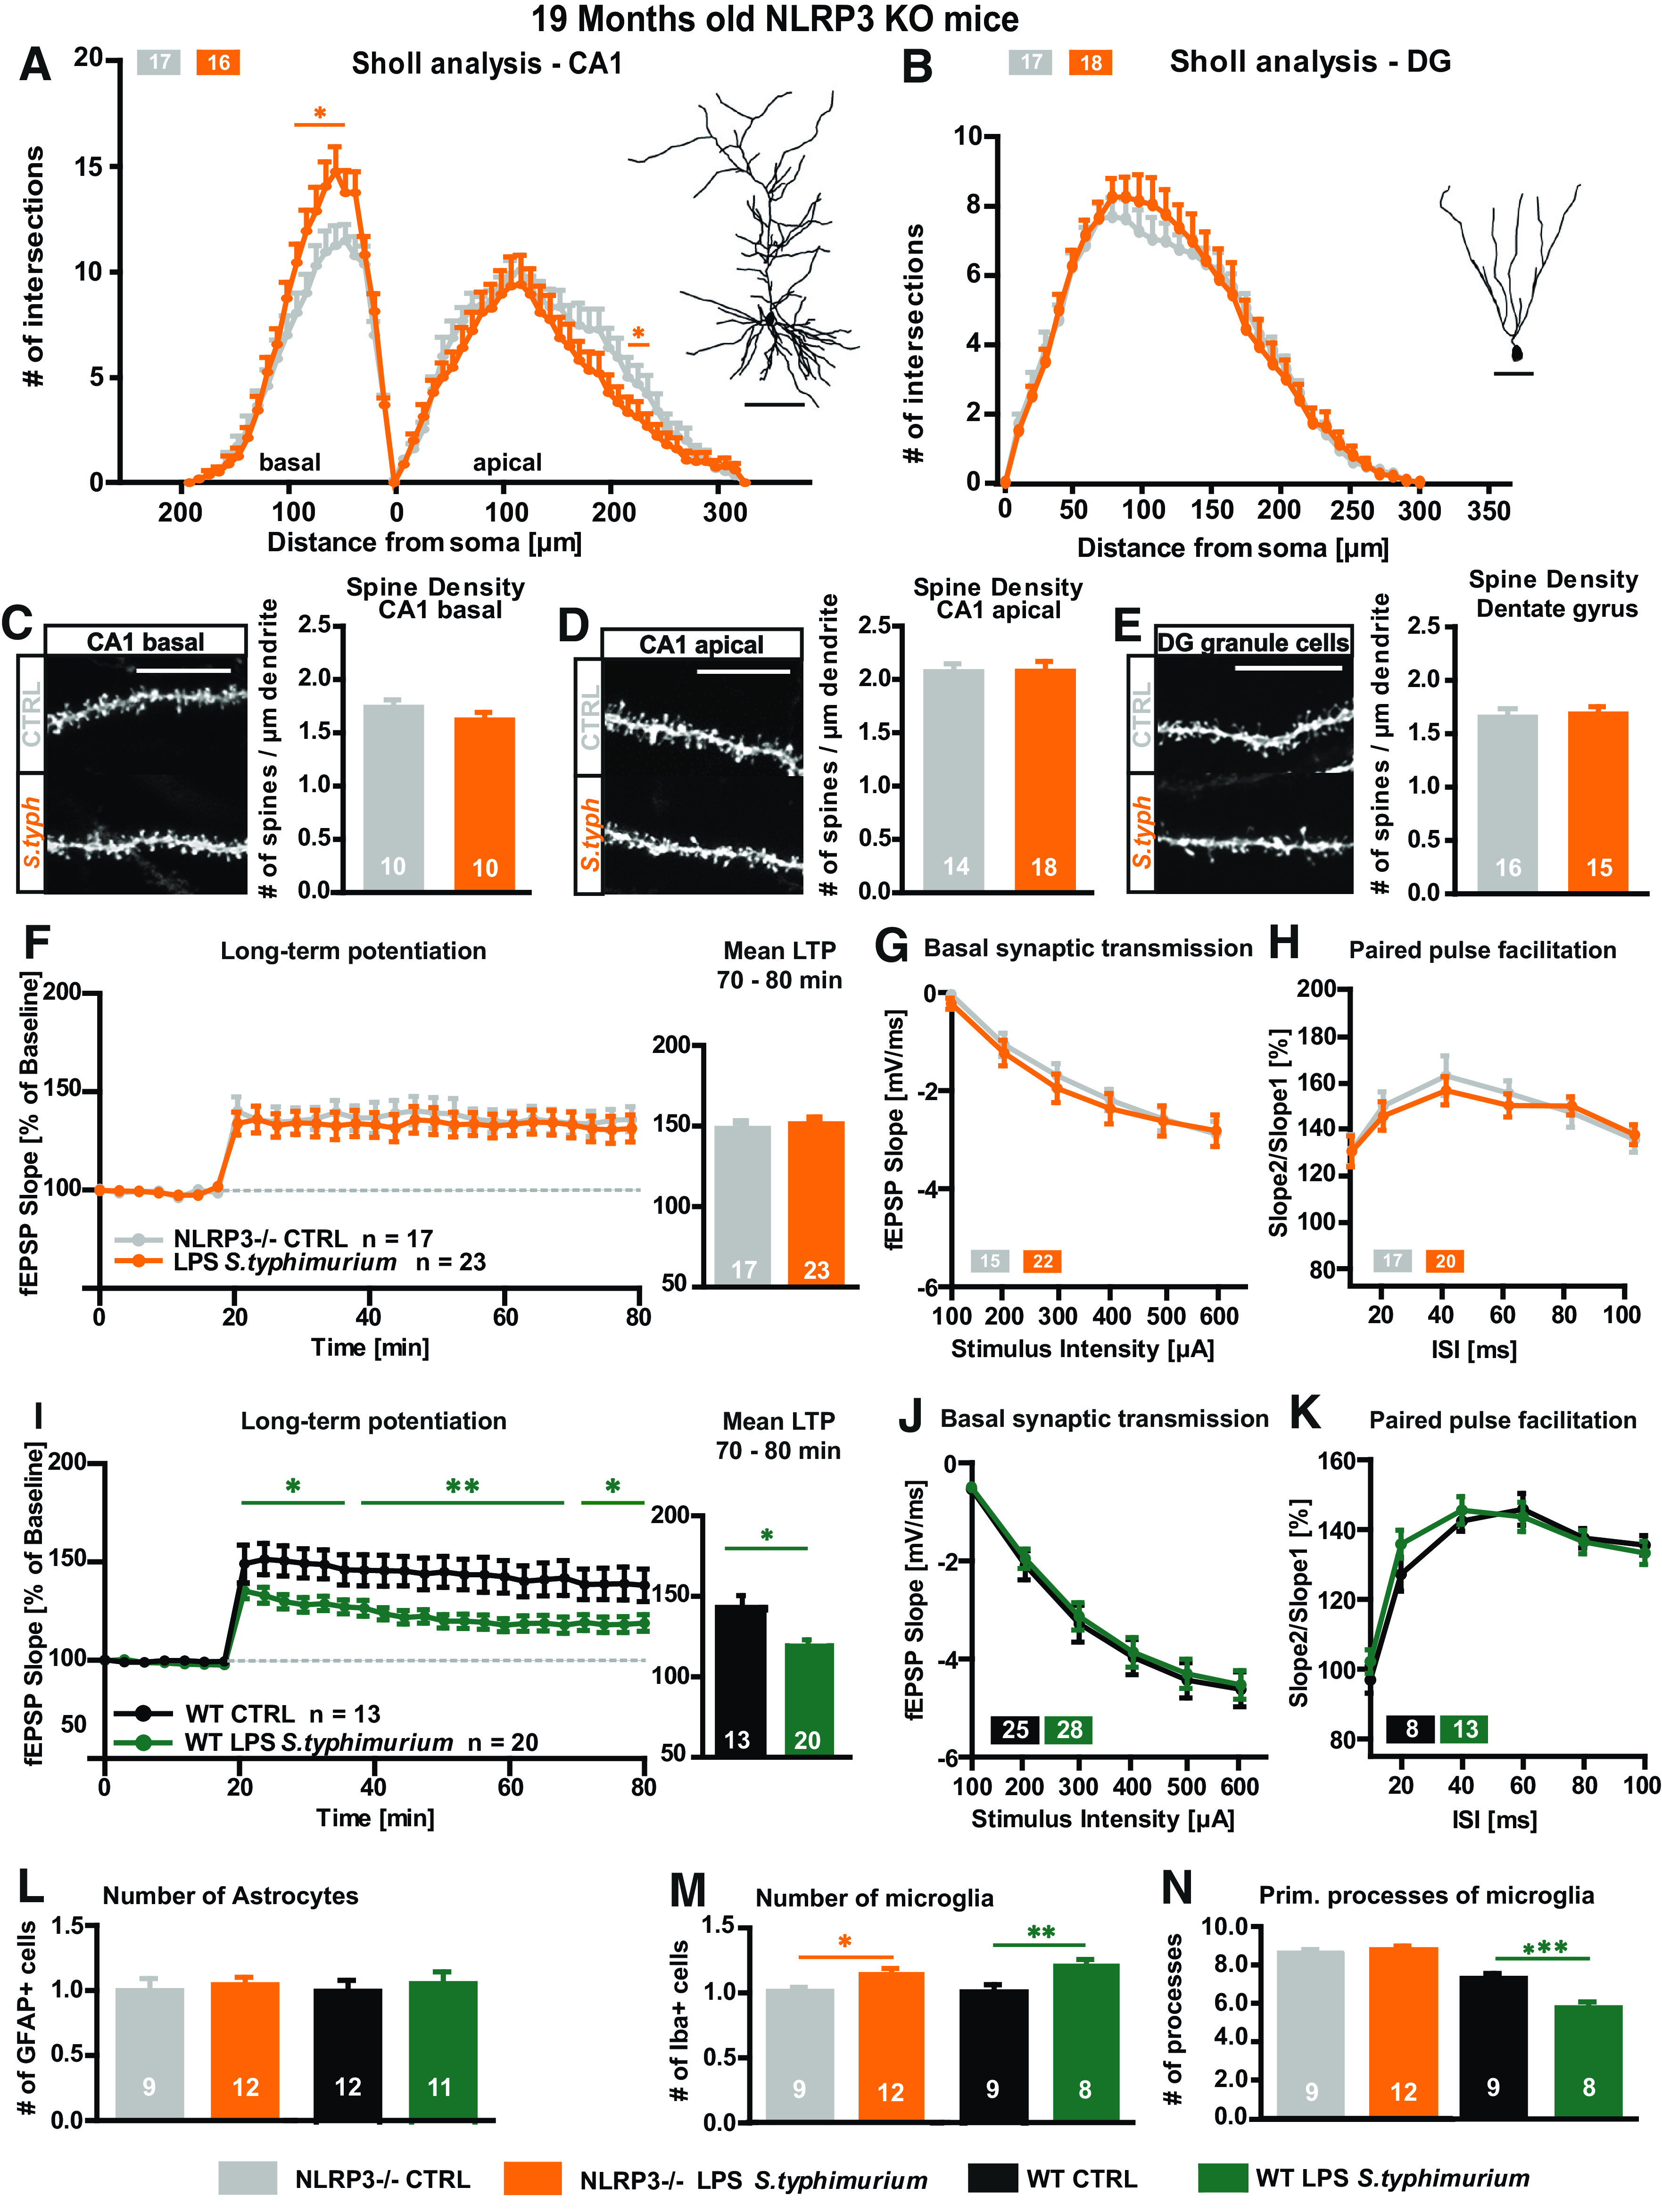
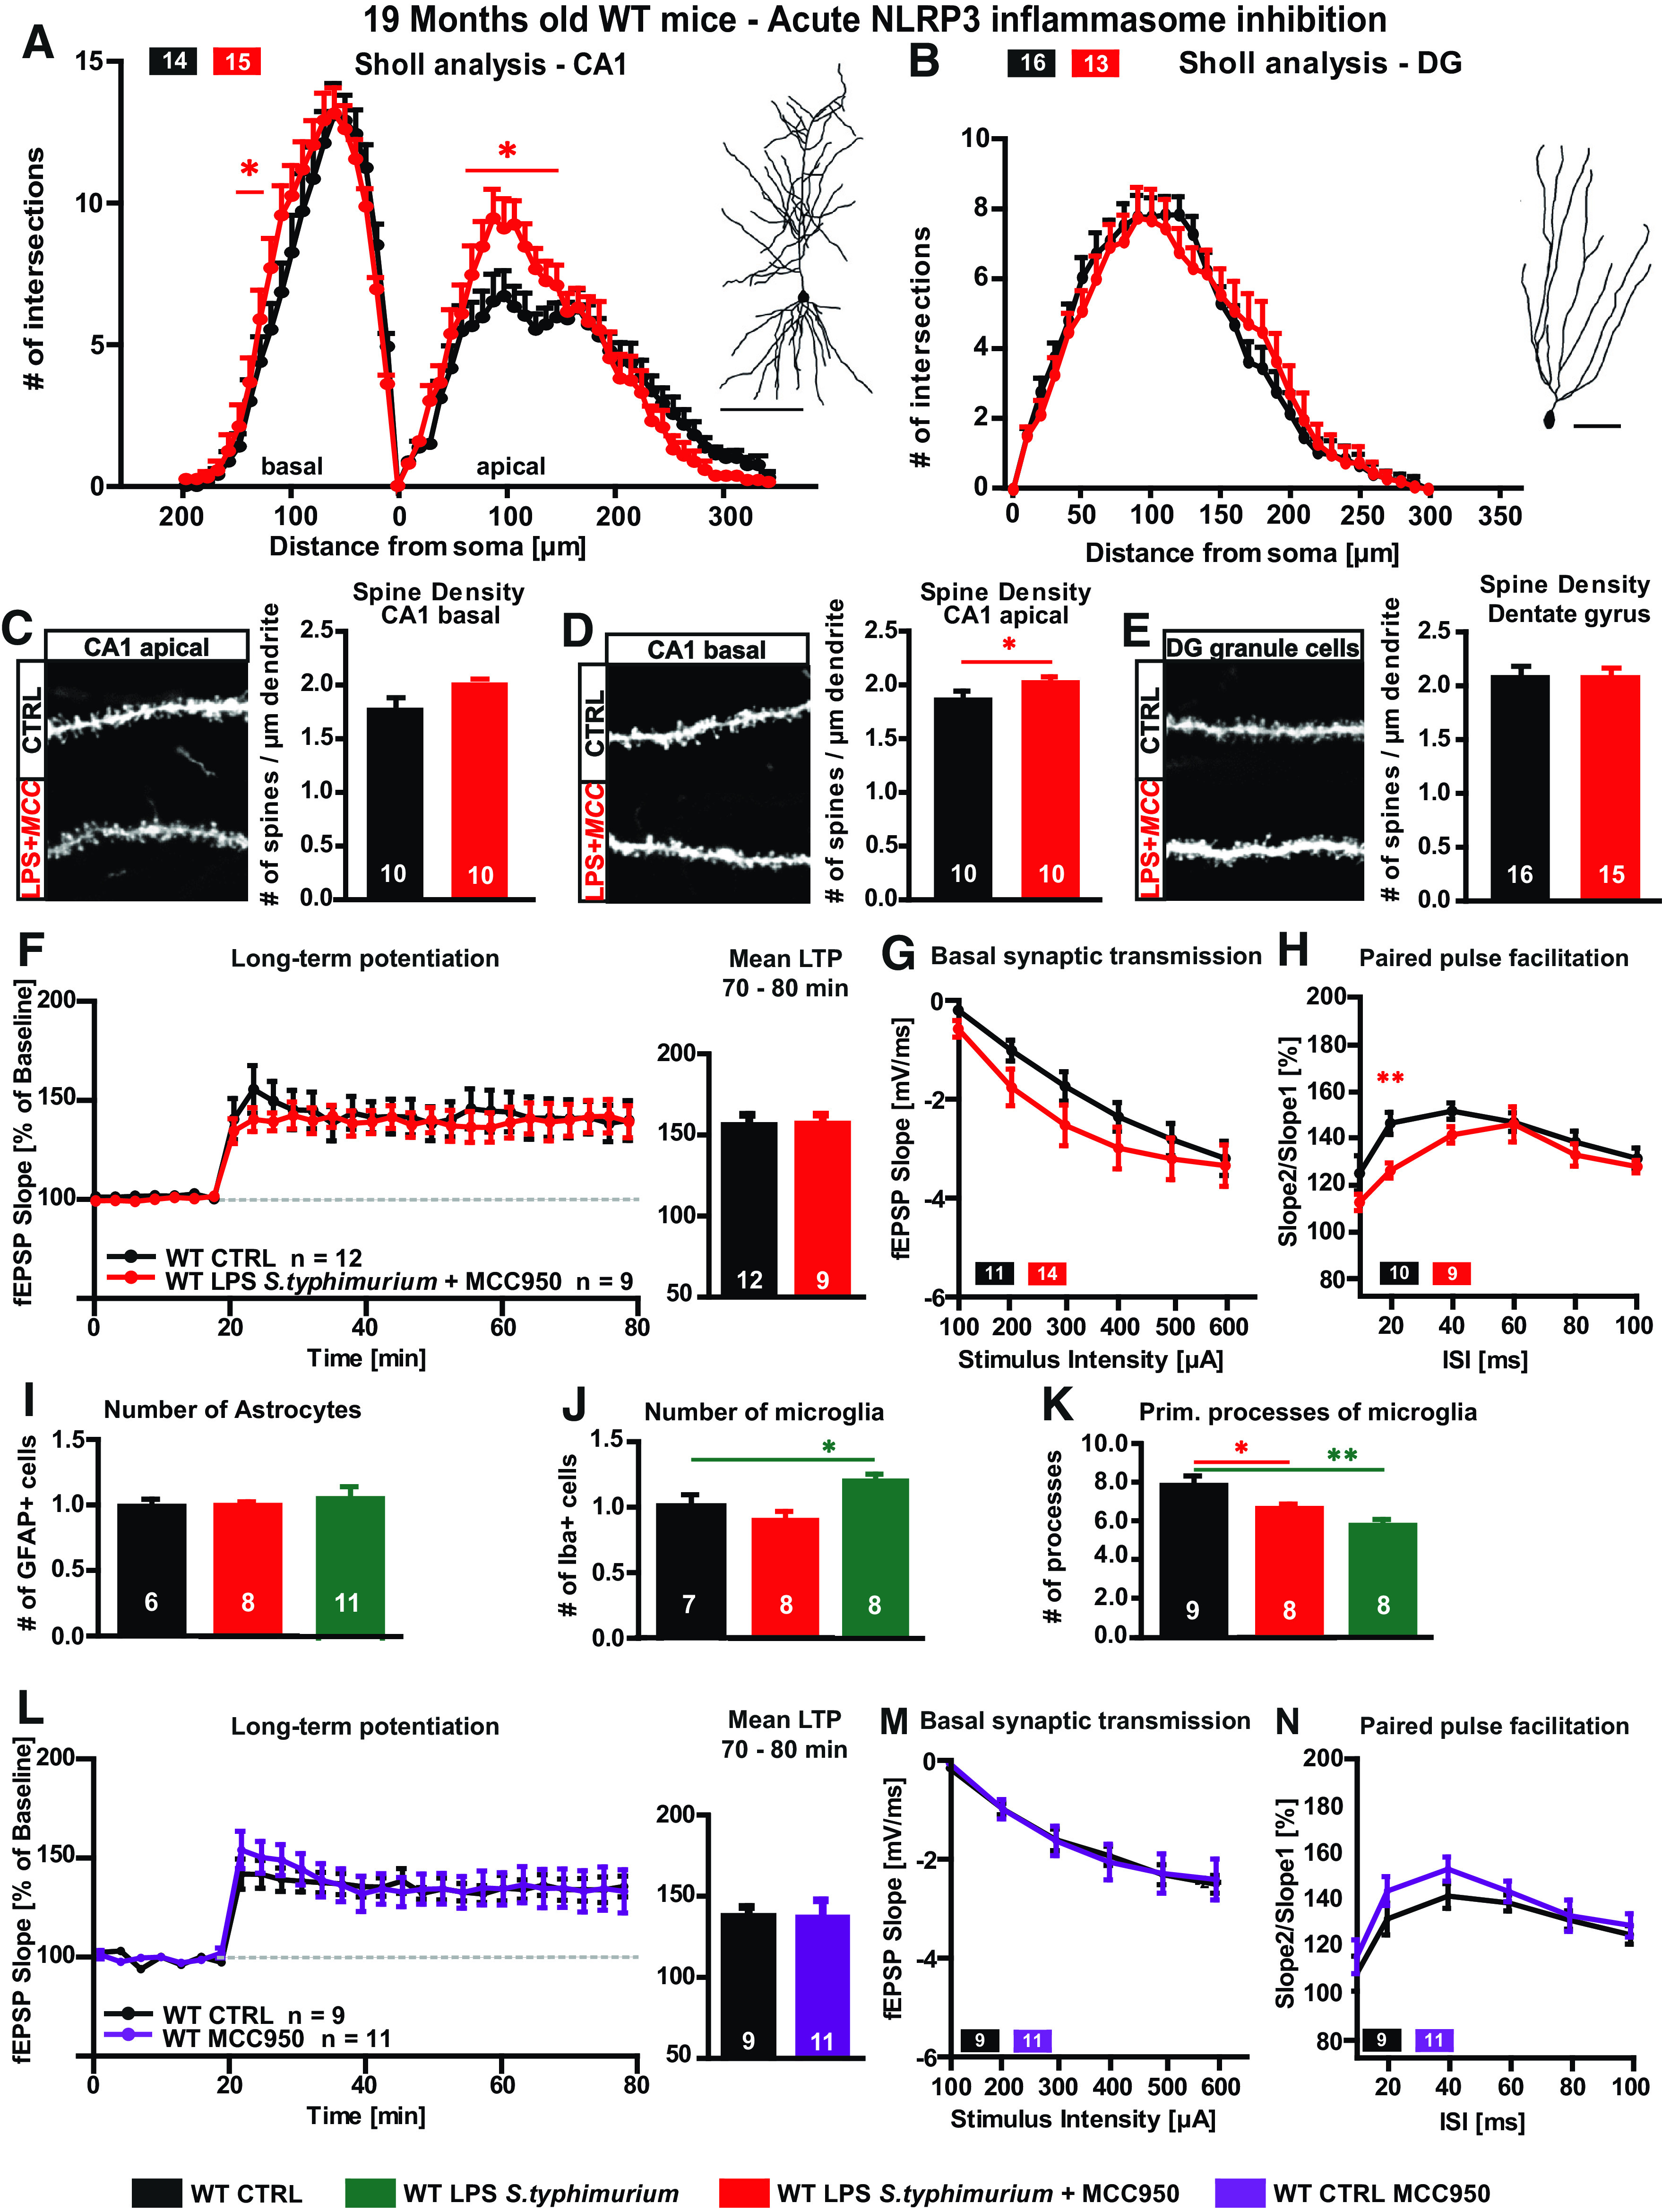
Neuroinflammation can be caused by various insults to the brain and represents an important pathologic hallmark of neurodegenerative diseases including Alzheimer's disease (AD). Infection-triggered acute systemic inflammation is able to induce neuroinflammation and may negatively affect neuronal morphology, synaptic plasticity, and cognitive function. In contrast to acute effects, persisting consequences for the brain on systemic immune stimulation remain largely unexplored. Here, we report an age-dependent vulnerability of wild-type (WT) mice of either sex toward a systemic immune stimulation by Salmonella typhimurium lipopolysaccharide (LPS). Decreased neuronal complexity three months after peripheral immune stimulation is accompanied by impairment in long-term potentiation (LTP) and spatial learning. Aged APP/PS1 mice reveal an increased sensitivity also to LPS of Escherichia coli, which had no effect in WT mice. We further report that these effects are mediated by NOD-like receptor family, pyrin domain containing 3 (NLRP3) inflammasome activation, since the genetic ablation and pharmacological inhibition using the NLRP3 inhibitor MCC950 rescue the morphological and electrophysiological phenotype.SIGNIFICANCE STATEMENT Acute peripheral immune stimulation has been shown to have both positive and negative effects on Aβ deposition. Improvements or worsening may be possible in acute inflammation. However, there is still no evidence of effects longer than a month after stimulation. The data are pointing to an important role of the NOD-like receptor family, pyrin domain containing 3 (NLRP3) inflammasome for mediating the long-term consequences of systemic immune stimulation, which in addition turns out to be age dependent.

Keywords: APP/PS1; LPS; NLRP3; hippocampus; neuroinflammation; sepsis.


Figures

Figure 1.
Figure 1.
Immune response and body weight loss after peripheral immune stimulation with LPS. A, B, Bodyweight loss of aged (A) and adult mice (B) during 2 d of peripheral immune stimulation with 0.4 µg/g body weight LPS of E. coli (blue) or S. typhimurium (green) and the subsequent 13 d of recovery. C, D, Cytokine levels in blood plasma for IL-6 (C) and IL-1β (D) in 13-month-old mice 6 h after intraperitoneal injection of 0.2 µg/g body weight LPS from E. coli and S. typhimurium. E, F, Cytokine levels in brain tissue for IL-6 (E) and IL-1β (F) in 13-month-old mice 6 h after immune stimulation. G, Endotoxin concentration in EU/ml comparing LPS of E. coli and LPS of S. typhimurium. A, B, N = 13 mice per group; C–H, N = 3–4 mice per group; all data are presented as mean ± SEM; *p < 0.05, **p < 0.01.
Figure 2.
Figure 2.
Astrocyte and microglia phenotype of adult and aged WT mice after immune stimulation with 0.4 µg/g bodyweight LPS of E. coli or S. typhimurium. A, Immunohistochemical staining of GFAP (red) and IBA-1 (green) in the CA1 stratum radiatum in overlay with DAPI (blue), scale bar large frame 100 µm, smaller detail 10 µm. B, Relative number of IBA-1-positive cells of control-injected adult (seven months, white bar) and aged mice (16–19 months, black bar), normalized to adult controls. C, Quantification of primary branches of IBA-1-positive cells of control-injected adult and aged mice (seven vs 16–19 months). D, E, J, K, Relative number of IBA-1-positive cells of immune-stimulated mice (LPS E. coli blue, LPS S. typhimurium green) compared with aged controls (black), 24 h (D), and three months (E) after immune stimulation and in adult mice after 24 h (J), three months (K), normalized to respective controls. F, G, L, M, Number of primary branches of IBA-1-positive cells in control and immune-stimulated aged mice, 24 h (F) and three months (G) after immune stimulation and adult mice 24 h (L) and three months (M). H, I, N, O, Quantification of GFAP-positive cells in aged mice, 24 h (H) and three months (I) after immune stimulation, normalized to aged controls and 24 h (N) and three months (O) in adult mice, normalized to the respective adult controls; N = 3 mice per group (n = 8–10), N = 4 or 5 mice in E, G, I (n = 12–15); n = number of samples; all data are presented as mean ± SEM; *p < 0.05, **p < 0.01, ***p < 0.001.
Figure 3.
Figure 3.
Neuronal morphology of adult and aged WT mice three months after immune stimulation with 0.4 µg/g body weight LPS of E. coli or S. typhimurium. A–E, Neuronal architecture of 16- to 19-month-old WT mice, control (black), LPS E. coli (blue), and LPS S. typhimurium (green): tracings and Sholl analysis of (A) CA1 pyramidal neurons and (B) DG granule cells. Confocal microscopic images and spine density analysis from (D) apical CA1 dendrites, (C) basal CA1 dendrites, and (E) granule cells from the DG. F–J, Neuronal architecture of seven-month-old WT mice, control (black), LPS E. coli (blue), and LPS S. typhimurium (green): dendritic complexity and respective tracing of (F) CA1 hippocampal neurons and (G) DG granule cells. Spine density and confocal images of typical dendrites from (I) apical CA1 dendrites, (H) basal CA1 dendrites, and (J) DG granule cells; N = 3 (A, n = 9–10; B, n = 10–24; C, n = 14; D, n = 15–16; E, n = 15–17; F, n = 6–14; G, n = 11–19; H–J, n = 13–16); n = number of samples, scale bar of tracings, 100 µm; scale bar of confocal fluorescent images, 10 µm; all data are presented as mean ± SEM, *p < 0.05.
Figure 4.
Figure 4.
Synaptic plasticity and spatial learning in immune-stimulated aged WT mice. A–C, Short-term and long-term synaptic plasticity at the CA3-CA1 pathway in hippocampal acute slices of aged WT mice three months after peripheral immune stimulation, controls (black), LPS E. coli (0.4 µg/g bodyweight, blue), and LPS S. typhimurium (0.4 µg/g bodyweight, green): (A) LTP induced via TBS after 20 min of baseline recordings and mean LTP fEPSP slope in % for 70–80 min of recording. B, Input-output curve. C, PPF with increasing ISIs; N = 3–4 mice per group, n = 7–28; *p < 0.05, **p < 0.01. D–I, Nineteen-month-old WT were challenged in the Morris water maze navigation task, controls (black), LPS E. coli (blue), and LPS S. typhimurium (green): (D) escape latency, mean values of four trials per mouse per day. E, F, Target quadrant preference in comparison to time spent in other quadrants during memory reference tests (probe trials) on training day 3 (E) and day 9 (F). G, Illustration and quantification of the six different search strategies random search, scanning, chaining, directed search, focal search, and direct swimming as mean of four trials per mouse per day. H, Quantification of the hippocampus-dependent search strategies for every single training day, mean value of four trials per mouse and day. I, Quantification of the hippocampus-dependent search strategies for every single training day during the first trial; N = 7–9, all data shown as mean ± SEM; *p < 0.05, ***p < 0.001; n = number of mice.
Figure 5.
Figure 5.
Long-term effects of LPS on neuronal morphology and synaptic plasticity in adult and aged APP/PS1 mice. A–E, Neuronal architecture of 19-month-old APP/PS1 mice, CTRL (gray), LPS E. coli (0.4 µg/g bodyweight, dark blue), and LPS S. typhimurium (0.4 µg/g bodyweight, light blue): Sholl analysis and typical tracing of (A) CA1 pyramidal neurons and (B) granule cells of the DG. Number of spines per µm and confocal microscopic image of DiI-stained (C) basal CA1 dendrites, (D) mid-apical CA1 dendrites, and (E) DG granule cells; N = 3, n = 8–15. F–H, Changes in short-term and long-term synaptic plasticity in the hippocampus of 19-month-old APP/PS1 mice three months after peripheral immune stimulation: (F) LTP at Schaffer collateral pathway measured at stimulus intensity of 40% maximal fEPSP slope, LTP induction after 20 min of baseline recording via TBS, mean LTP as fEPSP slope % of baseline of the last 10 min of recording (minutes 70–80). G, Input-out-relationship, fEPSP slope measured at increasing stimulus intensities. H, PPF at 40% of the maximal fEPSP slope; n = number of hippocampal acute slices; N = 3–6, n = 11–22. I–M, Neuronal morphology of seven-month-old APP/PS1 mice, CTRL (gray), LPS E. coli (dark blue), and LPS S. typhimurium (light blue): Sholl analysis and tracing of (I) CA1 pyramidal neurons and (J) granule cells of the DG. Spine density and representative confocal microscopic images of (K) basal CA1 dendrites, (L) mid-apical CA1 dendrites, and (M) of DG granule cells. Tracing scale bars, 100 µm; scale bar for confocal microscopic images, 10 µm; n = number of cells; N = 3, n = 10–15 all data are presented as mean ± SEM, *p < 0.05, **p < 0.01; ***p < 0.001.
Figure 6.
Figure 6.
Neuronal morphology and synaptic plasticity of aged NLRP3 KO mice after immune stimulation with S. typhimurium LPS. A–E, Neuronal architecture of 19-month-old NLRP3 KO mice; CTRL (gray), LPS S. typhimurium (orange): tracings and Sholl analysis of (A) CA1 pyramidal neurons and (B) DG granule cells. Spine density and exemplified confocal microscopic images from (D) mid-apical CA1 dendrites, (C) CA1 basal dendrites, and (E) of granule cells from the DG. F–H, Short-term and long-term synaptic plasticity at the CA3-CA1 pathway in hippocampal acute slices of aged NLRP3 KO mice three months after peripheral immune stimulation: (F) LTP induced via TBS shown as fEPSP slope % of baseline and mean LTP as fEPSP slope % of baseline for minutes 70–80 of recording. G, Input-output curve. H, PPF with increasing ISIs. I–K, Short-term and long-term synaptic plasticity at the CA3-CA1 pathway in hippocampal acute slices of aged WT mice three months after peripheral immune stimulation: (I) LTP induced via TBS shown as fEPSP slope % of baseline and mean LTP as fEPSP slope % of baseline for minutes 70–80 of recording. J, Input-output curve. K, PPF with increasing ISIs. L–N, Astrocyte and microglia phenotype in the stratum radiatum of the CA1 area of aged NLRP3 KO mice three months after peripheral immune stimulation: (L) quantification of GFAP-positive cells in aged NLRP3 KO mice (CTLR gray, LPS S. typhimurium orange) and WT mice (CTRL black, LPS S. typhimurium green). M, Relative number of IBA-1-positive cells of immune-stimulated mice compared with the respective aged controls, NLRP3 KO mice (gray, orange), WT mice (black, green) and the change between both immune-stimulated groups in %. N, Number of primary branches of IBA-1-positive cells in control (gray) and immune-stimulated aged NLRP3 KO mice (orange) and immune-stimulated WT mice with (black, green) and comparison between the immune-stimulated groups as fold change, respectively; N = 3–4 mice per group, n = 9–23 number of samples; scale bar of tracings, 100 µm; scale bar of confocal fluorescent images, 10 µm; all data are presented as mean ± SEM; *p < 0.05, **p < 0.01; ***p < 0.001.
Figure 7.
Figure 7.
Neuronal morphology and synaptic plasticity of aged LPS immune-stimulated WT mice after MCC950 treatment A–E, Neuronal architecture of 19-month-old WT mice, CTRL (black) versus LPS S. typhimurium treated with MCC950 (20 µg/g bodyweight, red): dendritic complexity and exemplified tracing of (A) CA1 hippocampal neurons and (B) DG granule cells. Confocal microscopic image and spine density of (C) basal CA1 dendrites, (D) mid-apical CA1 dendrites, and (E) DG granule cells. F–H, Synaptic plasticity of aged WT mice, CTRL versus LPS S. typhimurium treated with MCC950: (F) LTP as fEPSP slope % of baseline and quantification of 70–80 min of LTP measurement. G, Input-out properties. H, Short-term synaptic plasticity, PPF. I–K, Astrocyte and microglia phenotype in the stratum radiatum of the CA1 area of aged MCC950-treated WT mice three months after peripheral immune stimulation: (I) relative number of GFAP-positive cells: CTRL versus LPS S. typhimurium with MCC950 treatment (red) and CTRL (black) versus LPS S. typhimurium (green). J, Quantification of IBA-1-positive cells in WT mice, CTRL (black) versus LPS S. typhimurium with (red), or without MCC950 treatment (green), differences between both immune-stimulated groups as fold change in %. K, Number of primary branches of IBA-1-positive cells in controls (black) and immune-stimulated WT mice with (red) or without MCC950 (green) and comparison between the immune-stimulated groups as fold change, respectively. L–N, Synaptic plasticity of aged WT mice, CTRL versus CTRL treated with MCC950: (L) LTP as fEPSP slope % of baseline and quantification of 70–80 min of LTP measurement. M, Input-out properties. N, Short-term synaptic plasticity, PPF; N = 3 mice per group, n = 7–15 number of samples; scale bar of tracings, 100 µm; scale bar of confocal fluorescent images, 10 µm; all data are presented as mean ± SEM; *p < 0.05, **p < 0.01.

References

    1. Angus DC, Linde-Zwirble WT, Lidicker J, Clermont G, Carcillo J, Pinsky MR (2001) Epidemiology of severe sepsis in the United States: analysis of incidence, outcome, and associated costs of care. Crit Care Med 29:1303–1310. 10.1097/00003246-200107000-00002 - DOI - PubMed
    1. Arai K, Matsuki N, Ikegaya Y, Nishiyama N (2001) Deterioration of spatial learning performances in lipopolysaccharide-treated mice. Jpn J Pharmacol 87:195–201. 10.1254/jjp.87.195 - DOI - PubMed
    1. Biesmans S, Meert TF, Bouwknecht JA, Acton PD, Davoodi N, De Haes P, Kuijlaars J, Langlois X, Matthews LJR, Ver Donck L, Hellings N, Nuydens R (2013) Systemic immune activation leads to neuroinflammation and sickness behavior in mice. Mediators Inflamm 2013:271359. 10.1155/2013/271359 - DOI - PMC - PubMed
    1. Bone RC. (1992) Toward an epidemiology and natural history of SIRS (systemic inflammatory response syndrome). JAMA 268:3452–3455. - PubMed
    1. Borchelt DR, Ratovitski T, Van Lare J, Lee MK, Gonzales V, Jenkins NA, Copeland NG, Price DL, Sisodia SS (1997) Accelerated amyloid deposition in the brains of transgenic mice coexpressing mutant presenilin 1 and amyloid precursor proteins. Neuron 19:939–945. 10.1016/S0896-6273(00)80974-5 - DOI - PubMed

Publication types

MeSH terms

Substances

LinkOut - more resources