

GFR in Healthy Aging: an Individual Participant Data Meta-Analysis of Iohexol Clearance in European Population-Based Cohorts
- PMID: 32499396
- PMCID: PMC7350990
- DOI: 10.1681/ASN.2020020151
GFR in Healthy Aging: an Individual Participant Data Meta-Analysis of Iohexol Clearance in European Population-Based Cohorts
Abstract
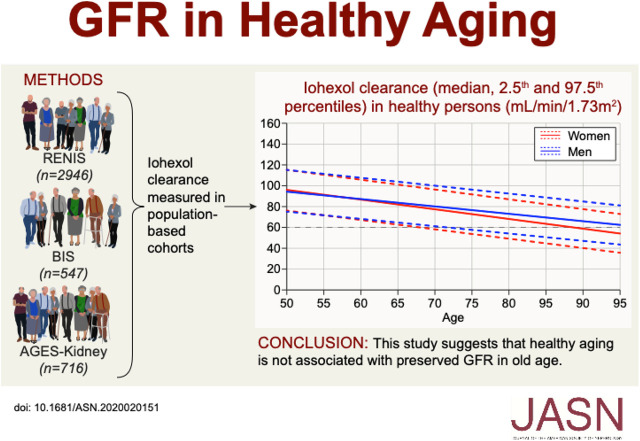
Background: Population mean GFR is lower in older age, but it is unknown whether healthy aging is associated with preserved rather than lower GFR in some individuals.
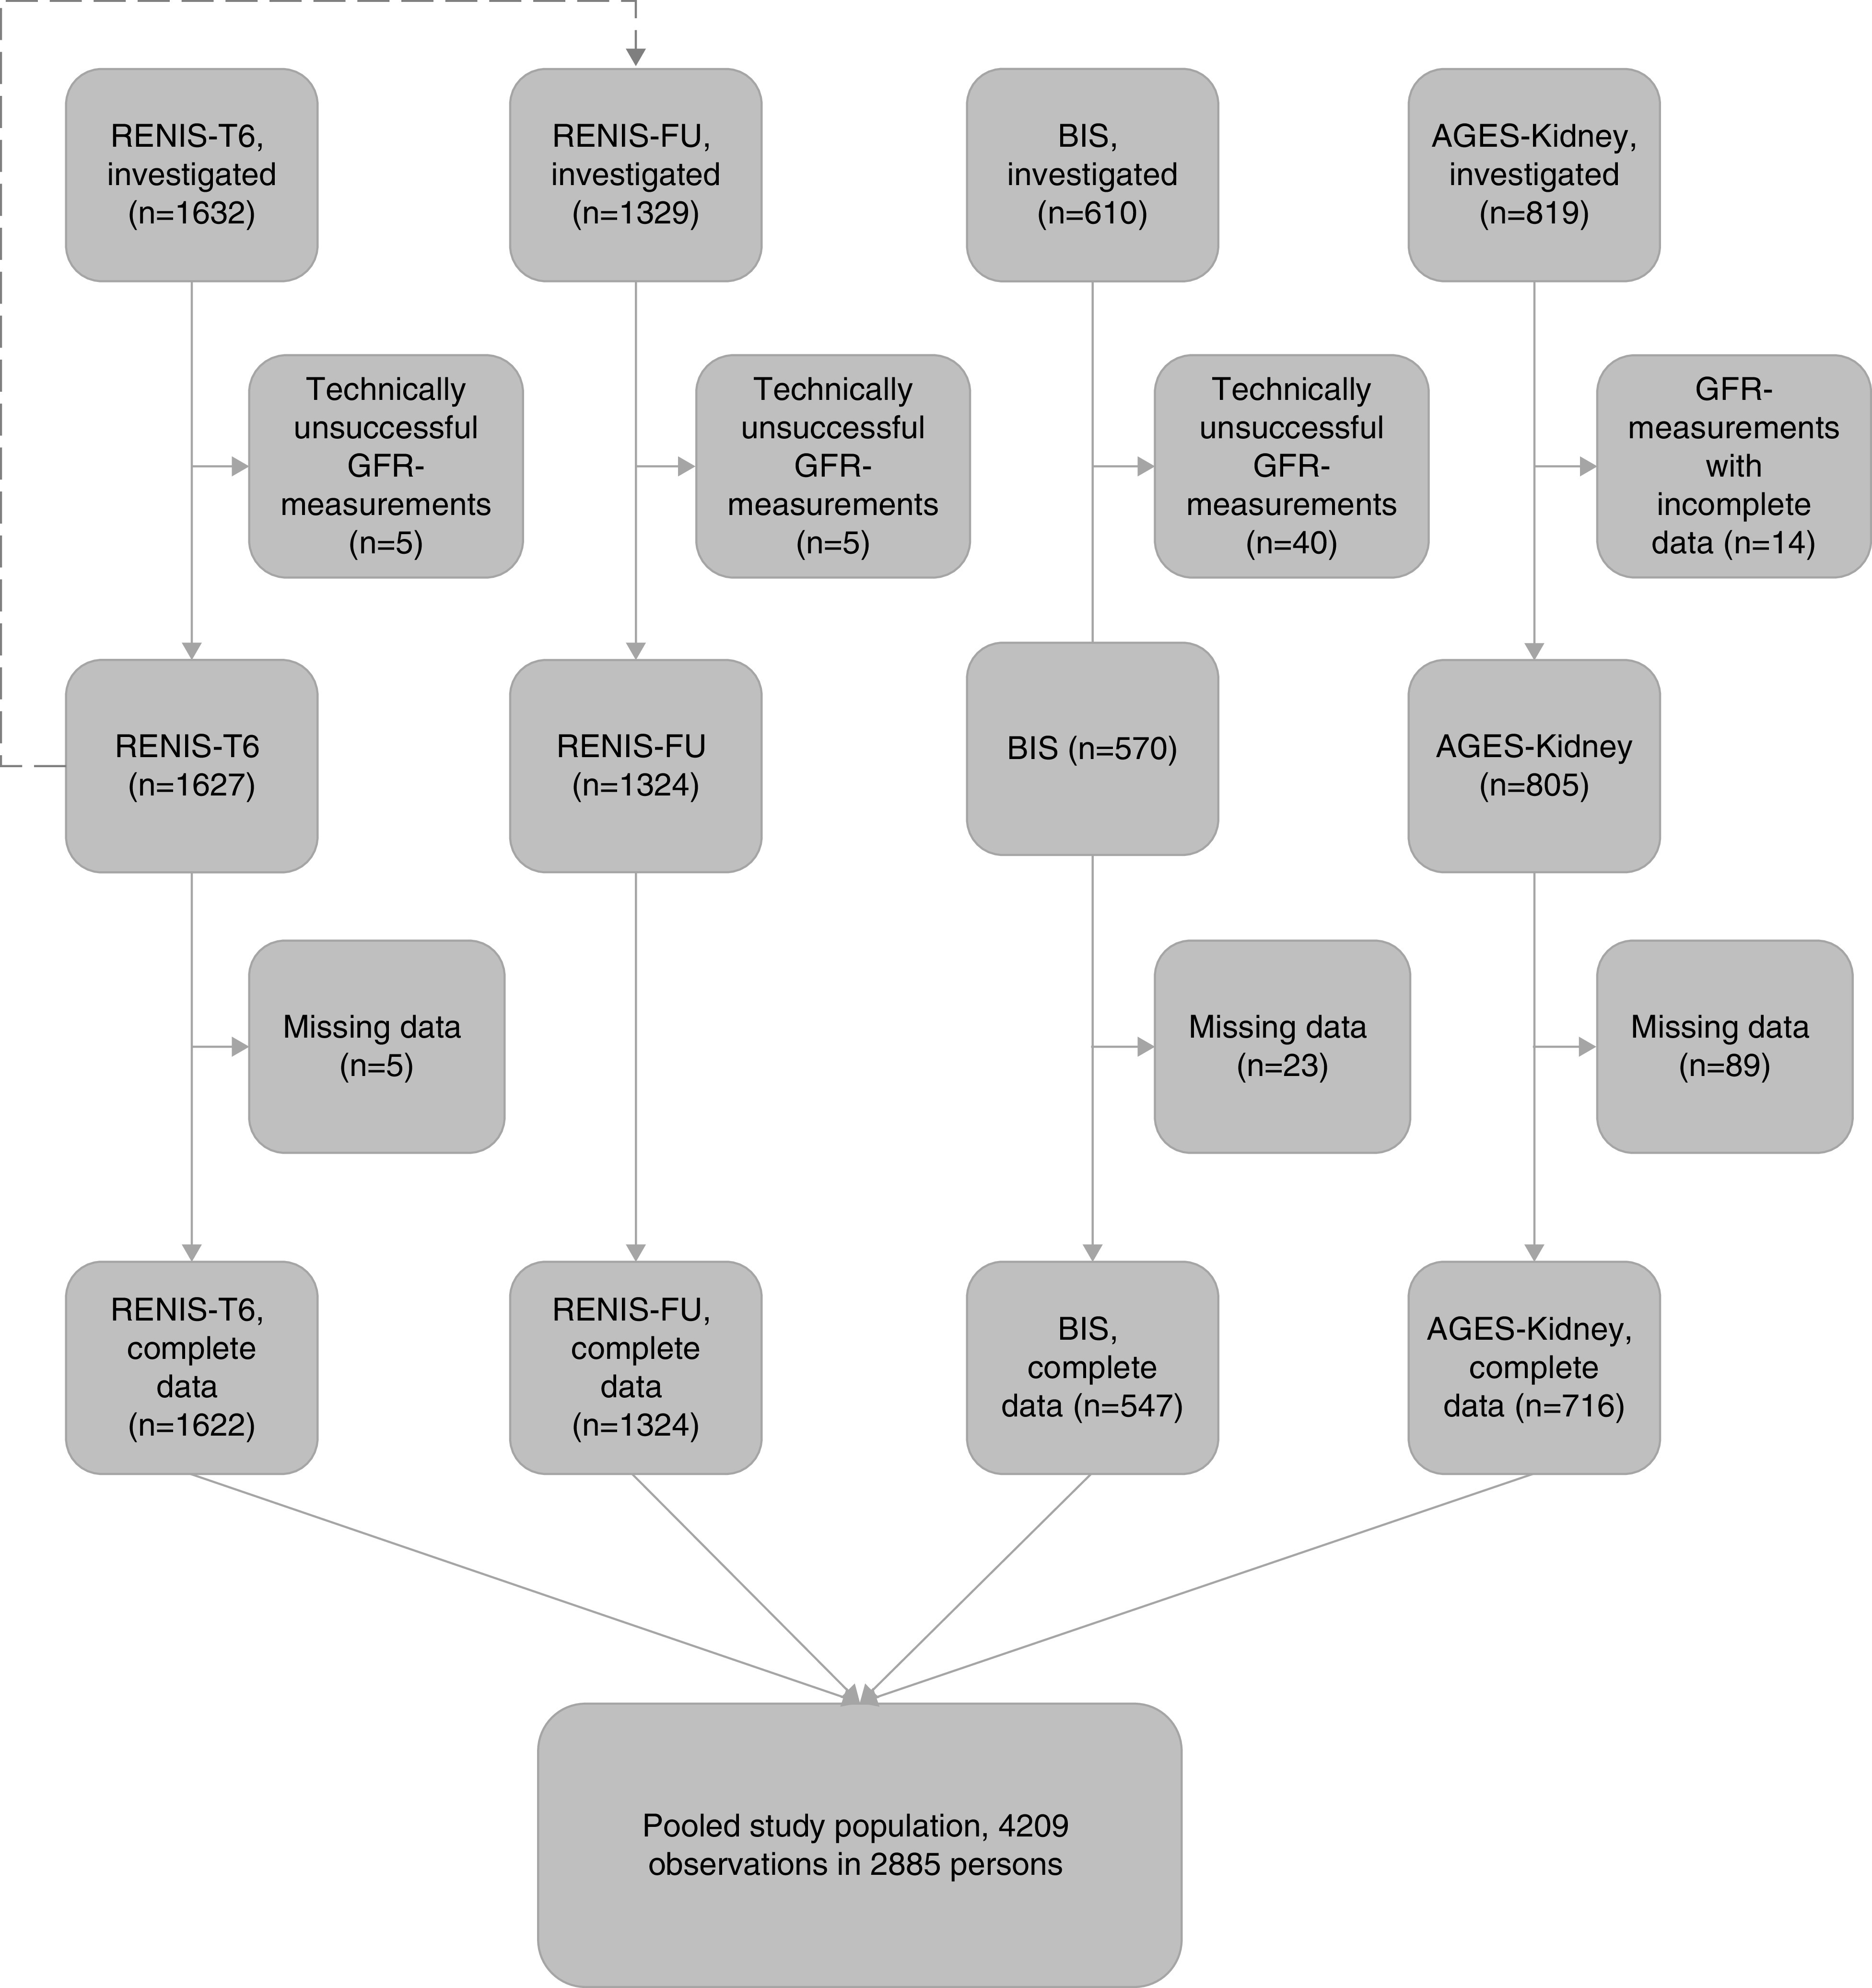
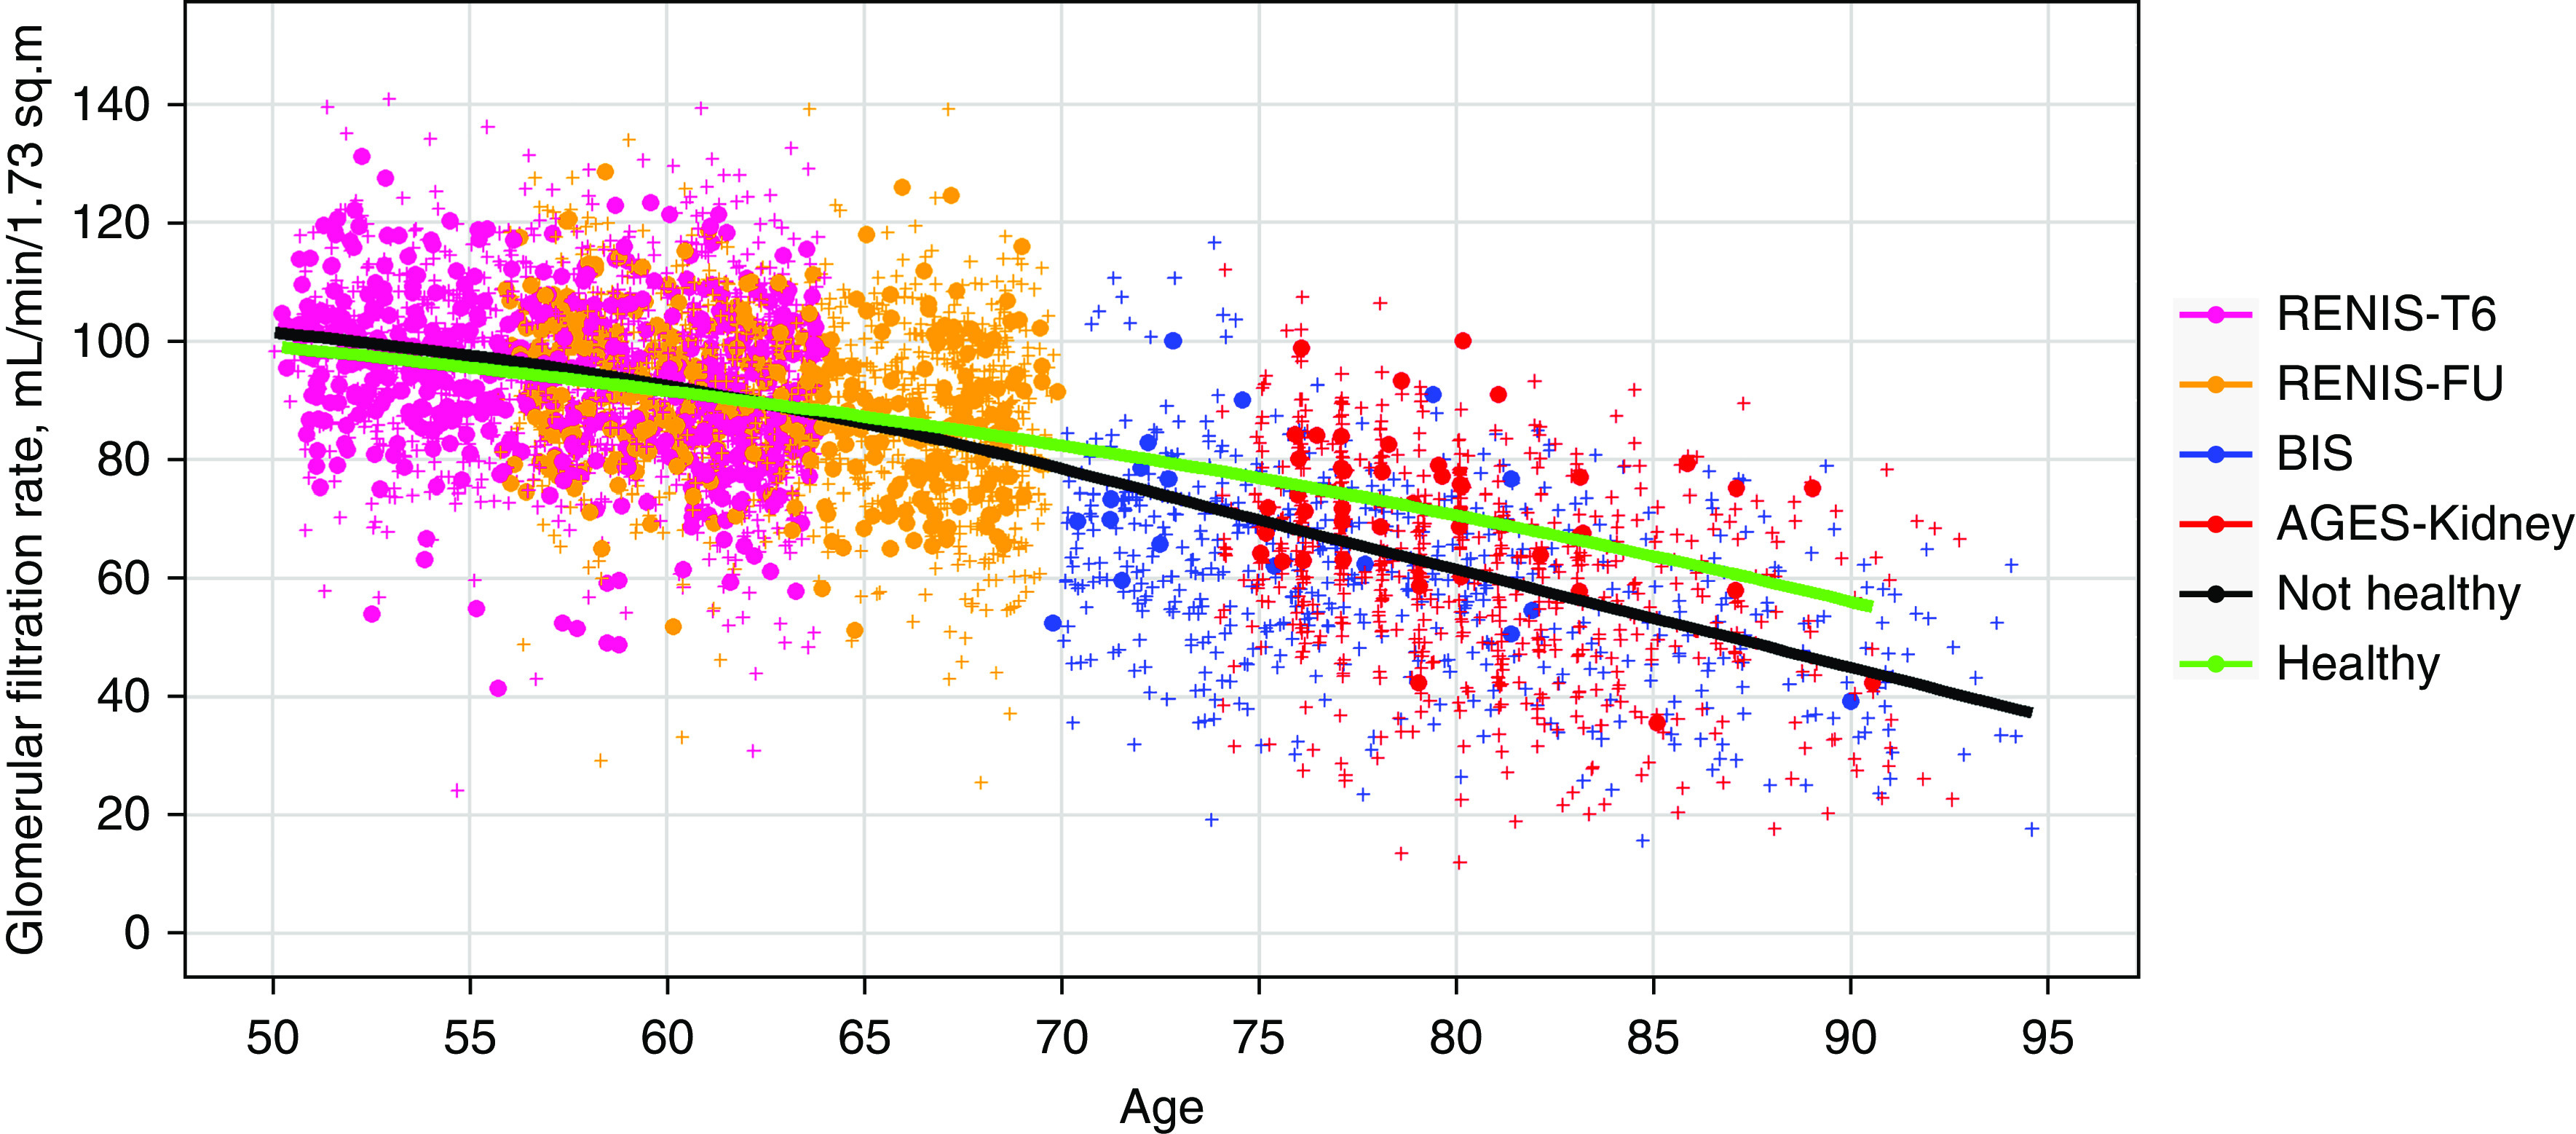
Methods: We investigated the cross-sectional association between measured GFR, age, and health in persons aged 50-97 years in the general population through a meta-analysis of iohexol clearance measurements in three large European population-based cohorts. We defined a healthy person as having no major chronic disease or risk factors for CKD and all others as unhealthy. We used a generalized additive model to study GFR distribution by age according to health status.
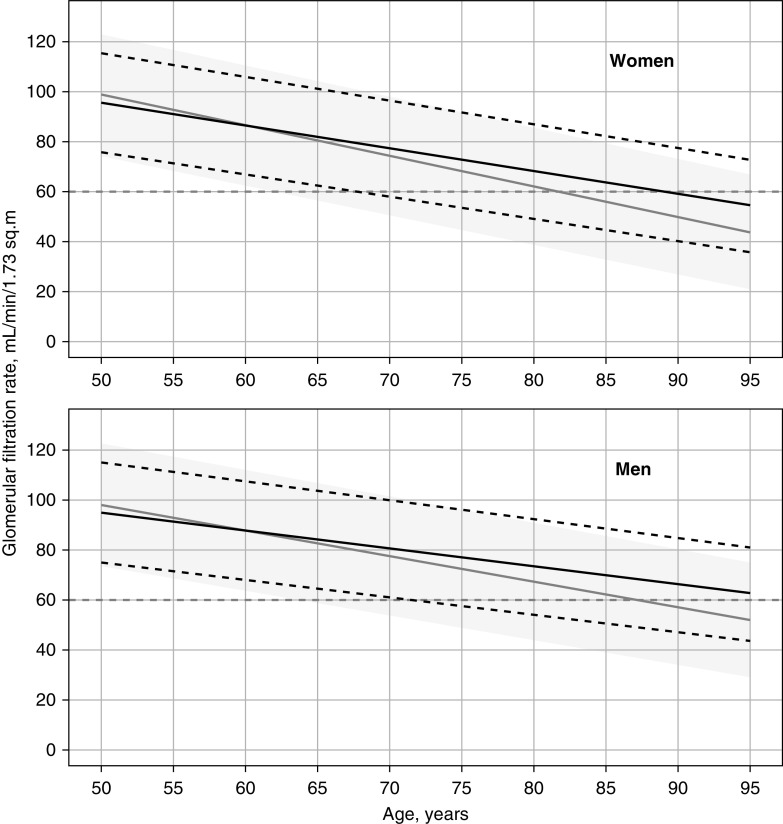
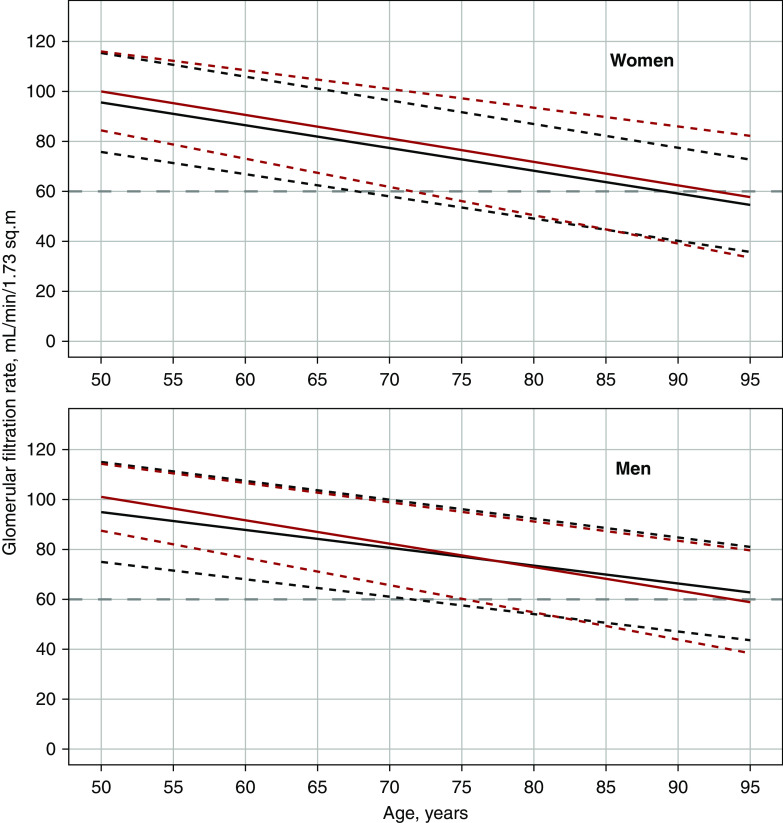
Results: There were 935 (22%) GFR measurements in persons who were healthy and 3274 (78%) in persons who were unhealthy. The mean GFR was lower in older age by -0.72 ml/min per 1.73 m2 per year (95% confidence interval [95% CI], -0.96 to -0.48) for men who were healthy versus -1.03 ml/min per 1.73 m2 per year (95% CI, -1.25 to -0.80) for men who were unhealthy, and by -0.92 ml/min per 1.73 m2 per year (95% CI, -1.14 to -0.70) for women who were healthy versus -1.22 ml/min per 1.73 m2 per year (95% CI, -1.43 to -1.02) for women who were unhealthy. For healthy and unhealthy people of both sexes, both the 97.5th and 2.5th GFR percentiles exhibited a negative linear association with age.
Conclusions: Healthy aging is associated with a higher mean GFR compared with unhealthy aging. However, both the mean and 97.5 percentiles of the GFR distribution are lower in older persons who are healthy than in middle-aged persons who are healthy. This suggests that healthy aging is not associated with preserved GFR in old age.
Keywords: epidemiology and outcomes; geriatric nephrology; glomerular filtration rate; glomerular hyperfiltration; renal dysfunction; renal function decline.
Copyright © 2020 by the American Society of Nephrology.
Figures
References
-
- Xie Y, Bowe B, Mokdad AH, Xian H, Yan Y, Li T, et al.: Analysis of the Global Burden of Disease study highlights the global, regional, and national trends of chronic kidney disease epidemiology from 1990 to 2016. Kidney Int 94: 567–581, 2018. - PubMed
-
- Agarwal R, Bunaye Z, Bekele DM, Light RP: Competing risk factor analysis of end-stage renal disease and mortality in chronic kidney disease. Am J Nephrol 28: 569–575, 2008. - PubMed
-
- Levey AS, Inker LA, Coresh J: Chronic kidney disease in older people. JAMA 314: 557–558, 2015. - PubMed
-
- Muntner P: Longitudinal measurements of renal function. Semin Nephrol 29: 650–657, 2009. - PubMed
Publication types
MeSH terms
Substances
Grants and funding
LinkOut - more resources
Full Text Sources
Medical
