. 2020 Jul 1;34(13-14):883-897.
doi: 10.1101/gad.337212.120. Epub 2020 Jun 4.

Nutrient-dependent control of RNA polymerase II elongation rate regulates specific gene expression programs by alternative polyadenylation

Affiliations

Nutrient-dependent control of RNA polymerase II elongation rate regulates specific gene expression programs by alternative polyadenylation

Carlo Yague-Sanz et al. Genes Dev. .

Abstract

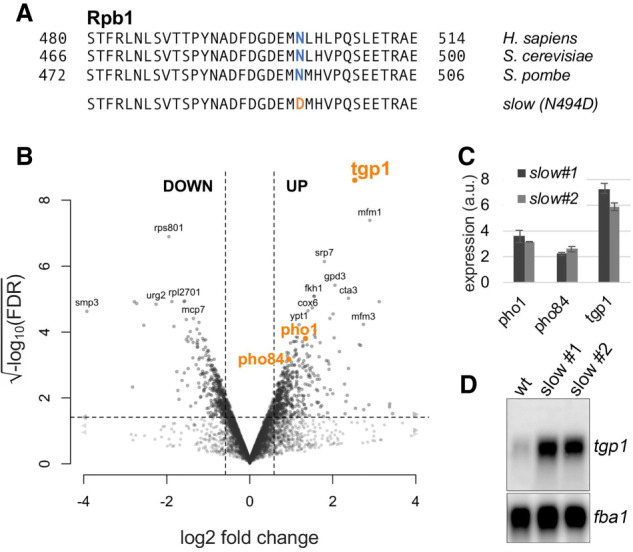
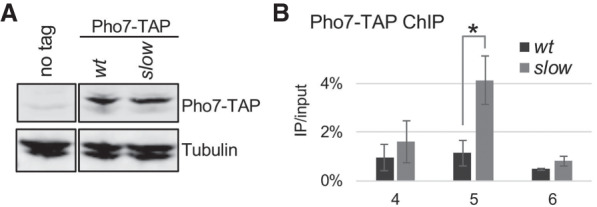
Transcription by RNA polymerase II (RNAPII) is a dynamic process with frequent variations in the elongation rate. However, the physiological relevance of variations in RNAPII elongation kinetics has remained unclear. Here we show in yeast that a RNAPII mutant that reduces the transcription elongation rate causes widespread changes in alternative polyadenylation (APA). We unveil two mechanisms by which APA affects gene expression in the slow mutant: 3' UTR shortening and gene derepression by premature transcription termination of upstream interfering noncoding RNAs. Strikingly, the genes affected by these mechanisms are enriched for functions involved in phosphate uptake and purine synthesis, processes essential for maintenance of the intracellular nucleotide pool. As nucleotide concentration regulates transcription elongation, our findings argue that RNAPII is a sensor of nucleotide availability and that genes important for nucleotide pool maintenance have adopted regulatory mechanisms responsive to reduced rates of transcription elongation.

Keywords: NTP sensing; RNA polymerase II; alternative polyadenylation; phosphate starvation; transcription elongation rate; transcription termination.


Figures

Figure 1.
Figure 1.
Transcriptome-wide analysis of gene expression changes in the S. pombe Rpb1 slow mutant. (A) Multiple sequence alignment of a conserved region in the catalytic core of Rpb1. The conserved asparagine residue is colored in blue, whereas the substitution is colored in orange in the slow mutant. (B) Volcano plot of statistical significance against fold change (in log2) of gene expression in the slow mutant relative to the wild-type control (n = 7049 genes). The dashed lines represent the thresholds for calling significant differential gene expression: FDR <0.01 and absolute log2 fold change >log2(1.5). To ease viewing, genes with values beyond axes limits are represented by arrowheads. The phosphate-responsive genes tgp1, pho1, and pho84 are highlighted in orange. (C) RT-qPCR analysis of tgp1, pho1, and pho84 mRNA levels in independent slow mutants relative to the wild-type parental strain from three independent experiments. (a.u.) Arbitrary units. Error bars represent the standard deviation of the mean. (D) Validation of tgp1 up-regulation in independent Rpb1 slow mutants by Northern blot. The fba1 mRNA was used as a loading control.
Figure 2.
Figure 2.
Premature termination of nc-tgp1 transcription in the RNAPII slow mutant. (A) On-scale representation of the nc-tgp1/tgp1 locus indicating the position of the amplicons (1–8) used for ChIP and qRT-PCR analyses throughout this study as well as the position of the proximal (pPAS) and distal (dPAS) poly(A) sites in nc-tgp1. (B) Normalized read coverage (left axes) at the nc-tgp1/tgp1 locus for the wild-type (blue area) and slow mutants (red areas) based from the RNA-seq data, and for previously published 3′ READS data (Liu et al. 2017b) in wild-type cells (black peaks at the bottom). The fold change (FC; right axis) is calculated between averaged mutant versus wild-type values for gene segments delimited by 3′READS peaks, which are represented by shaded vertical areas. (C) RT-qPCR analysis of nc-tgp1/tgp1 expression relative to wild-type cells in three independent experiments. The blue and red lines correspond to the baseline wild-type level and the mean value for the slow mutant, respectively. The individual replicates are shown as dashed lines. (D) Relative RNAPII occupancy in the slow mutant compared with the wild type at the nc-tgp1/tgp1 locus from nine independent experiments. The blue and red lines correspond to the baseline wild-type level and the mean value, respectively, for the slow mutant. The individual replicates are shown as dashed lines.
Figure 3.
Figure 3.
Redistribution of 3′ end processing factors and CTD Ser2 phosphorylation to the proximal poly(A) site of nc-tgp1 in the RNAPII slow mutant. (AC) Chromatin occupancy of Rna14 (A), Seb1 (B), and Rpb1 CTD Ser2 phosphorylation (C) at the nc-tgp1/tgp1 locus in the RNAPII slow mutant (red line) relative to the wild-type control (blue line). Individual replicates (n = 3; dashed lines) were normalized to total RNAPII levels measured from the same chromatin preparation at each region and expressed relative to the wild type. The positions of the amplicons (1–8) used throughout this study are shown in Figure 3D. (D) On-scale representation of the nc-tgp1/tgp1 locus indicating the nucleotide sequences surrounding the proximal and distal poly(A) sites (pPAS and dPAS, respectively) of nc-tgp1. The modifications introducing five Seb1-binding sites downstream from the proximal nc-tgp1 (pPAS +5seb1 mutant) by CRISPR are shown at the right. (E) RT-qPCR analysis of nc-tgp1/tgp1 expression relative to wild type from three independent +5seb1 clones. The blue and orange lines correspond to the baseline wild-type level and the mean value for the +5seb1 mutant, respectively. The individual replicates are shown as dashed lines.
Figure 4.
Figure 4.
Increased recruitment of Pho7 at the tgp1 promoter in the rpb1 slow mutant. (A) Western blot analysis of TAP-tagged Pho7 in the wild-type and slow mutant with tubulin as a loading control. The image for the no-tag control strain was cropped from the same blot as the other two samples. (B) ChIP analysis of Pho7-TAP binding at the tgp1 promoter (amplicons 4–6, as described in Figs. 2, 3) in the wild-type and slow mutant. The error bars represent standard deviation of the mean from three independent experiments. The difference between the slow and wild-type strains is significant at region 5 (two-sided Student's t-test P-value = 0.019).
Figure 5.
Figure 5.
Phosphate-dependent regulation of tgp1 expression is controlled by premature termination of nc-tgp1 transcription. (A) Model for tgp1 regulation by alternative cleavage and polyadenylation of its upstream noncoding RNA nc-tgp1 (see text for details). (*) seb1-binding site; (CPF) cleavage and polyadenylation factor complex. (BE) Wild-type cells grown in phosphate-containing minimal media (+PO4) were shifted into either +PO4 or phosphate-free (−PO4) minimal media during 4 h for all experiments. The results are expressed relative to the +PO4 condition after the 4-h incubation. Individual replicates are shown as dashed lines and their average is displayed as a thick blue line. The amplicons 1–8 target the nc-tgp1/tgp1 locus, as described in Figures 2 and 3. (B) RT-qPCR analysis of nc-tgp1/tgp1 expression upon phosphate depletion from two independent experiments. (CE) Relative chromatin occupancy of Rpb1 (C), Rna14 (D), and Seb1 (E) at the nc-tgp1/tgp1 locus upon phosphate depletion from six (C) or three (D,E) independent experiments. Individual replicates were normalized to total RNAPII levels, as measured from the same chromatin preparation.
Figure 6.
Figure 6.
Widespread changes in poly(A) site selection in the rpb1 slow mutant. (A) Volcano plot of statistical significance (−log10 of false discovery rate, FDR) against the APA score defined as the log2 ratio of distal to proximal segment ratio between the slow mutants and the wild-type (n = 2208 genes with at least two independent PASs) (see the Materials and Methods). Dashed lines represent the thresholds to select significant APA events (in blue); absolute APA score >1 and FDR <0.01. The single red dot represents nc-tgp1. To ease viewing, genes with values beyond axes limits are represented by arrowheads. (B) Distribution of the significant APA events identified among gene features. The terms “proximal” and “distal” APA describe genes for which the slow mutation favors proximal (negative APA score) and distal (positive APA score) PAS usage, respectively. (CE) Normalized read coverage (left axis) at three different loci for the wild-type (blue area) and slow mutants (red areas) from RNA-seq data, and for previously published 3′ READS data (Liu et al. 2017b) in wild-type cells (black peaks; right axis). Black arrows indicate the proximal PAS at which the read coverage decreases in the slow mutant. Transcription is 5′ to 3′, left to right. (F) Sequence logo of UUG[UC]UG motif enriched downstream from affected versus unaffected proximal PAS. (G) Overlap between genes for which the RNAPII slow mutant significantly favors proximal (APA score <−1) poly(A) sites and the genes significantly down-regulated and up-regulated in the slow mutant. (***) P-value = 4.98×10−06; (ns) ot significant. (H) Northern blot analysis using a probe specific to tim11 highlighting the long (634-nt) and short (539-nt) isoforms. The average ratio (n = 3) between both isoforms, normalized to the wild-type parental strain, is indicated in italic below each lane.
Figure 7.
Figure 7.
Limiting NTP concentration activates phosphate-responsive genes. (A,B) RT-qPCR analysis of tgp1, pho1, and pho84 expression relative to nda2 in response to 6AU and MPA. Cells were grown in EMM and treated for 1 h with either 30 µg/mL of 6-azauracil (6AU) (A) or 30 µg/mL of mycophenolic acid (MPA) (B) or left untreated (ctl). Error bars represent the standard deviation of the mean over two independent experiments. (C) Northern blot analysis of tim11 short and long isoforms. Total RNA prepared from wild-type cells that were treated with 6AU (lanes 3,4) or MPA (lanes 7,8), as described in A and B, was analyzed by Northern blotting. Control cells were treated with DMSO (lanes 1,2) or methanol (lanes 5,6). Independent replicates are shown (cf. lanes 1 and 3, 2 and 4, 5 and 7, and 6 and 8). The average ratio between both isoforms, normalized to the ratio in untreated control cells, is indicated in italic below each lane. (D) Model of homeostatic regulation of phosphate-responsive genes by control of RNAPII elongation kinetics and APA (see the text for details).

Similar articles

Cited by

References

    1. Ahn SH, Kim M, Buratowski S. 2004. Phosphorylation of serine 2 within the RNA polymerase II C-terminal domain couples transcription and 3′ end processing. Mol Cell 13: 67–76. 10.1016/S1097-2765(03)00492-1 - DOI - PubMed
    1. Alexander RD, Innocente SA, Barrass JD, Beggs JD. 2010. Splicing-dependent RNA polymerase pausing in yeast. Mol Cell 40: 582–593. 10.1016/j.molcel.2010.11.005 - DOI - PMC - PubMed
    1. Ard R, Allshire RC. 2016. Transcription-coupled changes to chromatin underpin gene silencing by transcriptional interference. Nucleic Acids Res 44: 10619–10630. 10.1093/nar/gkw801 - DOI - PMC - PubMed
    1. Ard R, Tong P, Allshire RC. 2014. Long non-coding RNA-mediated transcriptional interference of a permease gene confers drug tolerance in fission yeast. Nat Commun 5: 5576 10.1038/ncomms6576 - DOI - PMC - PubMed
    1. Ard R, Allshire RC, Marquardt S. 2017. Emerging properties and functional consequences of noncoding transcription. Genetics 207: 357-367. - PMC - PubMed

Publication types

MeSH terms